Source address: https://github.com/w1449550206/Linear-regression-with-tensorflow.git
import tensorflow as tf
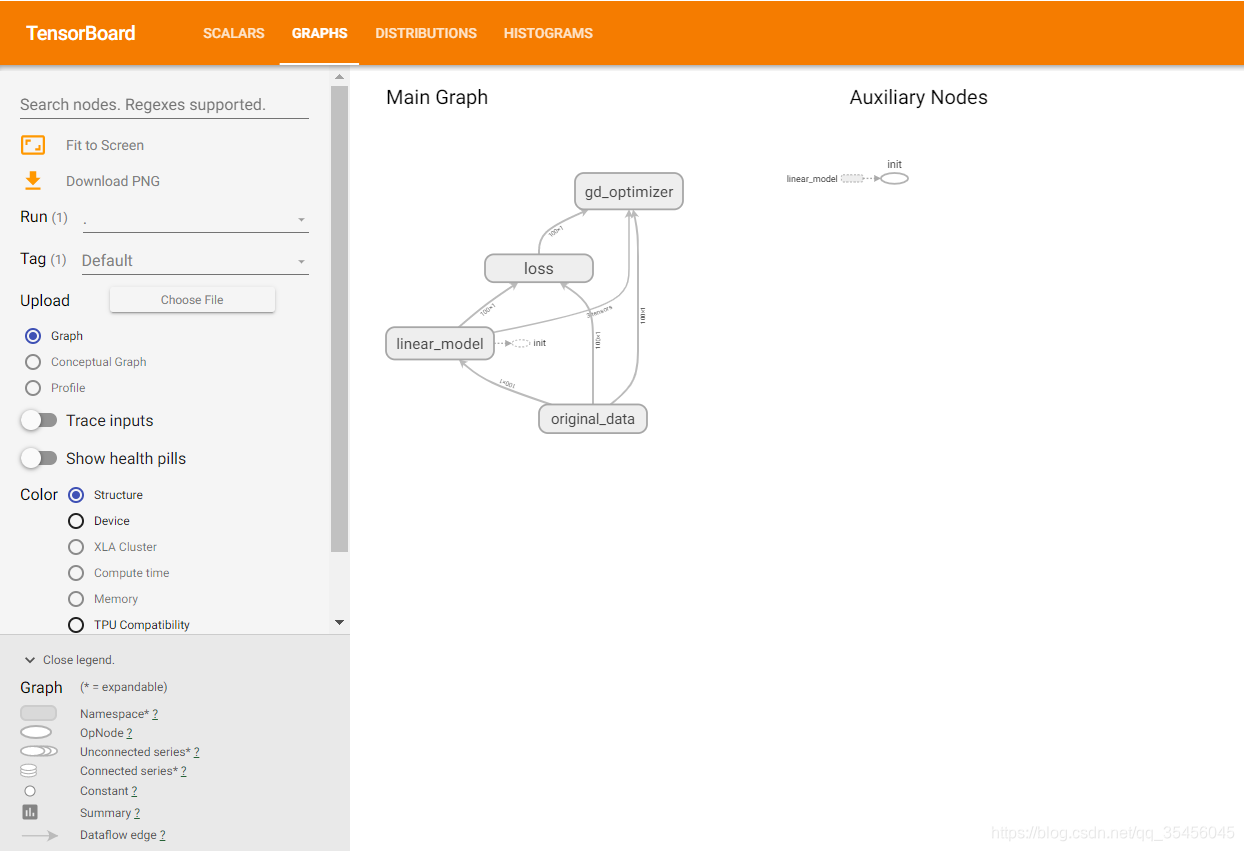
with tf.variable_scope("lr_model"):
def linear_regression():#定义名字
# 1)准备好数据集:y = 0.8x + 0.7 100个样本
# 特征值X, 目标值y_true
with tf.variable_scope("original_data"):#定义名字
X = tf.random_normal(shape=(100, 1), mean=2, stddev=2, name="original_data_x")
# y_true [100, 1]
# 矩阵运算 X(100, 1)* (1, 1)= y_true(100, 1)
y_true = tf.matmul(X, [[0.8]], name="original_matmul") + 0.7
# 2)建立线性模型:
# y = W·X + b,目标:求出权重W和偏置b
# 3)随机初始化W1和b1
with tf.variable_scope("linear_model"):#定义名字
weights = tf.Variable(initial_value=tf.random_normal(shape=(1, 1)), name="weights")
bias = tf.Variable(initial_value=tf.random_normal(shape=(1, 1)), name="bias")
y_predict = tf.matmul(X, weights, name="model_matmul") + bias
# 4)确定损失函数(预测值与真实值之间的误差)-均方误差
with tf.variable_scope("loss"):#定义名字
error = tf.reduce_mean(tf.square(y_predict - y_true), name="error_op")
# 5)梯度下降优化损失:需要指定学习率(超参数)
# W2 = W1 - 学习率*(方向)
# b2 = b1 - 学习率*(方向)
with tf.variable_scope("gd_optimizer"):#定义名字
optimizer = tf.train.GradientDescentOptimizer(learning_rate=0.01, name="optimizer").minimize(error)
# 2)收集变量
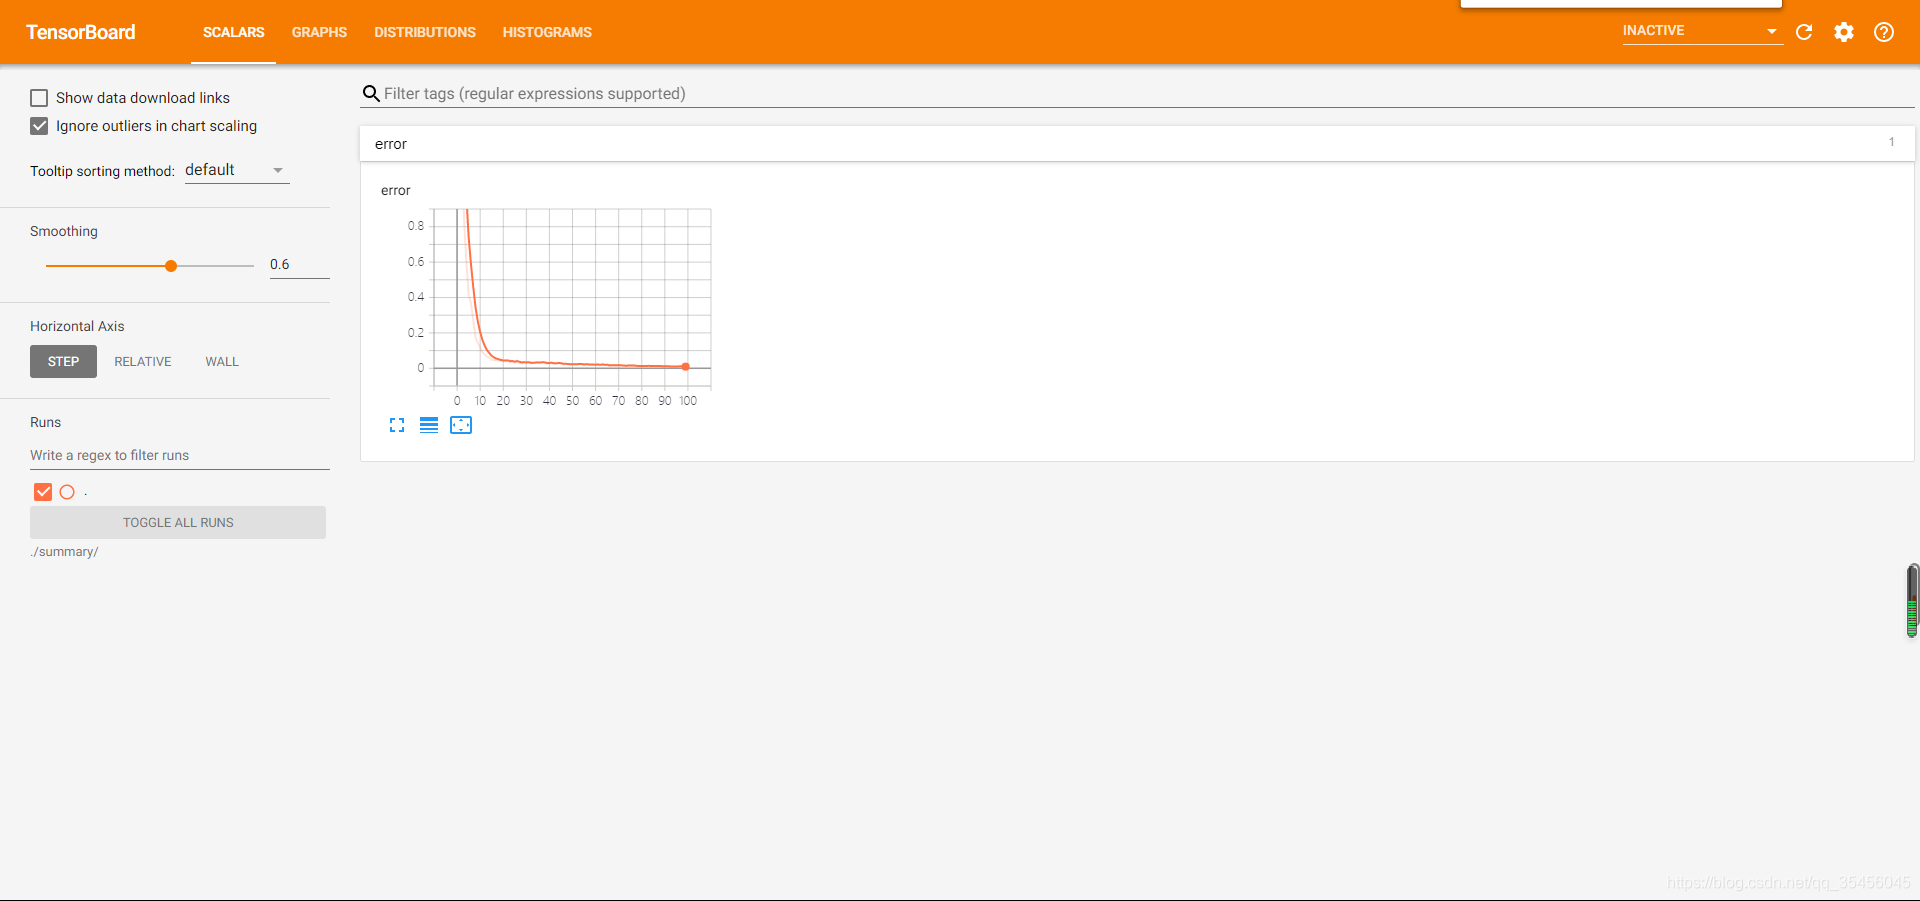
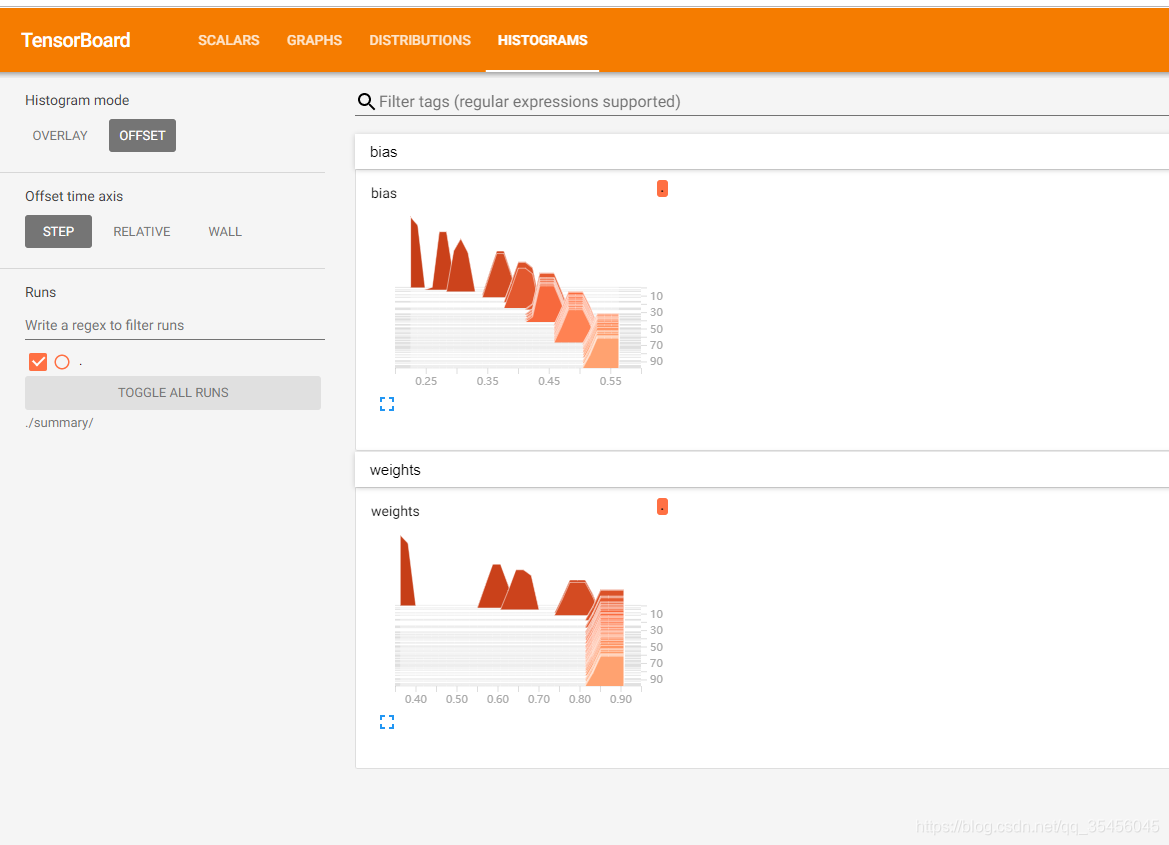
tf.summary.scalar("error", error)##生成准确率标量图
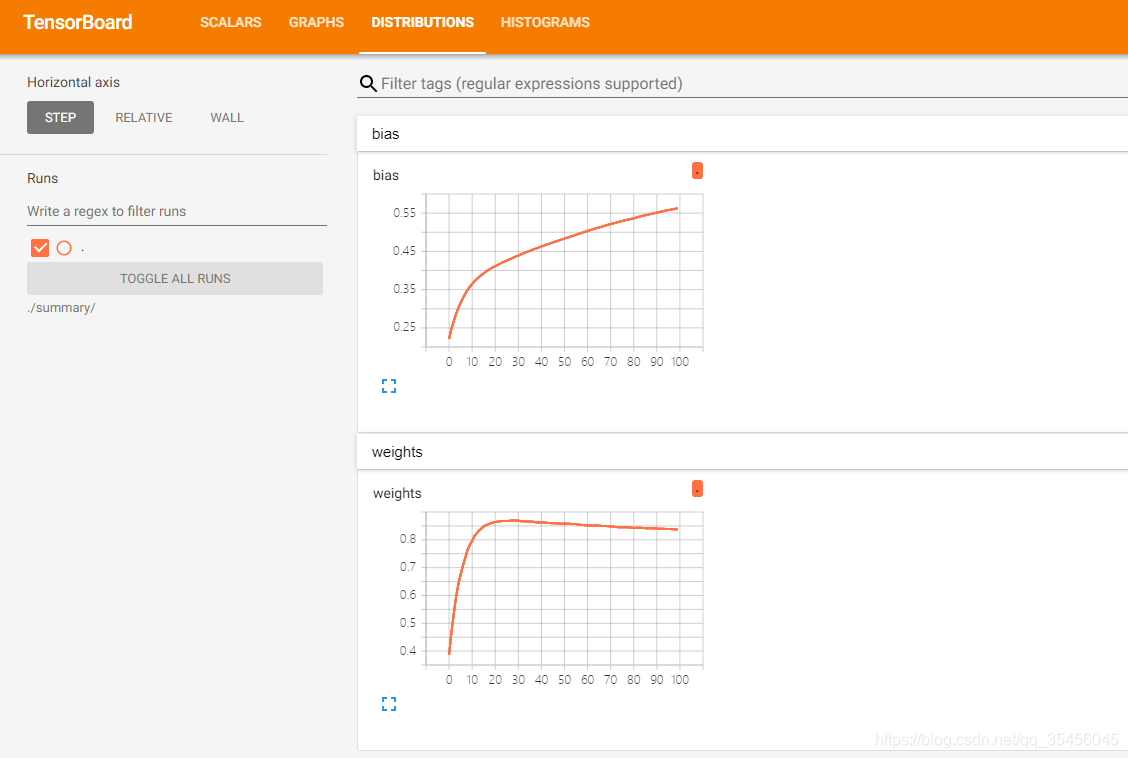
tf.summary.histogram("weights", weights)#用来显示直方图信息
tf.summary.histogram("bias", bias)#用来显示直方图信息
# 3)合并变量
merge = tf.summary.merge_all()
# 初始化变量
init = tf.global_variables_initializer()
# 开启会话进行训练
with tf.Session() as sess:
# 运行初始化变量Op
sess.run(init)
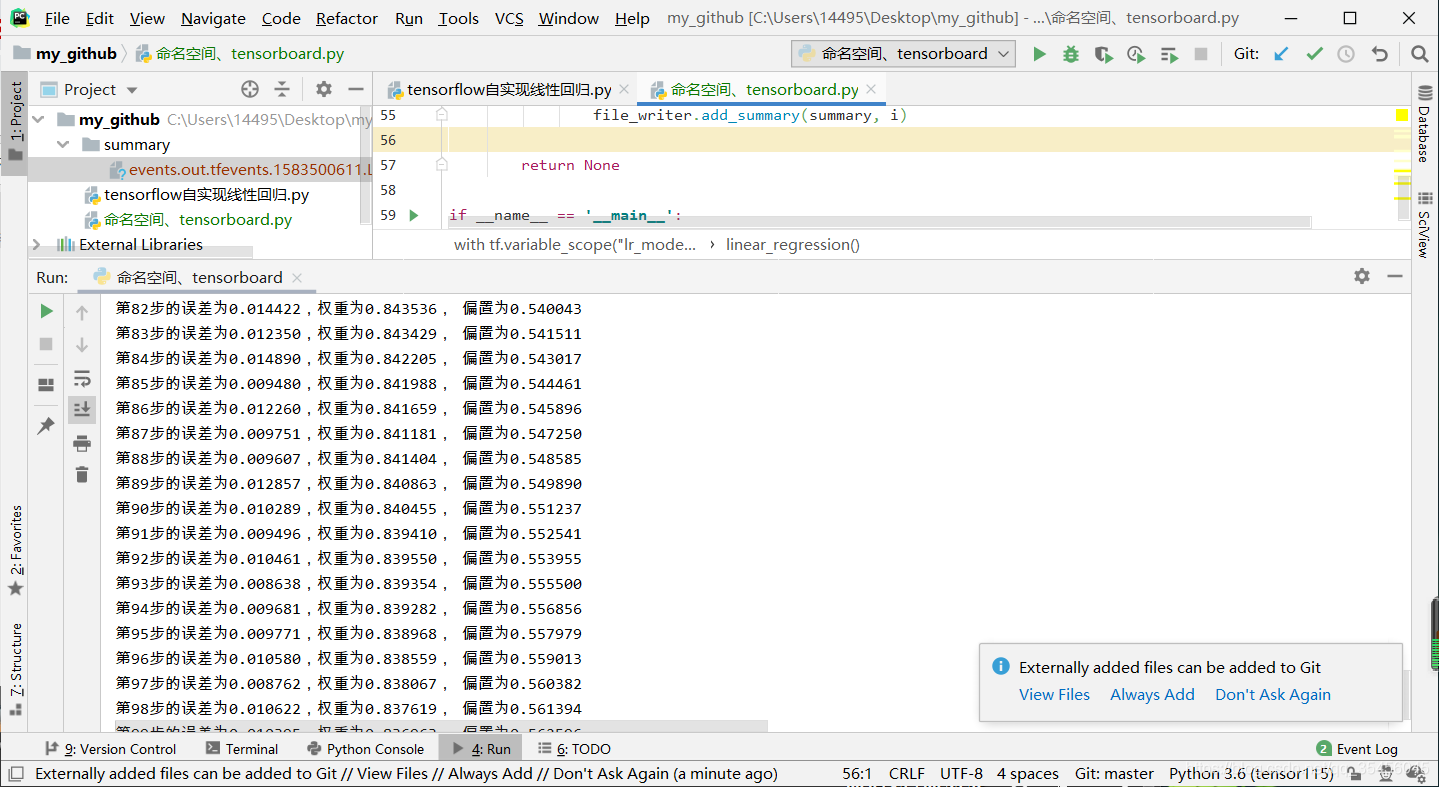
print("随机初始化的权重为%f, 偏置为%f" % (weights.eval(), bias.eval()))
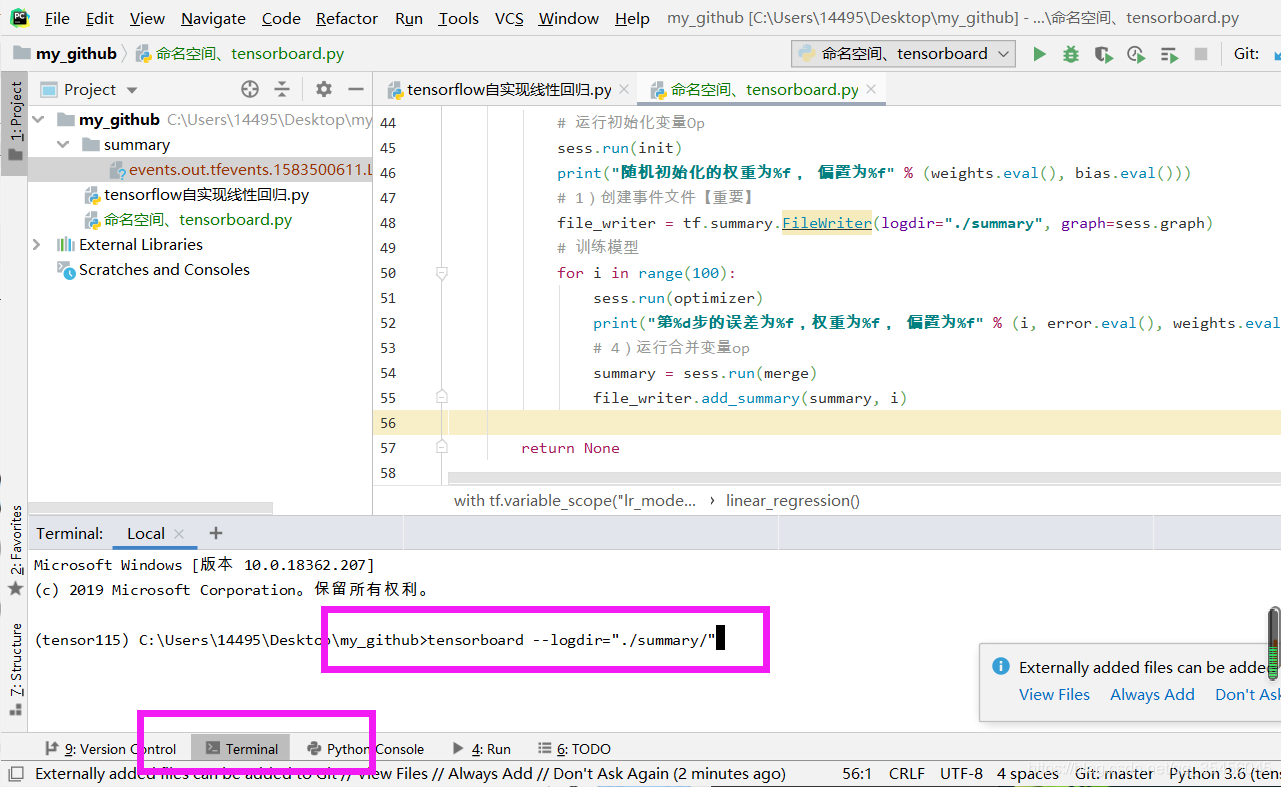
# 1)创建事件文件【重要】
file_writer = tf.summary.FileWriter(logdir="./summary", graph=sess.graph)
# 训练模型
for i in range(100):
sess.run(optimizer)
print("第%d步的误差为%f,权重为%f, 偏置为%f" % (i, error.eval(), weights.eval(), bias.eval()))
# 4)运行合并变量op
summary = sess.run(merge)
file_writer.add_summary(summary, i)
return None
if __name__ == '__main__':
linear_regression()
Visualization: