

Author | Someday
Introduction
This article mainly introduces the concepts and applications of business intelligence (BI) and Turing Data Analysis (TDA). BI helps companies make better decisions and strategic planning by collecting, organizing, analyzing and presenting data. However, there are problems with traditional BI construction ideas, such as the need for redevelopment when the business changes data requirements, and the low efficiency of analyzing underlying data. Therefore, TDA emerged as a one-stop self-service analysis platform. It builds public data sets according to analysis themes based on detailed data. Users can freely drag and drop analysis and save the results with one click, and can also share it with others for viewing. However, the construction of TDA also faces challenges such as comprehensive analysis dimension indicators, accurate data caliber, and query performance. In response to these challenges, we put forward the goals of completeness, accuracy, efficiency and speed, and achieve these goals through process mechanisms and function construction as well as the MPP data engine.
The full text is 4766 words and the estimated reading time is 15 minutes.
01 Background and Objectives
BI stands for Business Intelligence, which helps companies stay ahead of their competitors and make better business decisions and strategic planning by collecting, organizing, analyzing and presenting data. The process of collecting and organizing is the construction of a data warehouse, and the analysis and presentation of data is the construction of a visual analysis platform.
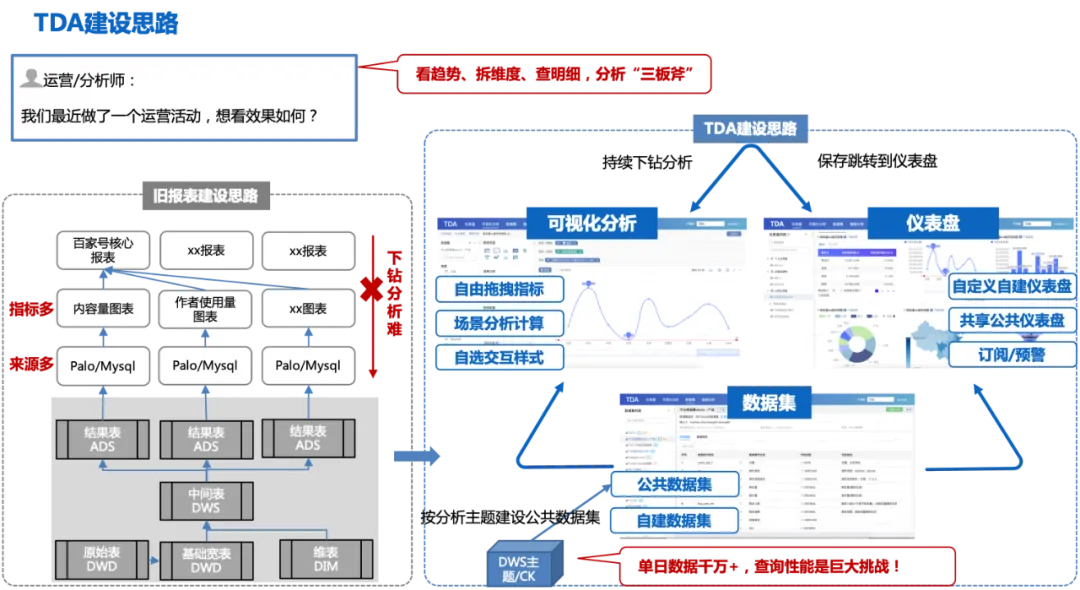
A common BI construction idea in the industry: If the business wants to see the data changes of a certain indicator, it requests the middle office. The data RD is modeled layer by layer from ODS>DWD>DWS>ADS, and then the customized ADS result table is developed and implemented in Palo/Mysql. , and finally configure multiple charts and save them in reports for business viewing. Although this construction idea meets the business's data analysis needs, it faces two problems: 1. When the business changes data requirements, the ADS result table needs to be customized and developed again, which will repeatedly occupy R&D manpower; 2. It only solves the problem of business analysis. If you want to further drill down and analyze the reasons for fluctuations, it will be difficult because the underlying table is an aggregate table that only contains the current chart data. If you want to analyze it, you can only download the detailed data and then analyze it through Excel or other methods, which is relatively inefficient. .
TDA (Turing Data Analysis) is a one-stop self-service analysis platform built to solve the above-mentioned problem of long analysis links in BI.
The construction idea of TDA: Based on the DWD detailed wide table, public data sets are constructed according to the analysis theme (single-day data is tens of millions +). Users can drag and drop analysis based on the public data sets freely, and the analysis results can be saved to personal dashboards or published with one click. Create a public dashboard and share it with others; others can check the fluctuation trend on the public dashboard, drill down to the visual analysis page to continue exploring the causes of fluctuations, and complete the one-stop analysis of "seeing trends, breaking down dimensions, and finding out details" Three axes.
The following figure is the overall process of TDA construction ideas:
This construction idea will also face some challenges:
1. The analysis dimension indicators must be complete, otherwise multiple data sets will need to be constructed, resulting in many and scattered data sets, the same problem as the previous report construction;
2. The data caliber must be accurate and authoritative;
3. With tens of millions of data in a single day, query performance is a huge challenge.
In response to the above challenges, we have also formulated corresponding goals to meet the needs of efficient business analysis:
1. Complete (analysis dimension indicators must be complete, covering 80%+ of business needs);
2. Accurate (uniform caliber, accurate data);
3. Timeliness (data output timeliness is T+10h);
4. Fast (1 billion level data query within 10 seconds).
The TDA platform will ensure complete, accurate and efficient data set construction from the perspective of process mechanism and function construction, combine with the MPP data engine to ensure query performance, and improve users' analysis efficiency through BI's visual drag and drop, scene analysis, self-service modeling and other capabilities. .
02 Technical solution
Based on the above analysis, TDA's product positioning is a BI platform that enables users to achieve one-stop self-service query. Users can freely drag and drop data sets, conduct visual data analysis, and build core dashboards. Help users achieve a one-stop experience of query analysis from the following perspectives:
Business Kanban iteration and efficiency improvement (self-service) : The data report iteration mode has changed, from the PM request RD scheduling mode to gradually converted to PM/operation self-service operation (making Kanban/analyzing data).
Data insight analysis efficiency improvement (extremely fast) : a single data query is reduced from minutes to seconds, the efficiency of indicator fluctuation analysis is increased by 20 times, and the end-to-end analysis of single indicator fluctuation attribution is within 2 hours -> 5 minutes.
One-stop self-service business analysis (one-stop) : realizes data trend observation, dimensional drill-down analysis, detailed export and other functions, realizing an integrated experience of data monitoring and data analysis.
The function matrix of this product is as follows:
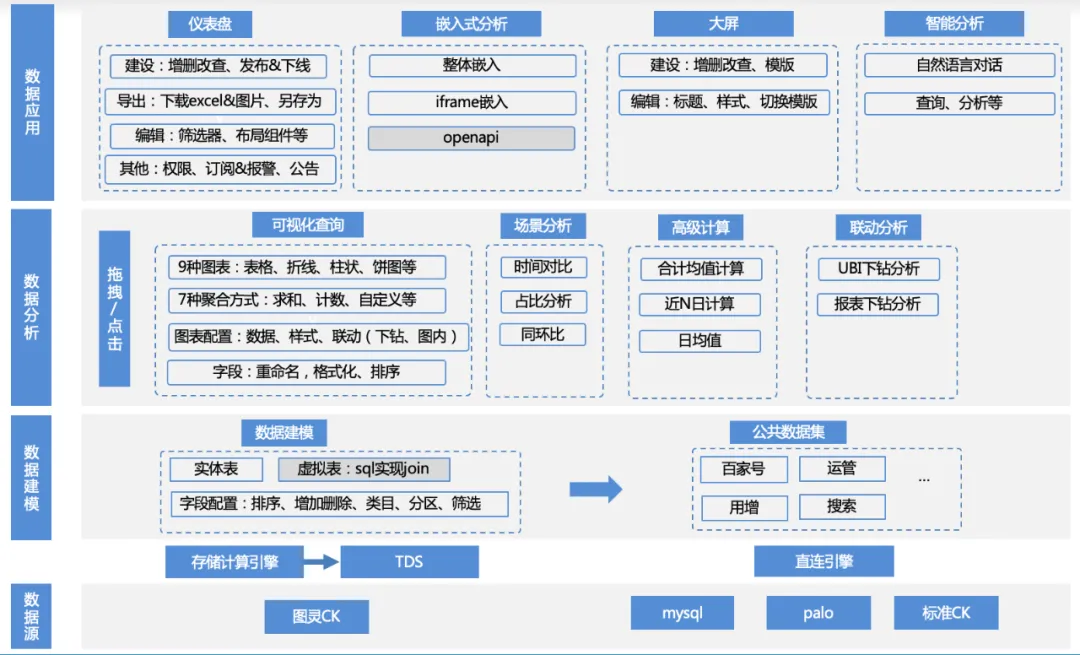
1. Data source access : The business uses TDS to calculate the upstream Turing table data through the calculation engine, then writes the data to engines such as clickhouse/mysql/palo, and accesses it through direct connection; or the business provides its own palo/ mysql data source access.
a. Data source management: data source addition, deletion, modification and query, clickhouse/mysql/palo and other engine driver adaptation
2. Data modeling : After connecting to the data source, the data can be loaded into the product by writing SQL and directly from the original table. But these tables usually require some simple secondary processing to turn them into data sets that can be analyzed.
a. Data set management: functions such as addition, deletion, modification, data preview, schema viewing, one-click visual analysis, etc.
b. Data set field management: addition, deletion, modification, field sorting, custom fields, etc.
c. Data set category management: addition, deletion, modification, and custom sorting of the categories to which fields belong, etc.
d. Data set directory management: addition, deletion, modification, and custom sorting of the data set directory, etc.
3. Data analysis : Based on the data set, users can freely drag and drop indicators, dimensions, filters, select appropriate chart types and scenario analysis methods, and perform analysis and calculations.
a. Data configuration: switch data sets, add custom fields
b. Chart configuration: table, line chart, bar chart, pie chart and other chart type configurations, legend color settings, data format settings, etc.
c. Scenario analysis: support for multiple scenario analysis capabilities such as daily average value, year-on-year comparison, proportion, total, etc.
d. Attribution analysis: self-service attribution analysis capabilities
e. Interactive analysis: drill-down analysis, etc.
4. Data application : Users can save the analysis results to the dashboard, embed it into a third-party platform, save it to the big screen, or directly use it for intelligent analysis, etc.
a. Dashboard management: dashboard addition, deletion, modification, custom sorting, publishing and offline, data export, subscription alerts, etc.
b. Embedded analysis: ifame embedded, sdk embedded and other embedded modes
c. Large screen: real-time large screen
d. Intelligent analysis: LUI conversational analysis
2.1 Overall design
The overall architecture of TDA is shown in the figure below:
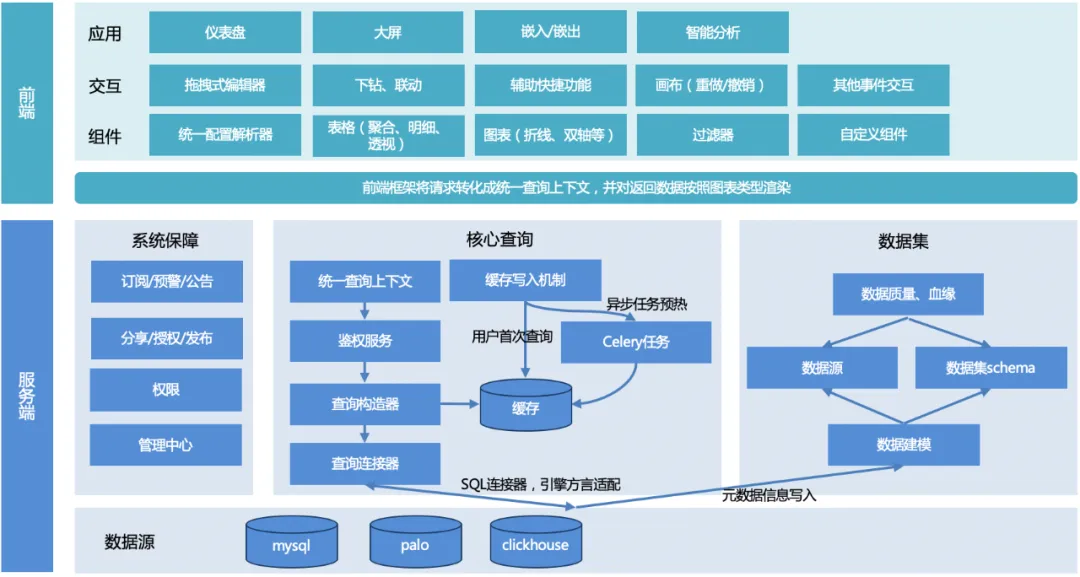
The overall process: the user initiates a query, the server unifies the query context, constructs the query object, adapts the underlying engine dialect, returns a unified data format, and then the front-end rendering framework adapts and renders according to the chart type.
Server:
1. Unified query context : In order to facilitate the reuse of common functions when expanding other chart functions later, a unified query context is designed.
2. Query constructor : Construct a query object (can be multiple, for example, to paginate a table, you need to construct two query objects, one is a paging query object, and the other is a counting query object) according to the request parameters passed from the front end.
3. Query connector :
a. Currently there is only a SQL connector, which is used to satisfy the engine of SQL query (mysql, palo, clickhouse, etc.). Different engines, syntax or some functions may be different, and they must be adapted through different engine rule configurations;
b. Other connectors can be expanded to satisfy non-SQL queries in the future.
4. Cache writing : To ensure query performance, there are two writing methods: writing when the user accesses for the first time, or preheating the cache through celery scheduled tasks.
5. Data set module : Provide data support, establish links with underlying data sources, and ensure data quality.
6. System guarantee module : Subscription, early warning, and announcement realize data early warning capabilities. Sharing, publishing, and authorization improve data circulation efficiency. The management center and permissions provide underlying management and permission support for data.
front end:
1. Component library : Provides configuration analysis, different chart rendering components, filter components and custom component capabilities.
2. Interaction : Encapsulates page interaction capabilities, including drag-and-drop editor, drill-down linkage, auxiliary shortcut functions, canvas capabilities and other event interactions.
3. Application : Implement different visual applications for different users and usage scenarios, such as dashboards, large screens, etc.
2.2 Detailed design
2.2.1 Core query
One-stop self-service BI, through public data set modeling ideas, realizes the three-point analysis idea of "trends, dimensions, and details", which will face many challenges, including:
-
Multi-source data, multi-chart presentation, and multiple scenario analysis and calculations : There is more than one underlying data source engine in the BI system. In order to flexibly expand data sources, the presentation style also requires rich chart support, and at the same time, in order to meet the analysis in different scenarios. Calculation needs to support common analysis capabilities such as month-on-month and daily average values.
-
Querying tens of millions of data in seconds : The idea of constructing public data sets facilitates analysis but also introduces new challenges. The amount of tens of millions of data in a single day poses a huge challenge to query performance.
In response to the above problems, corresponding solutions have been formulated:
-
Unified query : Unify the query context, construct the query object, adapt the underlying engine dialect, return a unified data format, and the front-end rendering framework adapts rendering according to the chart type.
-
Query optimization : Ⅰ> Caching + automatic rolling, covering 70% of public dashboard requests; Ⅱ> Optimizing the construction of SQL queries and making full use of engine-side aggregation capabilities; III> Multiple domain name concurrent requests and multi-coroutine response processing.
Unified query:
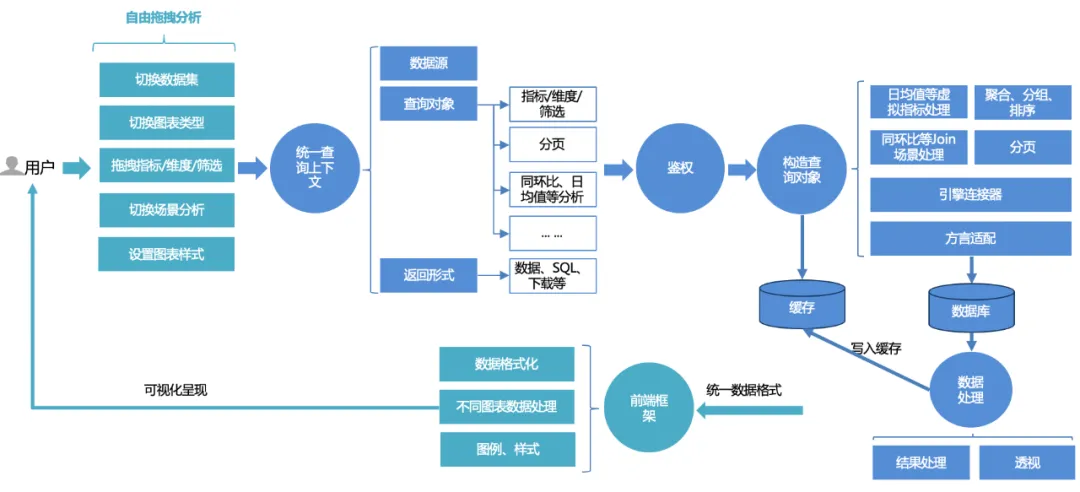
The unified query process for platform users is as follows:
1. Users can freely drag and drop analysis on the page : switch data sets, switch between different chart types, drag and drop indicators, dimensions, filters, and query; or if they want to use some advanced scene analysis capabilities, they can switch configurations with one click.
2. The front-end request will be processed into a unified query context : including data source, query object, and return form. The query object encapsulates basic indicators, dimensions, filtering information, and advanced analysis configurations such as year-on-year comparison and daily average value.
3. Unified authentication service : Based on the core of dual authentication of dashboard and data set, it also supports more fine-grained permission control of row and row permissions.
4. Construct the query object : first complete the basic SQL construction (aggregation, grouping, filtering) based on indicators, dimensions, and filtering triples, then assemble the sorting logic according to the sorting rules, and add some advanced analysis options (such as month-on-month, daily average, etc.) Additional assembly logic and then paging processing need to be combined with dialect adaptation. When querying data, query different databases (such as mysql, palo, clickhouse, etc.) according to different engine linkers.
5. Query & process data : After querying the data through the linker, process the data (date format processing, perspective of line charts, etc.).
6. Cache : The processed data is written to the cache; or if the cache is directly hit during the query, the cached data is directly read and returned.
7. Front-end rendering framework unified rendering : returns a unified data format, and the front-end completes adaptive rendering of charts, styles, etc.
Query optimization: Ⅰ>Cache + automatic roll-up, covering 70% of public dashboard requests.
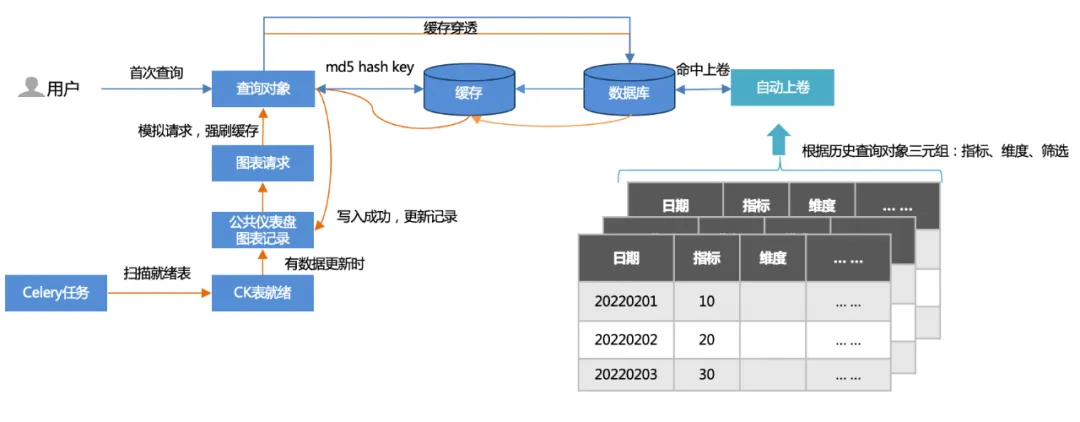
1. Two caching methods :
First query: The user first accesses (cache penetration), queries the database, and then writes to the cache.
Offline task warm-up: scan public dashboard chart records and simulate chart requests (500+ per update) to force cache flushing.
2. Automatic winding :
Based on the triples (indicators, dimensions, filtering) of historical queries, a roll-up table is established, and the query hits the roll-up table. The amount of data queried is greatly reduced, and the performance is accelerated.
Query optimization: Ⅱ> Optimize the construction of SQL queries and make full use of the aggregation capabilities of MPP architecture engines (such as clickhouse/palo, etc.).

In the public data set analysis scenario, after querying the data, it is almost impossible to aggregate and calculate it in the memory (for example, (a + b) / c needs to be aggregated and calculated based on the detailed data a, b, c), and you need to use the engine-side MPP The query capability of the architecture refines the aggregation calculation to the engine side for execution, just like month-on-month aggregation, the data volume involves tens of billions, the data volume after the engine side aggregation calculation is reduced by dozens of times, and the performance is also improved several times.
Query optimization: III>Multiple domain names concurrent requests, multi-coroutine response processing.
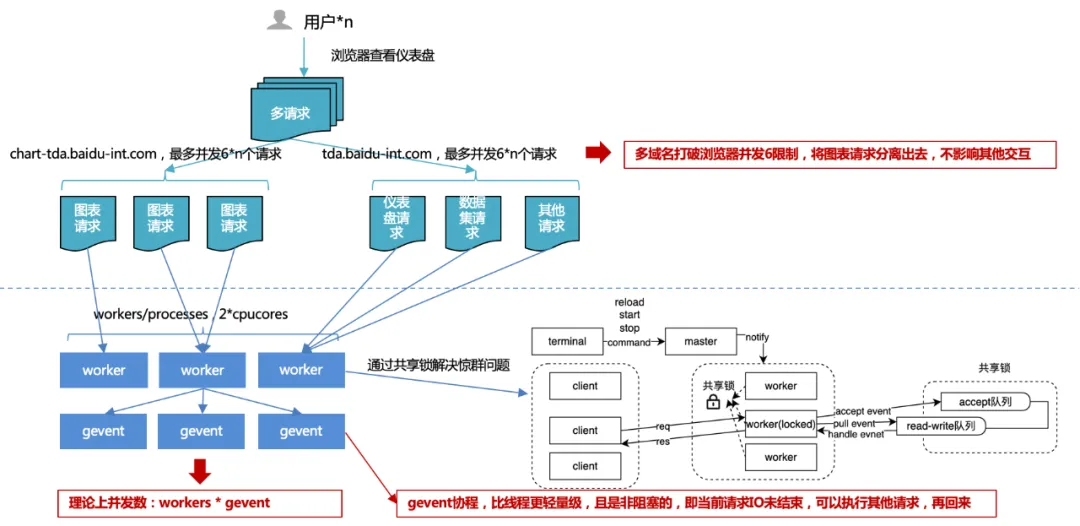
1. Browser concurrency limit of 6 : By using multiple domain names, chart requests are offloaded from other requests to ensure smooth platform interaction and increased chart request concurrency, thereby improving overall performance.
Consider operating system port resources: the total number of PC ports is 65536, so a TCP (http is also tcp) link occupies one port. The operating system usually opens half of the total ports to external requests to prevent the number of ports from being exhausted quickly.
Excessive concurrency leads to frequent switching and performance problems: one thread handles one http request, so if the number of concurrencies is huge, frequent thread switching will occur. And thread context switching is sometimes not a lightweight resource. This results in more losses than gains, so a connection pool will be generated in the request controller to reuse previous connections. Therefore, we can think that the maximum number of connection pools under the same domain name is 4 to 8. If all the connection pools are used, subsequent request tasks will be blocked and subsequent tasks will be executed when there are free links.
Prevent a large number of concurrent requests from the same client from exceeding the server's concurrency threshold: The server usually sets a concurrency threshold for the same client source to avoid malicious attacks. If the browser does not set concurrency limits for the same domain name, it may cause the server's concurrency threshold to be exceeded. Got banned.
Client conscience mechanism: In order to prevent two applications from seizing resources, the stronger party will obtain resources without restriction, causing the weaker party to be permanently blocked.
2. Server-side multi-process + multi-coroutine concurrency :
When developing with multiple processes, you may encounter the "thundering herd problem", where multiple processes wait for the same event. When an event occurs, all processes will be awakened by the kernel, but after waking up, only one process obtains the event and processes it. The other processes continue to enter the waiting state after discovering that the time acquisition failed. The more processes that listen to the same event, the more processes there are. , the more serious the contention for the CPU is, resulting in serious context costs.
Therefore, in response to this situation, the uwsgi service designed and implemented a shared lock mechanism to ensure that only one process is monitoring events at the same time, thus solving the thundering herd problem.
But even so, the number of processes cannot be expanded without limit. It is generally recommended to equal 2 times the number of CPU cores.
So since the number of processes is limited, how to improve throughput? Under normal circumstances, IO is blocked. When you are reading a database or a file, the current process or thread will wait until the IO operation returns the result before continuing to execute subsequent code. If we increase throughput through multi-threading and encounter IO blocking, the thread will get stuck, and other concurrent requests will not be processed by the thread. Asynchronous IO is implemented through coroutines, that is, for each thread, when it is IO Instead of waiting for the IO result, we first process the new request, wait until the IO is completed, and then jump back to the code that needs to wait for the IO. In this way, we make full use of every thread in the program and always have something to do. This method improves the overall throughput and reduces the overall time-consuming, without affecting the individual time-consuming.
2.2.2 System guarantee
Subscribe to alerts:
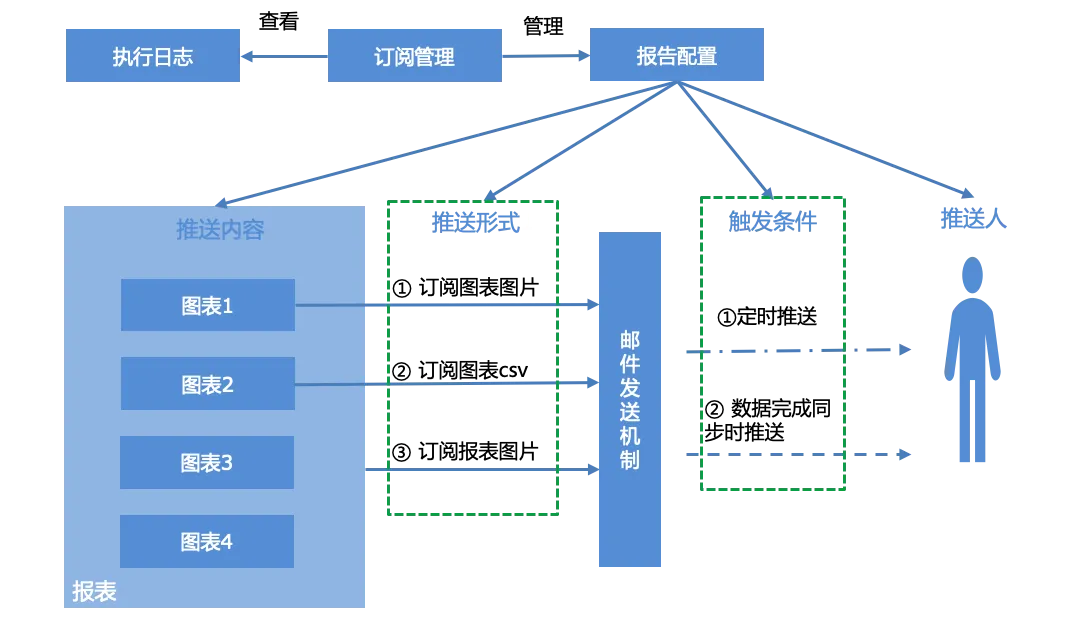
Users can configure reports for reports, manage generated subscription reports according to the subscription management interface, and view the system's execution log, that is, the push status of reports.
The report configuration mainly includes four parts, push content, push form, trigger conditions and pusher:
Push content : single chart, entire report
Push form : three forms of push
Chart screenshot
Chart csv data email attachment
Report screenshot
Triggering conditions :
Scheduled push, scheduled push based on cron expression.
Pushed when data synchronization is completed. When data sets associated with all charts of the report complete data synchronization, push conditions are triggered and email notifications are completed.
Pusher : Email account, separate with "," if there are multiple.
Permissions:

Data permission hierarchical management and control: Based on the data set & dashboard dual-layer authentication core, it supports row and column permissions to apply for authorization according to rule granularity, and flexibly controls user permissions.
Efficient collaboration: Open up the MPS (unified authority management system) unified authority service, realize authority approval, expiry recovery, resignation freezing and other capabilities, open up smooth office, accelerate the high-speed circulation of authority approval.
03 Summary and planning
3.1 Summary
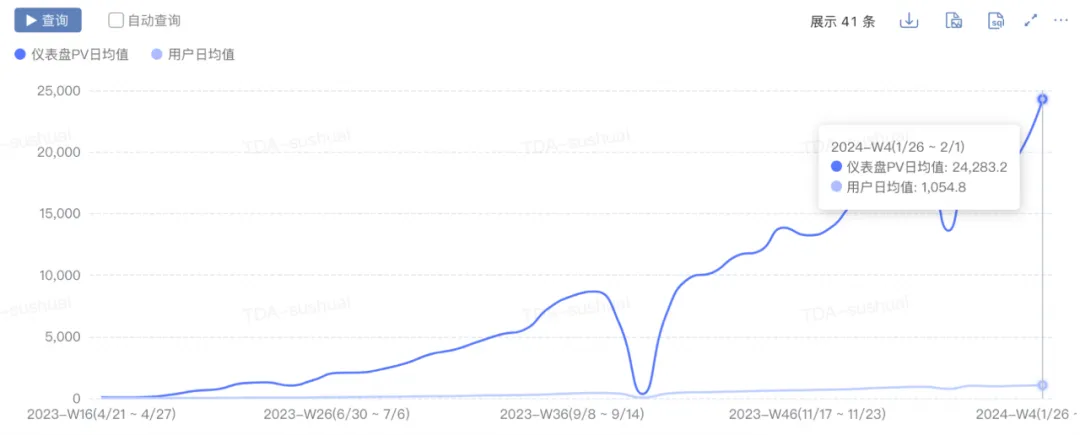
After continuous iteration, TDA has basically developed one-stop self-service analysis capabilities and achieved the following indicators:
- Scale growth: pv increased from 0 to 2w+, uv increased from 0 to 1000+, and daily new charts increased from 0 to 300+.
-
Performance improvement: The time taken to reach the 90th percentile of the first screen of the dashboard dropped from 10s+ to 5s.
-
Business efficiency improvement: Promote 80%+ self-service rate of core business, increase fluctuation analysis efficiency by 20 times, and end-to-end attribution analysis of single indicator fluctuations from 2 hours to 5 minutes.
3.2 Planning
With the penetration of AI native technology in various fields, TDA will also combine AI technology in the future to enhance the intelligent analysis experience of the platform. The main points are as follows:
-
Self-service data access: Data access will be liberalized, data source types will be expanded, etc.
-
AI+BI: BI capabilities such as attribution analysis, embedded analysis, and analysis reports are combined with large-model AI to improve intelligent analysis products.
-
Management Cockpit (Explore): OKR Goals Dashboard.
——————END——————
Recommended reading
A brief analysis of how to accelerate real-time commercial services
Login system evolution, convenient login design and implementation
This article will give you a complete understanding of the Go language IO basic library
System Reconciliation of Baidu Trading Center
Revealing the secret of Baidu data warehouse fusion computing engine
The first major version update of JetBrains 2024 (2024.1) is open source. Even Microsoft plans to pay for it. Why is it still being criticized for open source? [Recovered] Tencent Cloud backend crashed: A large number of service errors and no data after logging in to the console. Germany also needs to be "independently controllable". The state government migrated 30,000 PCs from Windows to Linux deepin-IDE and finally achieved bootstrapping! Visual Studio Code 1.88 is released. Good guy, Tencent has really turned Switch into a "thinking learning machine". RustDesk remote desktop starts and reconstructs the Web client. WeChat's open source terminal database based on SQLite, WCDB, has received a major upgrade.