1. Background
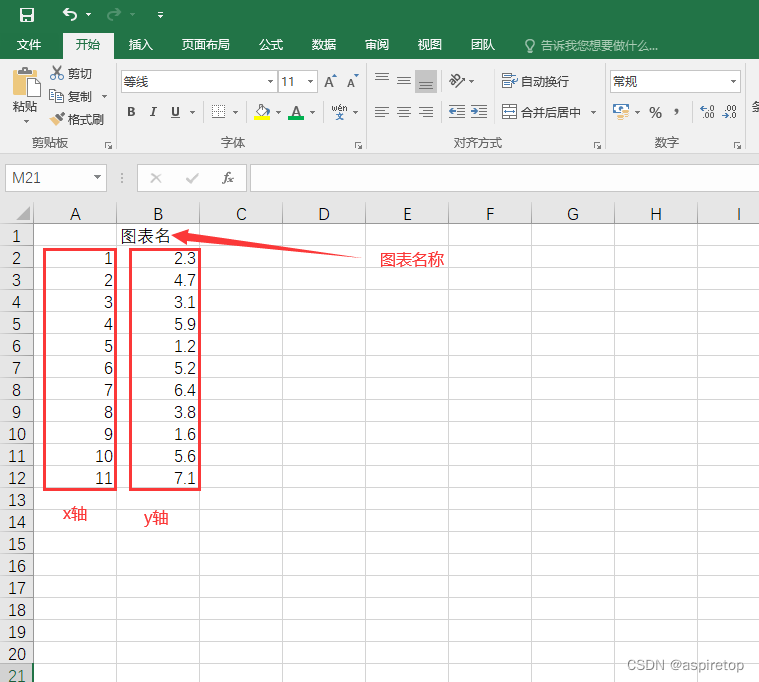
If you have processed a batch of data through code and want to see the fluctuation of the data, do you need to write a python code to read the file and draw the curve? It seems simple, but there is an easier way, which is to directly generate csv. File, csv file is in excel format, and then select the data in excel to generate a line chart, and the chart can also be copied to word and PPT. They are all vector graphics, which is very convenient.
2. Operation
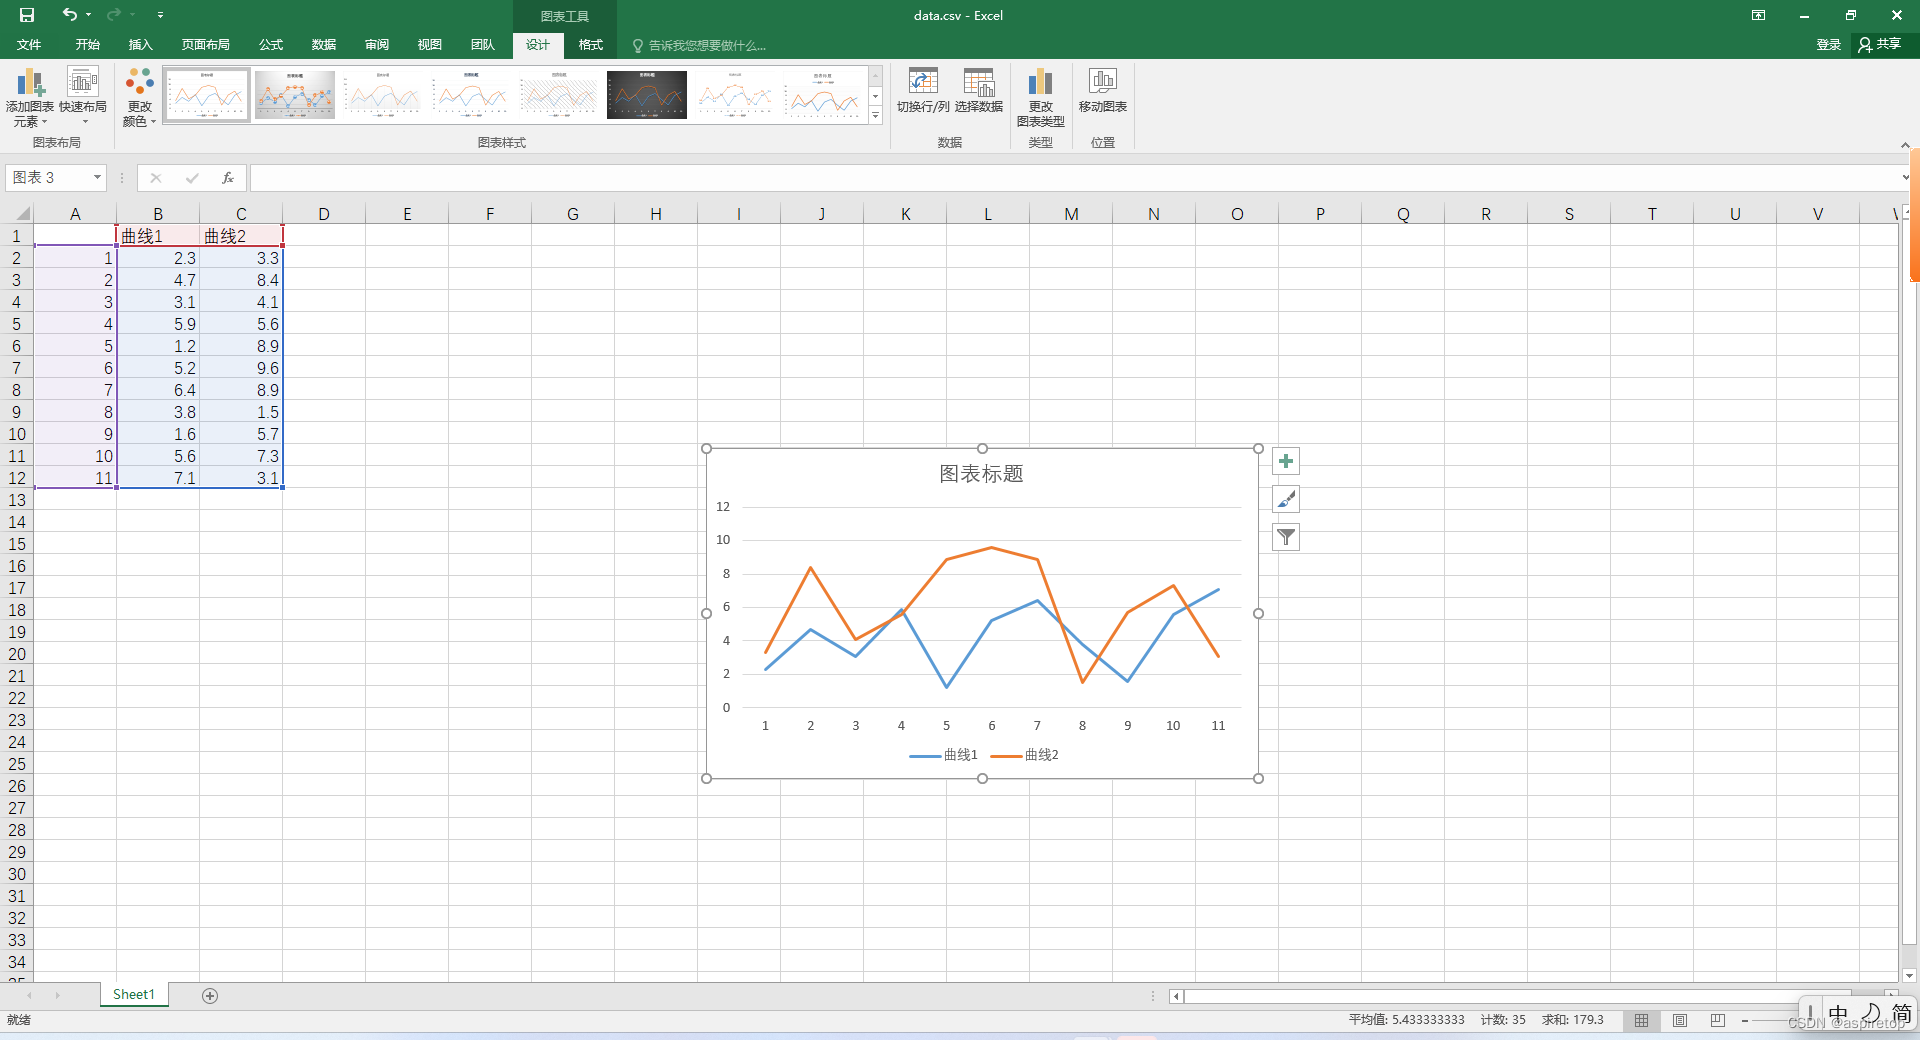
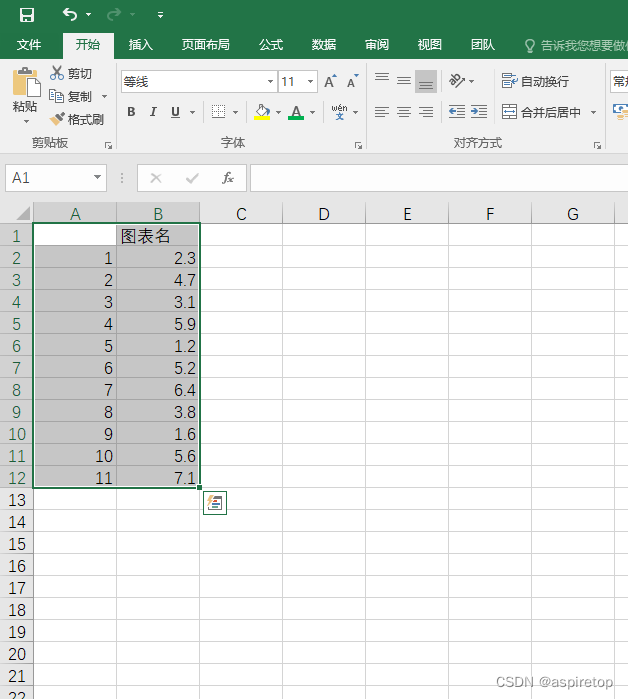
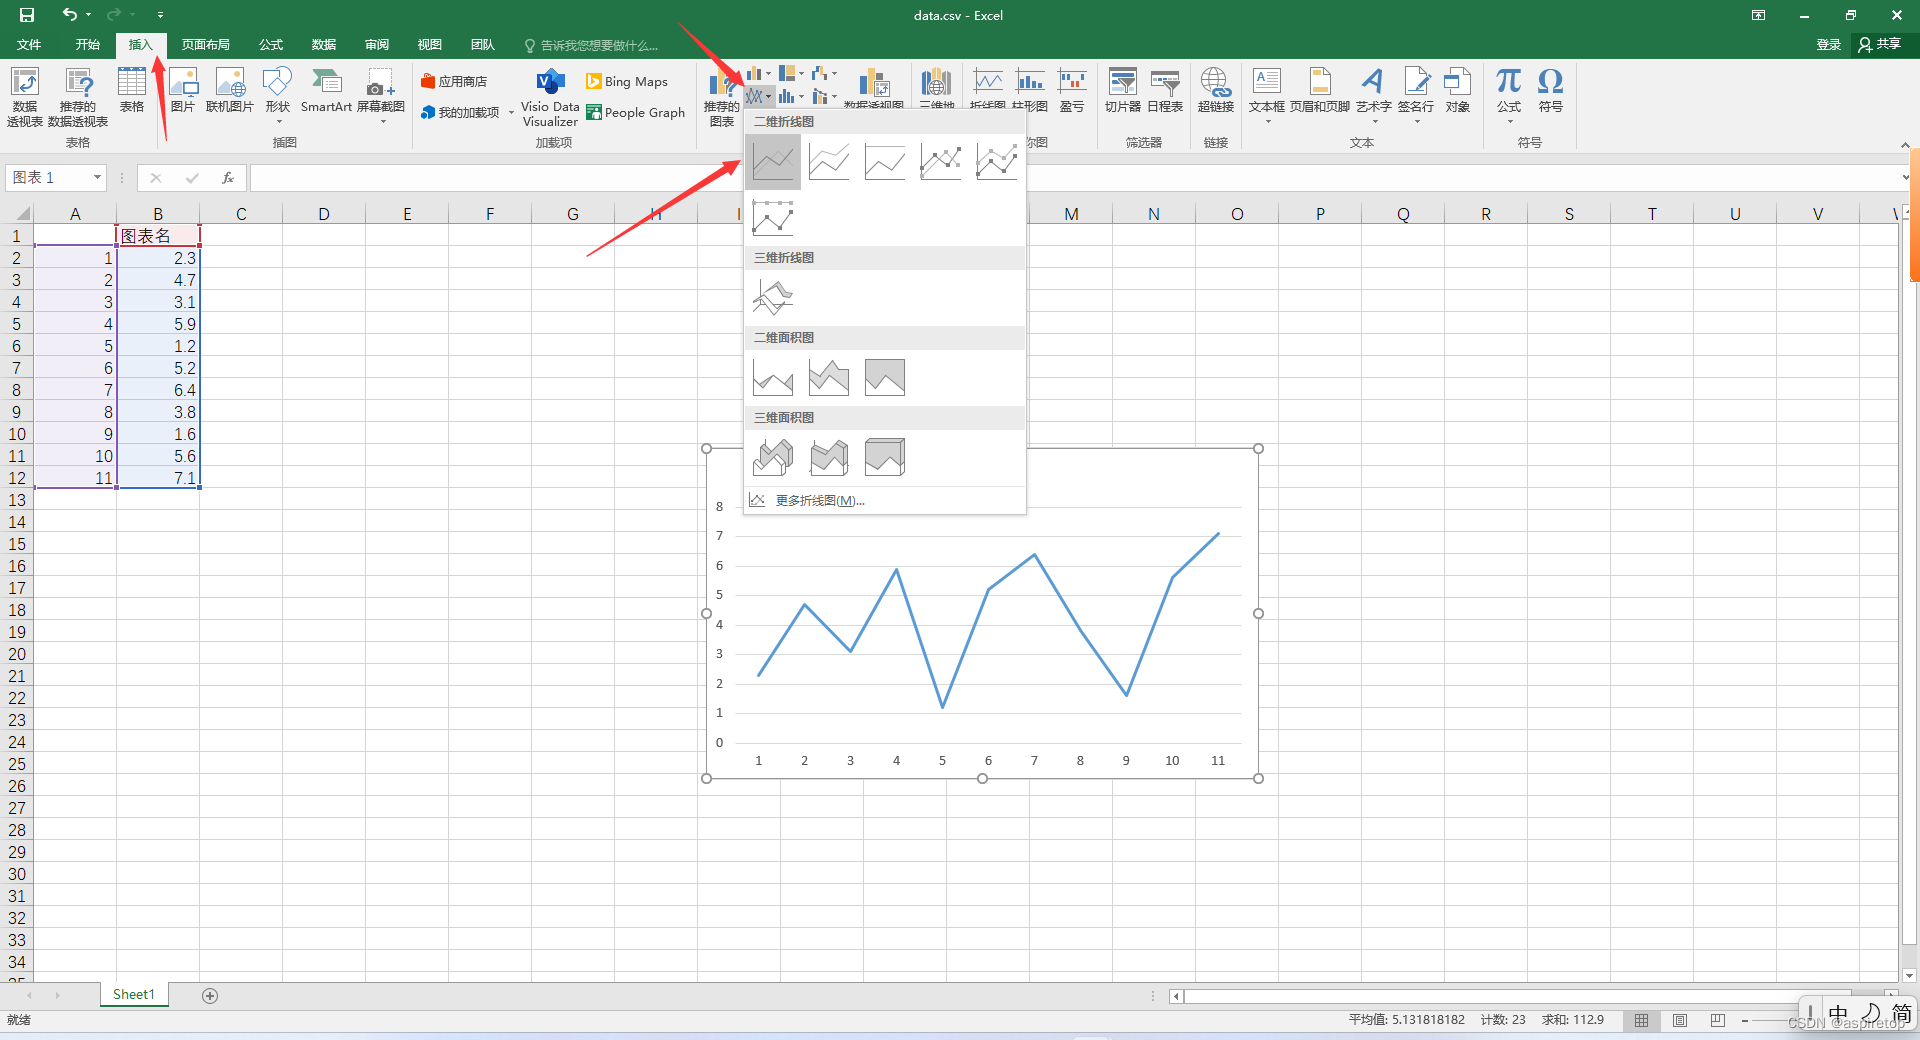
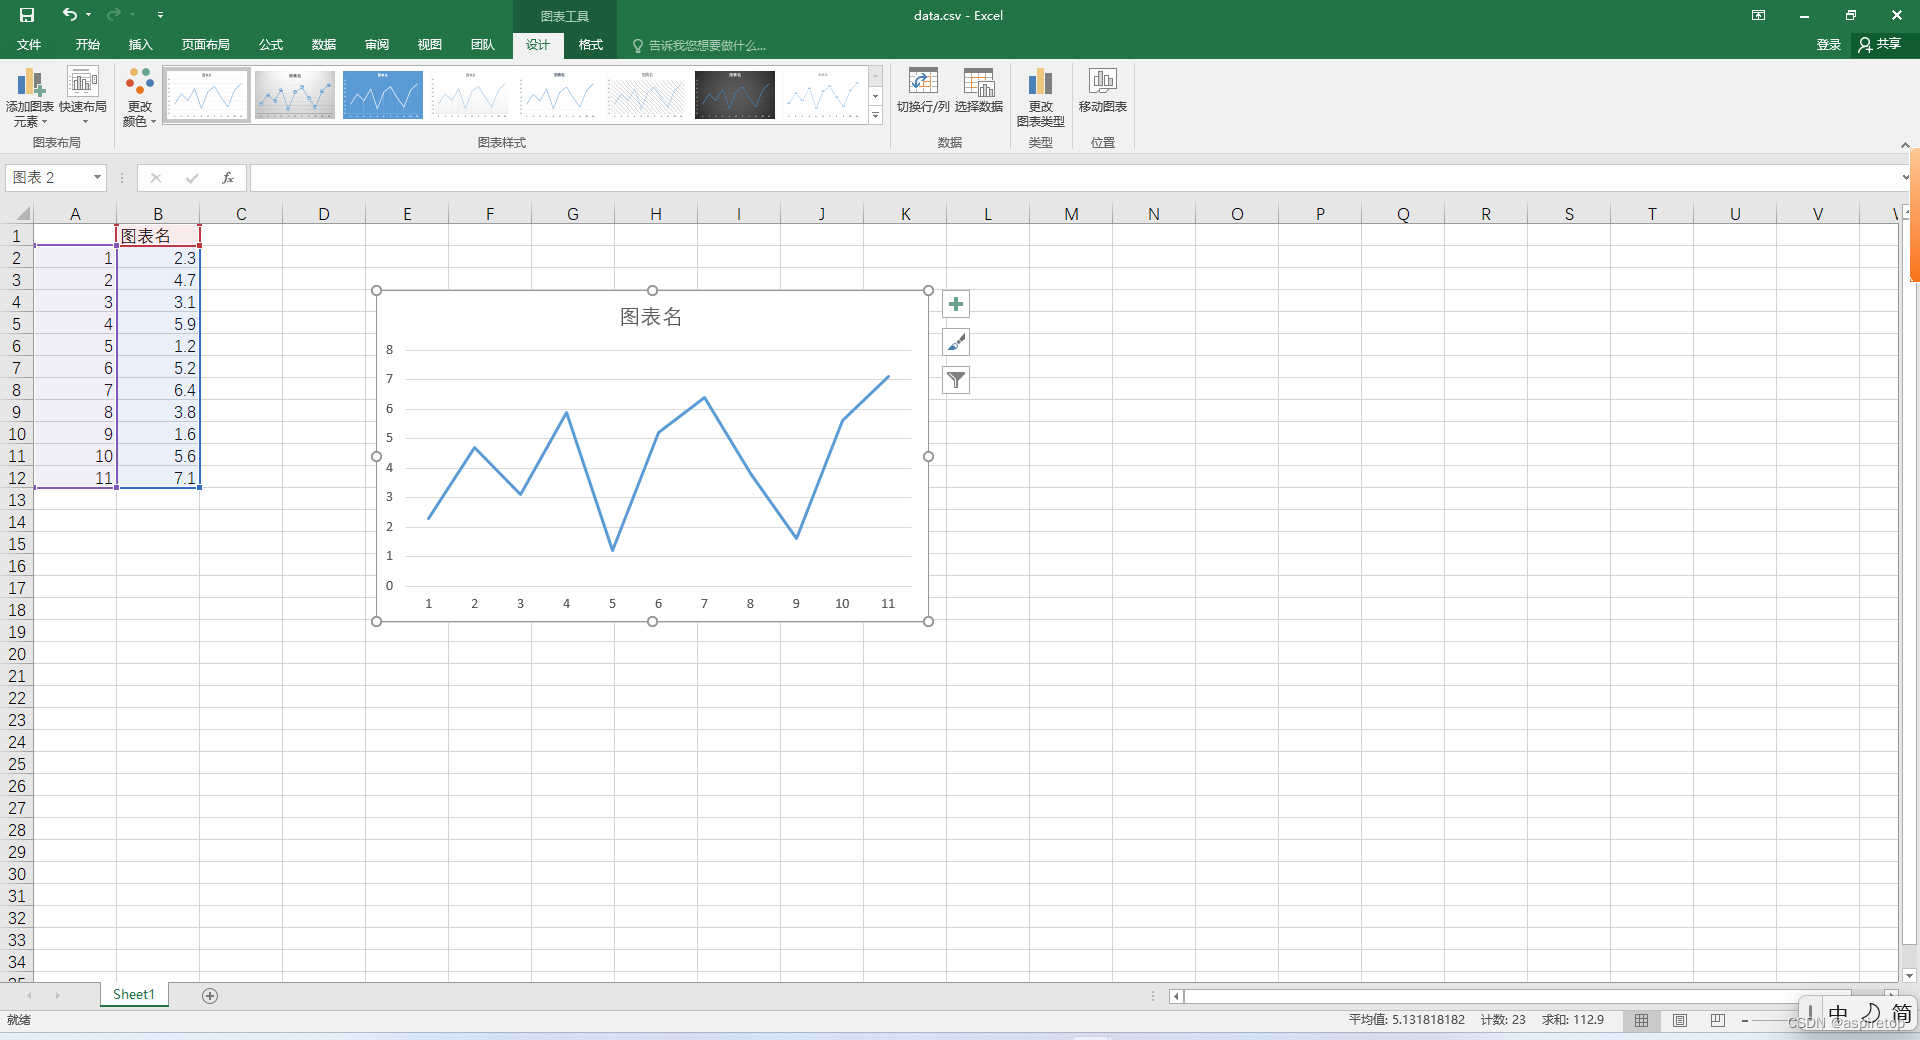
As shown in the figure above, select the data as follows, then click Insert, select the line chart, and the corresponding chart will appear in Excel. It is very simple. The plus sign in the upper right corner of the chart can add chart elements, and the brush can modify the curve color.
You can also draw multiple curves