topic:
In fresh food supermarkets, the shelf life of general vegetable products is relatively short, and the quality deteriorates with the increase of sales time. If most varieties are not
sold on the same day, they cannot be resold the next day. Therefore, supermarkets usually
restock on a daily basis based on historical sales and demand for each commodity.
Since there are many varieties of vegetables sold in supermarkets with different origins, and the purchase and transaction time of vegetables is usually between 3:00 and
4:00 in the morning, merchants must do this without knowing exactly the specific items and purchase prices. Make replenishment decisions for each vegetable category on the day
. Vegetables are generally priced using the "cost-plus pricing" method, and supermarkets usually offer
discounted sales of commodities that are damaged in transportation and have deteriorated in appearance. Reliable market demand analysis is especially important for replenishment and pricing decisions. From the demand side,
there is often a certain correlation between the sales volume of vegetable commodities and time; from the supply side, the supply variety of vegetables is
relatively abundant from April to October, and the limitations of supermarket sales space make reasonable sales Combination becomes extremely important.
Attachment 1 gives the product information of six vegetable categories distributed by a certain supermarket; Attachments 2 and 3 respectively give the
sales details and sales of each commodity in the supermarket from July 1, 2020 to June 30, 2023. Data on wholesale prices;
Annex 4 presents recent shrinkage data for each commodity. Please establish a mathematical model based on the attachment and the actual situation to solve the following problems
:
Question 1 There may be certain correlations between different categories of vegetable commodities or different single products. Please analyze the
distribution patterns and interrelationships of the sales volume of various vegetable categories and single products. .
Question 2 Considering that supermarkets make replenishment plans on a category basis, please analyze
the relationship between the total sales volume of each vegetable category and cost-plus pricing, and give the forecast for each vegetable category in the next week (July 1-7, 2023) Total daily replenishment volume and pricing strategy,
Maximize the profits of supermarkets and supermarkets.
Question 3: Due to the limited sales space of vegetable products, the supermarket hopes to further develop a replenishment plan for single products. It requires that the
total number of single products available for sale be controlled to 27-33, and the order quantity of each single product meets the minimum display quantity requirement of 2.5 kg. . Based on
the varieties available for sale from June 24 to 30, 2023, the single product replenishment volume and pricing strategy on July 1 are given, so as to maximize the profits of supermarkets and stores while trying to meet the market demand for various types of vegetable commodities
.
Question 4 In order to better make replenishment and pricing decisions for vegetable commodities, what other relevant data do supermarkets need to collect?
How can these data help solve the above problems? Please give your opinions and reasons.
Attachment 1 Product information of 6 vegetable categories
Attachment 2 Detailed sales data
Attachment 3 Wholesale price of vegetable products
Attachment 4 Recent loss rate of vegetable products
Note (1) In Attachment 1, the numbers contained in some item names have different meanings source of supply.
(2) The loss rate in Appendix 4 reflects the recent loss of goods and is calculated from the data of the recent inventory cycle.
The first question is to analyze the correlation between each item and category.
Idea:
1. First analyze the sales volume of each category and each single product. Here you need to make a join of the data in Annex 1 and Annex 2 for statistical analysis.
The solution is to use the pandas merge method to merge Attachment 1 and Attachment 2 with key='single product code', so that you can get a copy of the product code, code name, category code, and category name;
Then use the group by sum in pandas to count sales
Read xlsx file and merge attachment 1 and attachment 2
import pandas as pd
data2 = pd.read_excel(io='./附件2.xlsx')
data1 = pd.read_excel(io='./附件1.xlsx')

data_class = pd.merge(data2,data1,how = 'left',on = ['单品编码'])
Perform statistical analysis on individual products and categories respectively
data_class_res =  data_class[(data_class['销售类型']=='销售')].groupby(['分类编码','分类名称'])['销量(千克)'].sum().reset_index()
data_one = data_class[(data_class['销售类型']=='销售')].groupby(['单品编码','单品名称'])['销量(千克)'].sum().reset_index()

print('end')
display(data_class_res)
Draw a picture
#导入matplotlib的pyplot模块
import matplotlib.pyplot as plt


import matplotlib.pyplot as plt

plt.rcParams["font.sans-serif"]=['SimHei']
plt.rcParams["axes.unicode_minus"]=False
plt.bar(x = data_class_res['分类名称'],height=data_class_res['销量(千克)'])

plt.title("分类销量分析")
plt.xlabel("分类名称")
plt.ylabel("销量")

plt.show()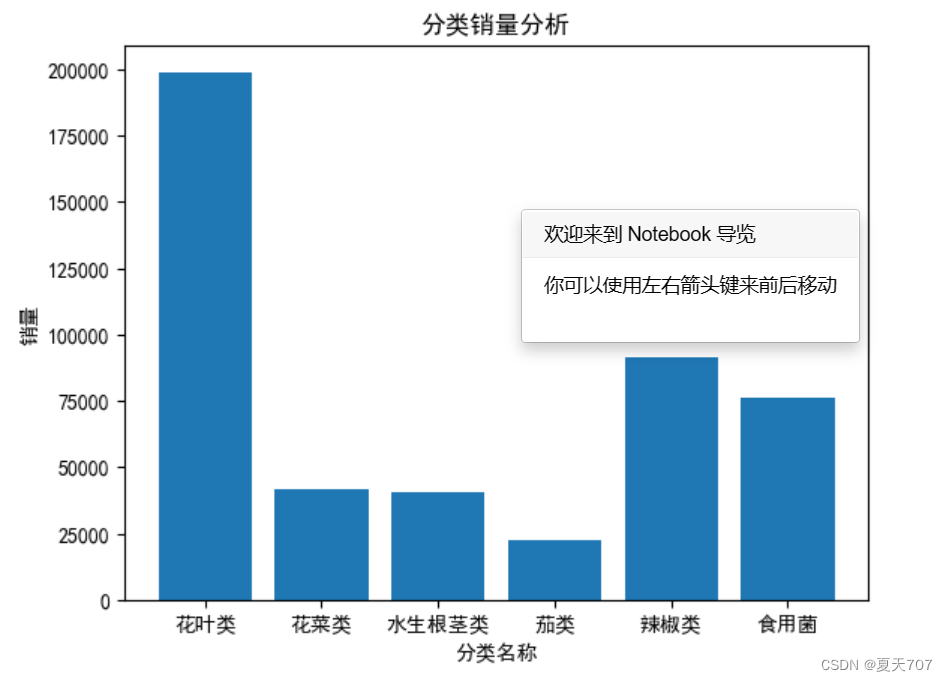
Draw pictures by product, there is a lot of data, the picture drawn is not very friendly, you can draw pictures of the top 20 single products
#导入matplotlib的pyplot模块
import matplotlib.pyplot as plt


import matplotlib.pyplot as plt

plt.rcParams["font.sans-serif"]=['SimHei']
plt.rcParams["axes.unicode_minus"]=False
plt.bar(x = data_one['单品名称'],height=data_one['销量(千克)'])

plt.title("分类销量分析")
plt.xlabel("单品名称")
plt.ylabel("销量")

plt.show()
Finally, you can analyze the correlation according to your own ideas:
It’s too late, I’ll continue writing tomorrow
Correlation analysis--realized with python&pandas- Zhihu (zhihu.com)