Symptoms
Recently, the portal website has experienced a small amount of slow access experience, mainly due to the slow response time of the server. The page cluster where the slow page appears is: http://www.xxx.ac.cn/ .
Analysis process
The reason for the exception will be analyzed below: URL information of the page? Why is the page slow?
Analysis of performance problems, locate the main URL statement clusters of slow access as
During the abnormal period, a total of 19,467 slow pages (pages that have not been accessed for more than 5 seconds) occurred in this page cluster
The reason for the slow page is because the server response time is relatively slow.
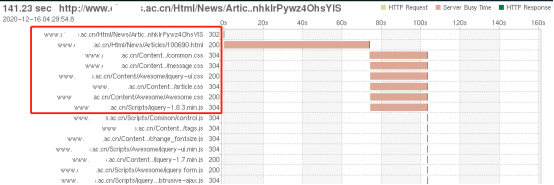
The waterfall chart of one of the slow pages is opened as shown below, and the response time of the page is relatively long when loading the selected process.
As can be seen from the figure below, the opening time of the homepage of a large number of websites exceeds 110 seconds. The main reason for the long page time is that the server response time is too long.

Use the waterfall chart analysis function to visually view the specific distribution details of the server response time.

While clicking on another page, there were a lot of problems, such as slow transmission.
Analysis conclusion
Through the analysis system, the reason for the slow access to the portal has been identified and located, which is caused by the long response time of the server. Therefore, the network department directly handed over the problem handler to the application development department, and the fault was quickly resolved.