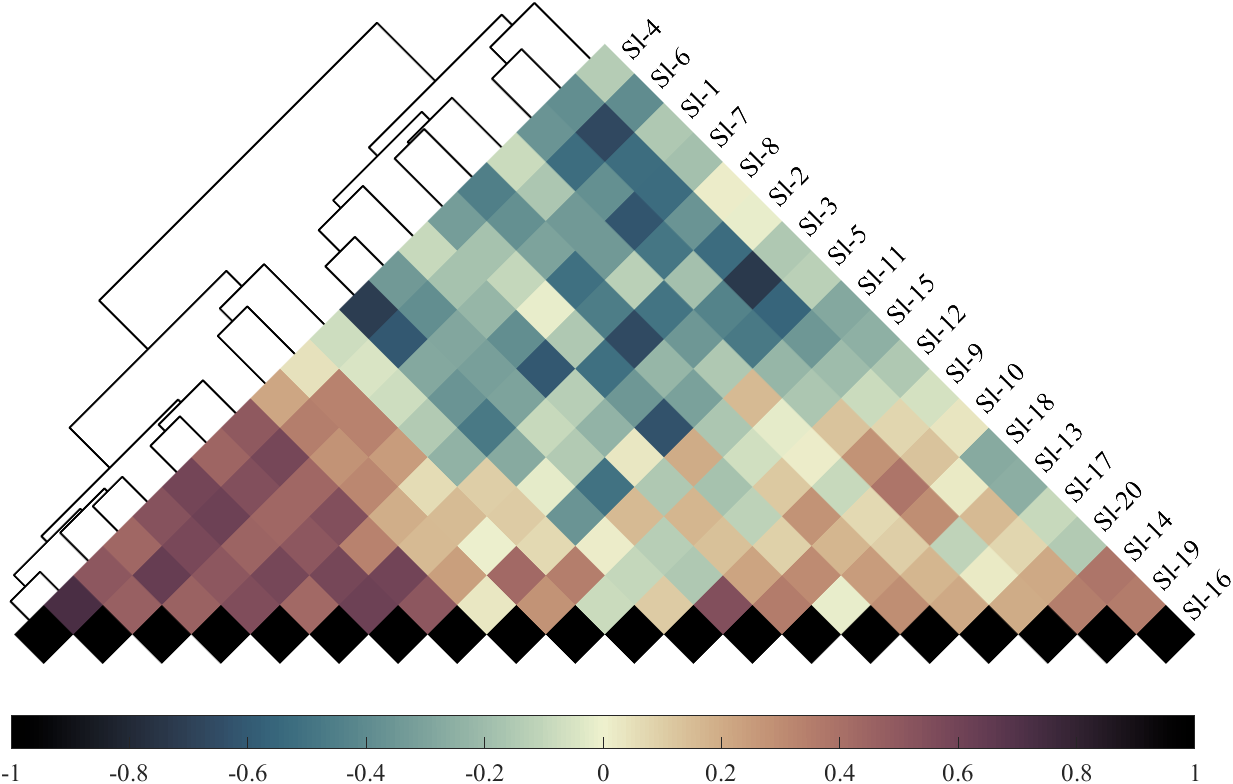
We often see such triangular correlation heatmaps in papers, and such heatmaps are more space-saving to draw:

This issue will teach you how to draw a heat map of a triangle. The drawing effect is as follows:

Here is the tutorial part:
0 data preparation
Here, a set of data is randomly generated, the correlation coefficient is calculated, and each variable name is given:
% 随机生成数据
X=randn(20,20)+[(linspace(-1,2.5,20)').*ones(1,8),(linspace(.5,-.7,20)').*ones(1,5),(linspace(.9,-.2,20)').*ones(1,7)];
Data=corr(X1);
% 变量名列表
NameList=compose('Sl-%d',1:20);
1 Coordinate area creation and heat map drawing
% 图窗及坐标区域
treeFig=figure('Position',[100,300,1000,600]);
ax=axes(treeFig);
ax.NextPlot='add';
ax.DataAspectRatio=[1,1,1];
ax.XColor='none';
ax.YColor='none';

% 热图绘制
sqX=[-1,0,1,0];
sqY=[0,1,0,-1];
for i=1:size(Data,1)
    for j=i:size(Data,1)
        fill(ax,sqX+(i-1)+(j-1),sqY-(i-1)+(j-1),Data(i,j),'EdgeColor','none')
    end
end
axis(ax,'tight')
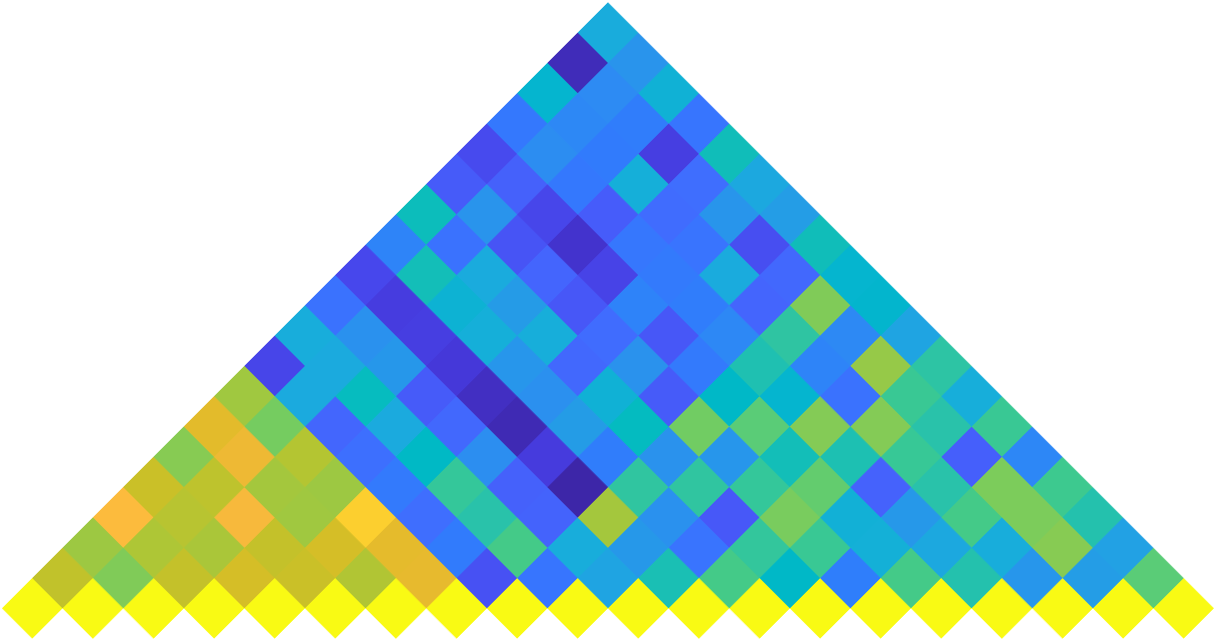
2 Adjust color matching and create colorbar
For example, wintercolor matching:
% 设置颜色并绘制colorbar
clim(ax,[-1,1])
colormap(ax,'winter')
cbHdl=colorbar(ax);
cbHdl.Location='southoutside';
cbHdl.FontName='Times New Roman';
cbHdl.FontSize=12;
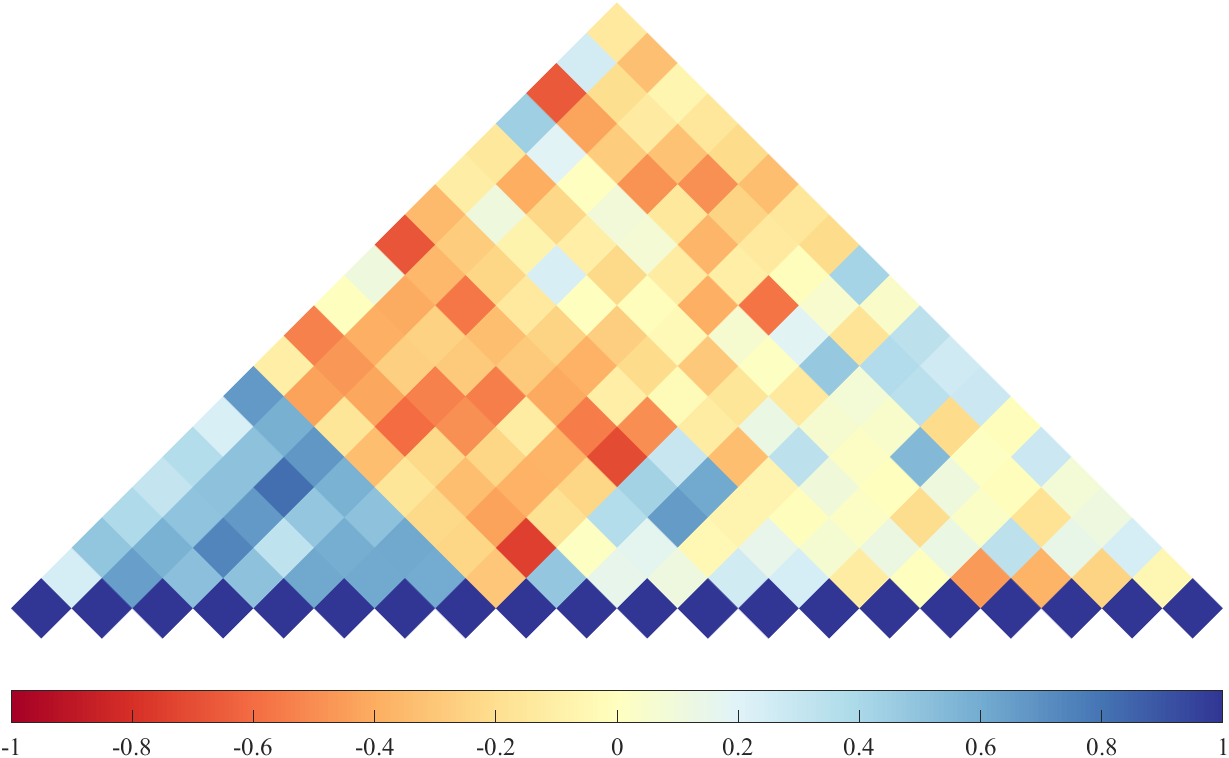
For richer color matching, you can use the slanCM tool:
https://slandarer.blog.csdn.net/article/details/127719784
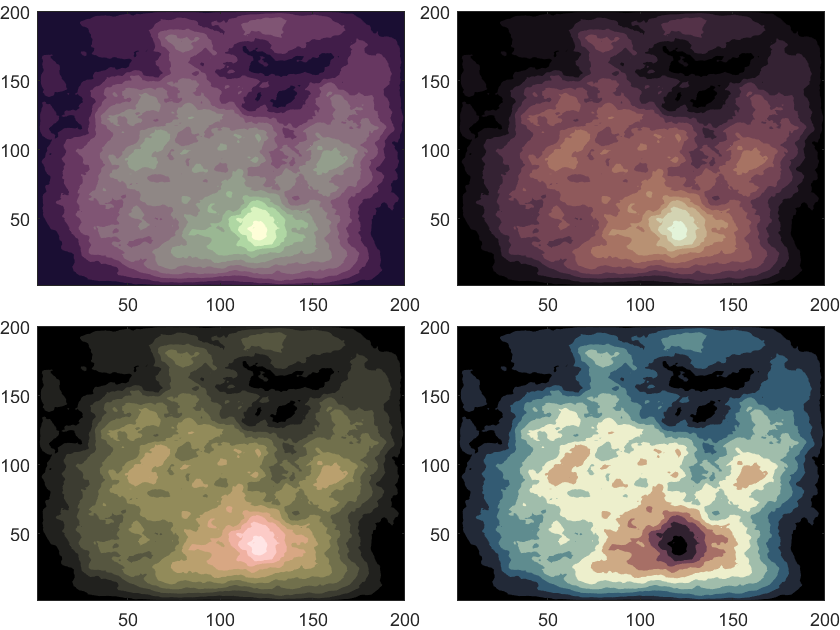
For example:
colormap(ax,slanCM(98))
3 Add text
If you want the text below, you can change it after if near the text below true. If you want the text on the upper right, the same is true:
% 下方注释
if true
for i=1:size(Data,1)
    text(ax,-1/2+2*(i-1),-1/2,NameList{i}+" ",'FontSize',13,...
        'FontName','Times New Roman','HorizontalAlignment','right','Rotation',45)
end
end

% 右上方注释
if true
for i=1:size(Data,1)
    text(ax,-1/2+(i-1)+size(Data,1),-1/2+size(Data,1)-(i-1)," "+NameList{i},'FontSize',13,...
        'FontName','Times New Roman','HorizontalAlignment','left','Rotation',45)
end
end

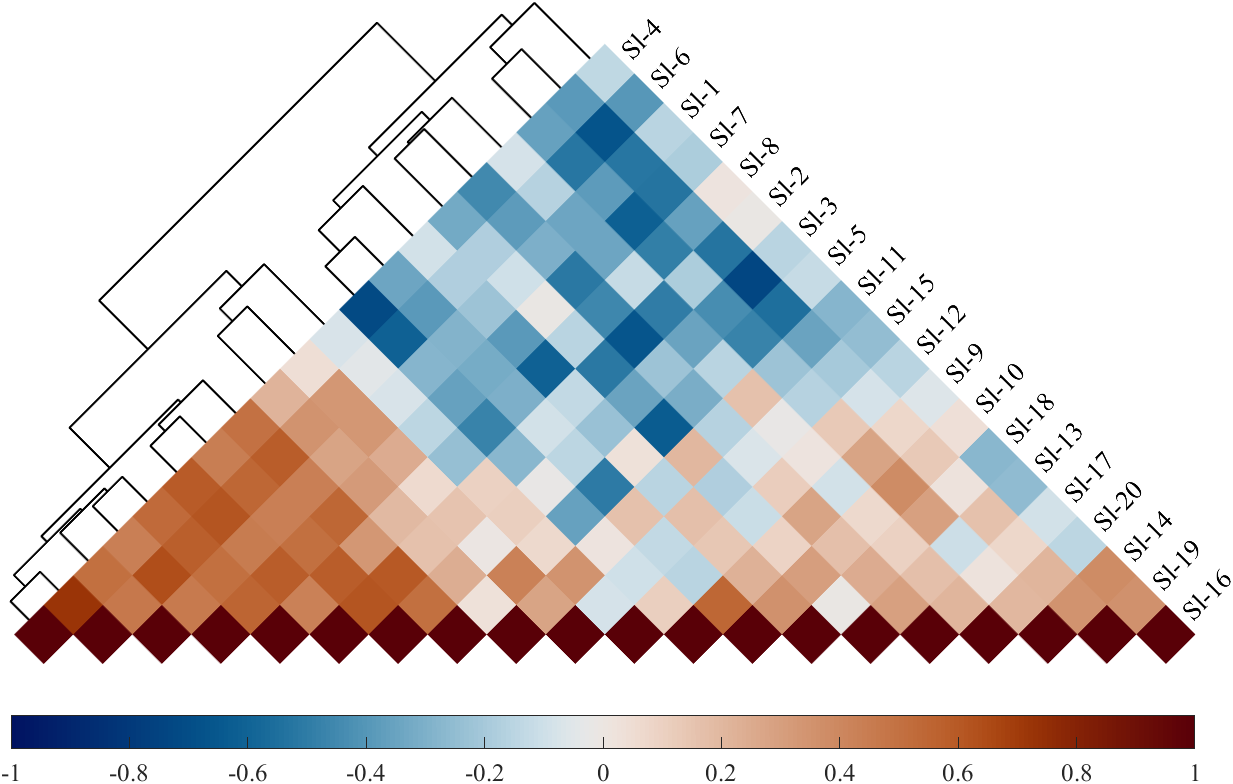
4 Dendrogram
This section requires downloading the Statistics and Machine Learning Toolbox toolbox:
Since the dendrogram needs to rearrange the matrix, write a separate code:
% Rotation 45-degree corr heatmap
% 随机生成数据
X=randn(20,20)+[(linspace(-1,2.5,20)').*ones(1,8),(linspace(.5,-.7,20)').*ones(1,5),(linspace(.9,-.2,20)').*ones(1,7)];
Data=corr(X);
% 变量名列表
NameList=compose('Sl-%d',1:20);

% 图窗及坐标区域
treeFig=figure('Position',[100,300,1000,600]);
ax=axes(treeFig);
ax.NextPlot='add';
ax.DataAspectRatio=[1,1,1];
ax.XColor='none';
ax.YColor='none';

% 获取树状图数据
fig1=figure();
tree1=linkage(Data,'average');
[~,~,order1]=dendrogram(tree1,0,'Orientation','top');
Data=Data(order1,order1);
NameList=NameList(order1);
LineSet1=fig1.Children.Children;
maxY1=0;
for i=1:length(LineSet1)
    maxY1=max(max(LineSet1(i).YData),maxY1);
end
for i=1:length(LineSet1)
    LineSet1(i).YData=LineSet1(i).YData./maxY1.*size(Data,1)./3;
end
for i=1:length(LineSet1)
    tX=(LineSet1(i).XData-1).*sqrt(2);
    tY=LineSet1(i).YData;
    nX=tX.*cos(pi/4)-tY.*sin(pi/4);
    nY=tX.*sin(pi/4)+tY.*cos(pi/4);
    plot(ax,nX,nY,'Color','k','LineWidth',1);
end
delete(fig1)

% 热图绘制
sqX=[-1,0,1,0];
sqY=[0,1,0,-1];
for i=1:size(Data,1)
    for j=i:size(Data,1)
        fill(ax,sqX+(i-1)+(j-1),sqY-(i-1)+(j-1),Data(i,j),'EdgeColor','none')
    end
end
axis(ax,'tight')

% 设置颜色并绘制colorbar
clim(ax,[-1,1])
colormap(ax,'winter')

cbHdl=colorbar(ax);
cbHdl.Location='southoutside';
cbHdl.FontName='Times New Roman';
cbHdl.FontSize=12;
colormap(ax,slanCM(100))

for i=1:size(Data,1)
    text(ax,-1/2+(i-1)+size(Data,1),-1/2+size(Data,1)-(i-1)," "+NameList{i},'FontSize',13,...
        'FontName','Times New Roman','HorizontalAlignment','left','Rotation',45)
end
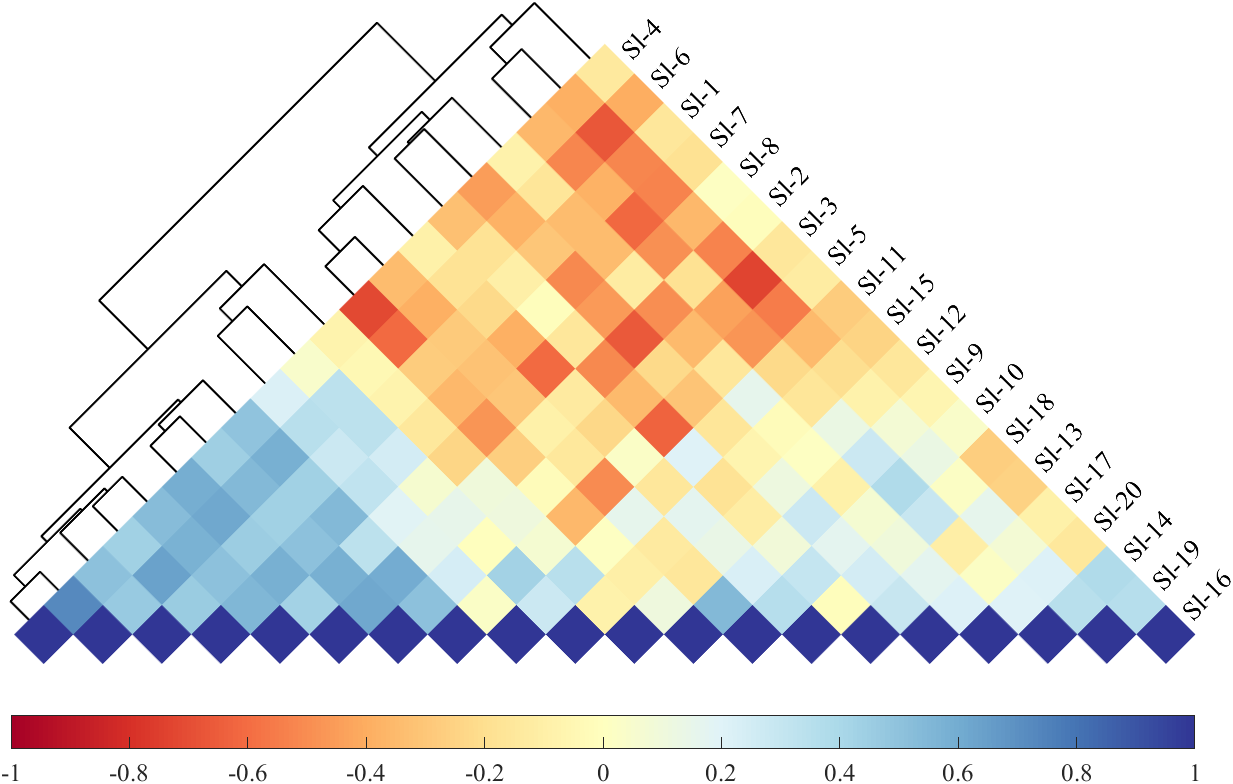
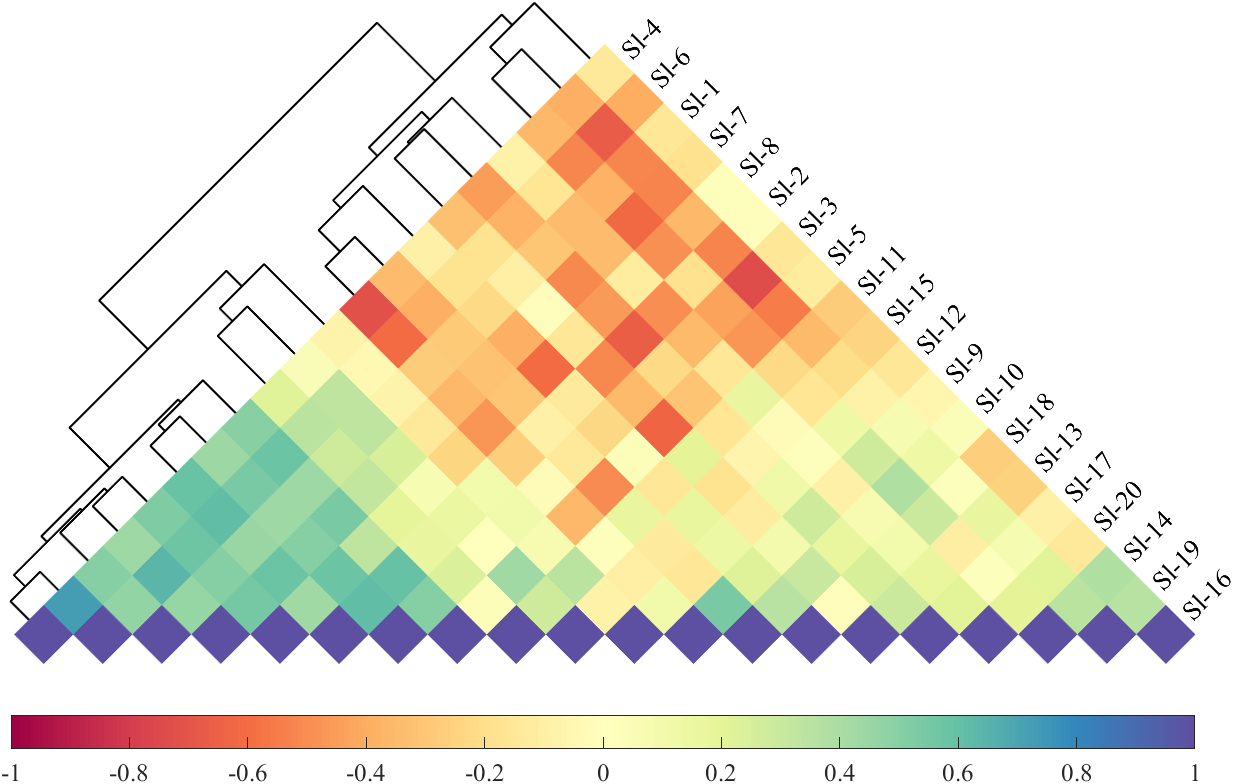
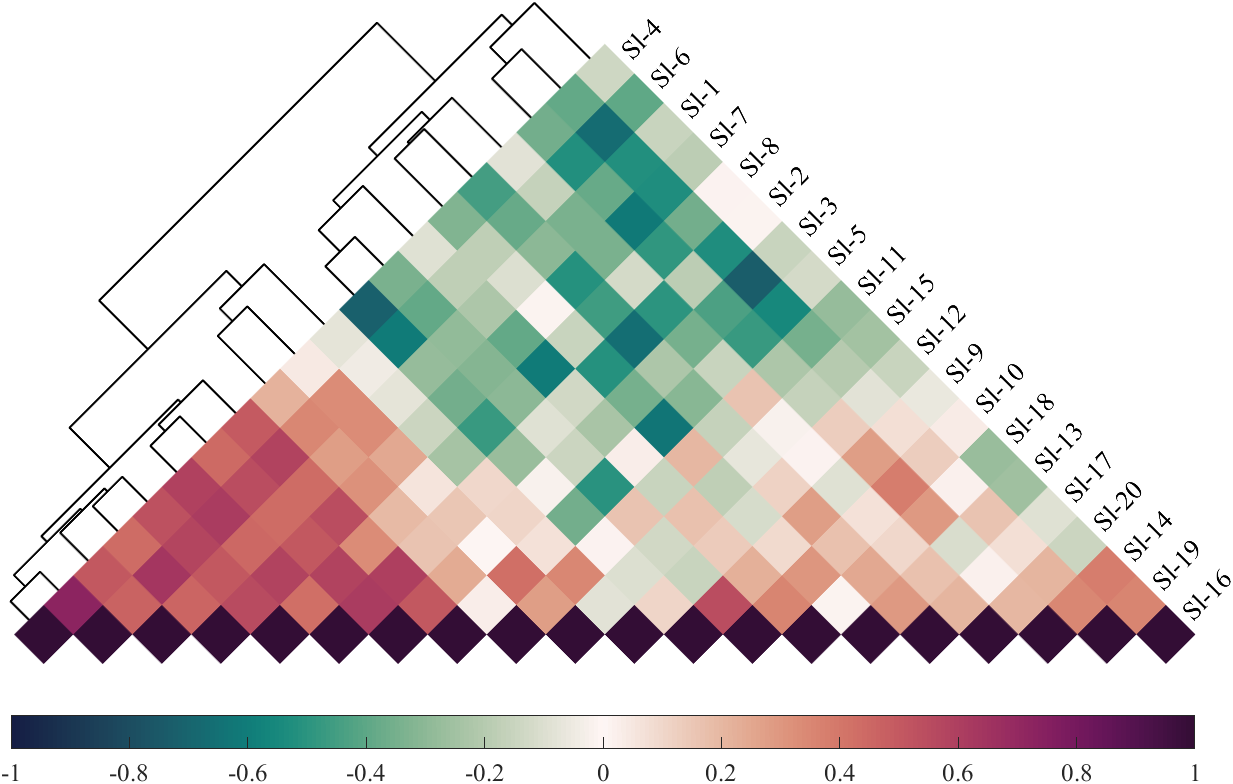
Show other color matching after using slanCM:
No. 97 color matching
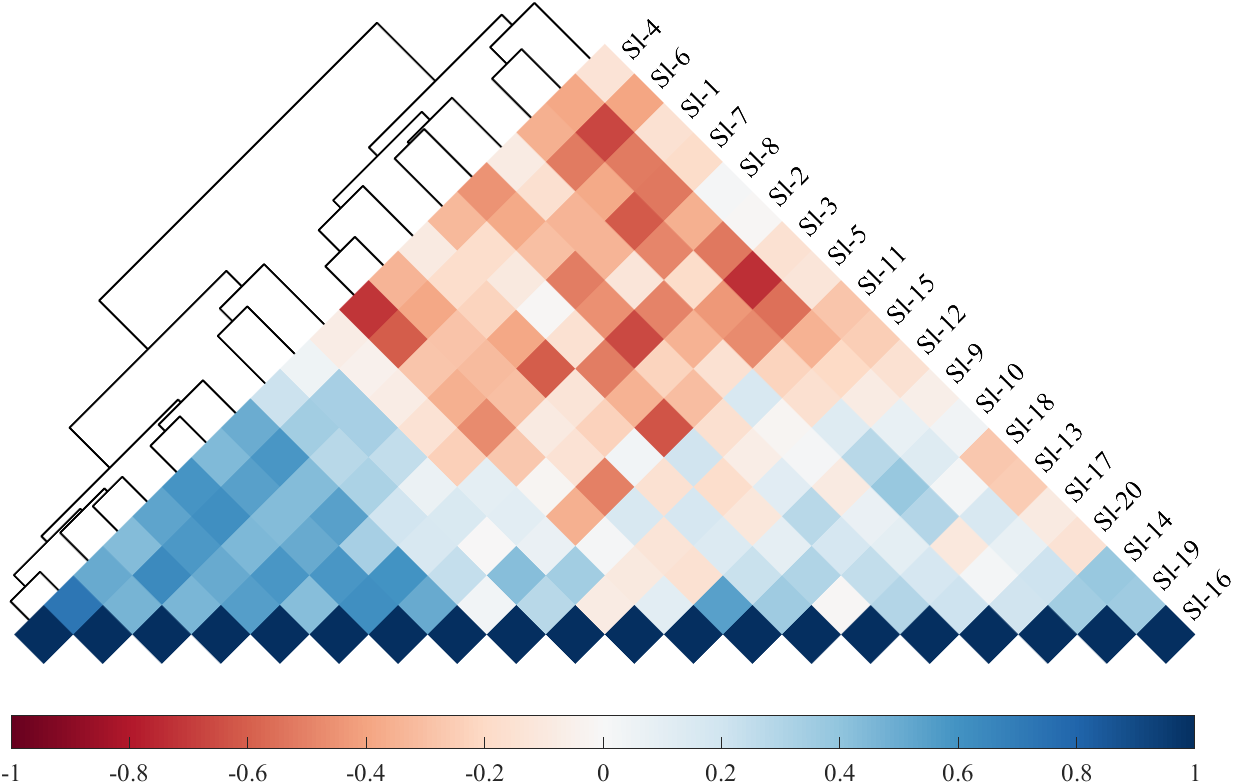
No. 100 color matching
No. 106 color matching
No. 110 color matching

Color No. 111
No. 136 color matching
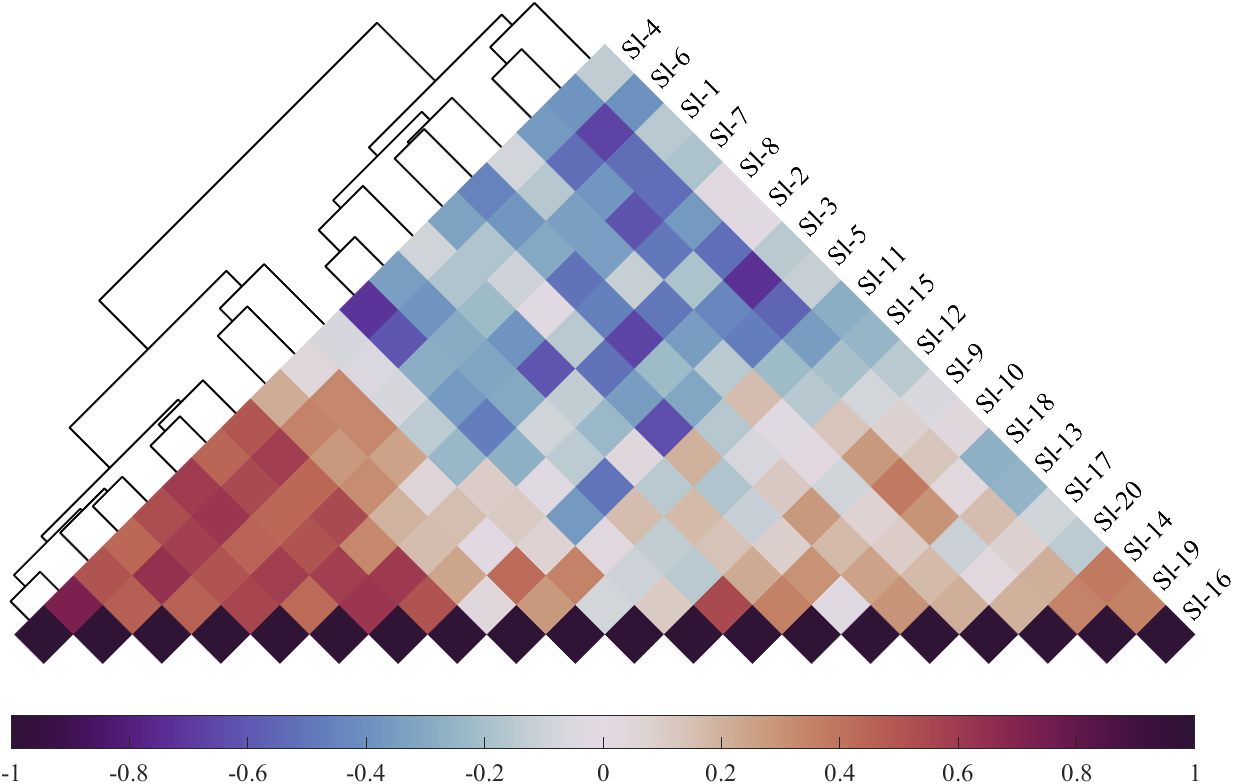
Color No. 141
