Contour map
Suppose we want to draw a function:

xthe value range is -5 to 5, ythe value range is -3 to 3, and the increment is 0.1:
>> [x,y] = meshgrid(-5:0.1:5,-3:0.1:3);
The meshgridcommand is used to generate the grid.
We can also specify the increment first, and then call the meshgridcommand to generate the grid, for example:
>> x = [-5:0.1:5];
>> y = [-3:0.1:3];
>> [X,Y] = meshgrid(x,y);
It's just that we treat lowercase x,yas an intermediate variable, and the final value is X,Y.
If the function we draw is:

then we enter the following command:
>> z = X.^2 + Y.^2;
Now we call the contourcommand:
>> contour(X,Y,z)
The resulting image: 
We can also add more content to this image:
- label
- The width between contour lines
- Line width
- Linear
- Line color
- Do not need to fill in. The
above attributes can be modified usingsetcommands. It
should be noted that when we return the attributes of the current image, because it is a two-dimensional grid, there are two parameters, which we can express in the form of a matrix:
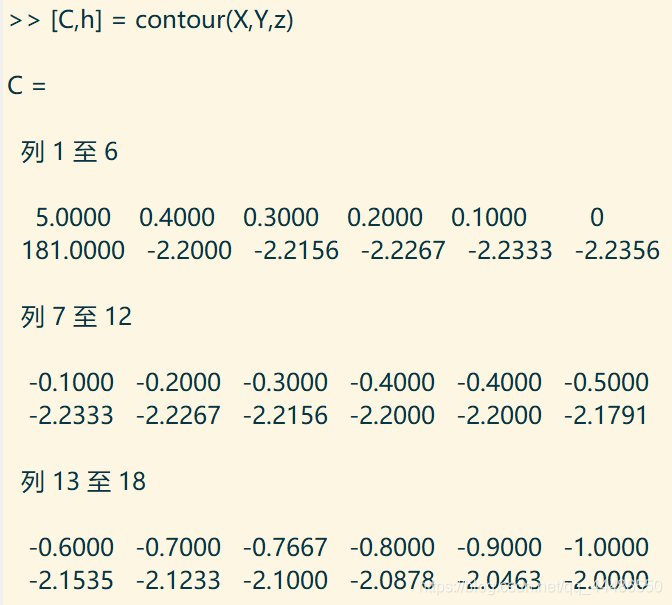
>> [C,h] = contour(X,Y,z)
There are two parameters:
-
C
The first parameter representsx,ythe matrix of coordinates, which is a two-dimensional array
-
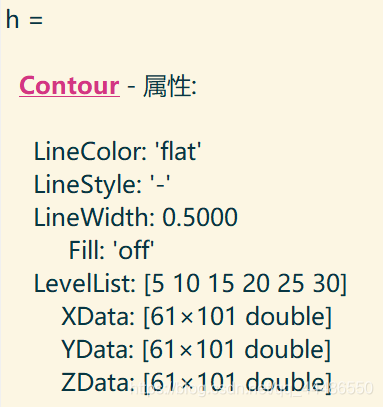
h
hRepresents some properties:
Of course, we can also use other letters to replace the names of these two parameters, as long as they are placed in an array.
We call thesetcommand:
>> set(h,'showtext','on','textstep',get(h,'levelstep')*2)
This time, we added a label to the contour plot:

Let's draw another function:

>> [x,y] = meshgrid(-5:0.1:5,-3:0.1:3);
>> z = cos(x).*sin(y);
>> [C,h] = contour(x,y,z);
>> set(h,'showtext','on','textstep',get(h,'levelstep')*2)

We can also call contour3commands to draw contours into three dimensions. If we call contour3(z,n), then he will produce a ncontour line with a level:
>> contour3(z,10)

This time we draw another function xwith ythe same value range as:

>> [x,y] = meshgrid(-2:0.1:2)
>> z  = y.*exp(-x.^2-y.^2);
>> contour(x,y,z),xlabel('x'),ylabel('y')
When two independent variables are in the same range, you can put:
[x,y] = meshgrid(x)
Let's draw three-dimensional:
just input:

>> contour3(x,y,z)
You get:

