Table of contents
3. Scale/normalize the training data
4, Create and fit a regression model
There is an open source, commercially available machine learning toolkit called [scikit-learn](https://scikit-learn.org/stable/index.html). This toolkit contains implementations of many of the algorithms you'll use in this course.
Article Objectives:
Using scikit-learn to implement linear regression using gradient descent
Forecasting using the linear regression model SGDRegressor - Programmer Sought
1. Import library
import numpy as np
#设计array对象中数据的精度
np.set_printoptions(precision=2)
#导入线性模型,LinearRegression,还有梯度下降函数SGDRegressor
from sklearn.linear_model import LinearRegression, SGDRegressor
#导入数据预处理库,使用正则化函数
from sklearn.preprocessing import StandardScaler
#导入数据集
from lab_utils_multi import  load_house_data
import matplotlib.pyplot as plt
dlblue = '#0096ff'; dlorange = '#FF9300'; dldarkred='#C00000'; dlmagenta='#FF40FF'; dlpurple='#7030A0';
plt.style.use('./deeplearning.mplstyle')
Scikit-learn has a gradient descent regression model [ sklearn.linear_model.SGDRegressor ](https://scikit-learn.org/stable/modules/generated/sklearn.linear_model.SGDRegressor.html#examples-using-sklearn-linear-model -sgdregressor). Like your previous implementation of gradient descent, this model works best with normalized inputs. [ sklearn.preprocessing.StandardScaler] (https://scikit-learn.org/stable/modules/generated/sklearn.preprocessing.StandardScaler.html#sklearn.preprocessing.StandardScaler) will perform z-score normalization. Here, it is called "Standard Score".
2. Import data set
X_train, y_train = load_house_data()
X_features = ['size(sqft)','bedrooms','floors','age']
3. Scale/normalize the training data
scaler = StandardScaler()
X_norm = scaler.fit_transform(X_train)
print(f"Peak to Peak range by column in Raw        X:{np.ptp(X_train,axis=0)}")
print(f"Peak to Peak range by column in Normalized X:{np.ptp(X_norm,axis=0)}")
print(np.ptp(x, axis=0)) # Find the extreme value (the difference between the maximum and minimum values)
Usage of print(f'')_Joey9898's Blog-CSDN Blog
4, Create and fit a regression model
sgdr = SGDRegressor(max_iter=1000)
sgdr.fit(X_norm, y_train)
print(sgdr)
print(f"number of iterations completed: {sgdr.n_iter_}, number of weight updates: {sgdr.t_}")
5, view parameters
Note that these parameters are relative to the *normalized* input data. The fitted parameters are very close to those found with this data in previous materials.
b_norm = sgdr.intercept_
w_norm = sgdr.coef_
print(f"model parameters:                   w: {w_norm}, b:{b_norm}")
print(f"model parameters from previous lab: w: [110.56 -21.27 -32.71 -37.97], b: 363.16")
6, predict
# make a prediction using sgdr.predict()
y_pred_sgd = sgdr.predict(X_norm)
# make a prediction using w,b.
y_pred = np.dot(X_norm, w_norm) + b_norm
print(f"prediction using np.dot() and sgdr.predict match: {(y_pred == y_pred_sgd).all()}")
print(f"Prediction on training set:\n{y_pred[:4]}" )
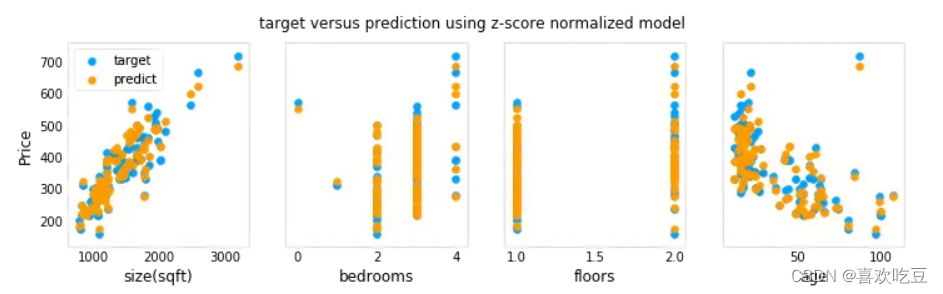
print(f"Target values \n{y_train[:4]}")7. Visualization
# plot predictions and targets vs original features
fig,ax=plt.subplots(1,4,figsize=(12,3),sharey=True)
for i in range(len(ax)):
    ax[i].scatter(X_train[:,i],y_train, label = 'target')
    ax[i].set_xlabel(X_features[i])
    ax[i].scatter(X_train[:,i],y_pred,color=dlorange, label = 'predict')
ax[0].set_ylabel("Price"); ax[0].legend();
fig.suptitle("target versus prediction using z-score normalized model")
plt.show()