Table of contents
1. Overview of ELK
1.1 Introduction to ELK
The ELK platform is a complete set of centralized log processing solutions, using ElasticSearch, Logstash, and Kiabana three open source tools together to meet more powerful user query, sorting, and statistical requirements for logs.
-
ElasticSearch: It is a distributed storage and retrieval engine developed based on Lucene (a full-text retrieval engine architecture), used to store various logs.
Elasticsearch is developed in Java and can communicate with Elasticsearch through a RESTful web interface through a browser.
Elasticsearch is a real-time, distributed, scalable search engine that allows full-text, structured searches. It is typically used to index and search large volumes of log data, and can also be used to search many different types of documents. -
Kiabana: Kibana is usually deployed together with Elasticsearch. Kibana is a powerful data visualization Dashboard for Elasticsearch. Kibana provides a graphical web interface to browse Elasticsearch log data, which can be used to summarize, analyze and search for important data.
-
Logstash: as a data collection engine. It supports dynamic collection of data from various data sources, and performs operations such as filtering, analyzing, enriching, and unifying the format on the data, and then stores it in a location specified by the user, and generally sends it to Elasticsearch.
Logstash is written in Ruby language and runs on Java Virtual Machine (JVM). It is a powerful data processing tool that can realize data transmission, format processing, and format output. Logstash has a powerful plug-in function, which is often used for log processing.
#Other components that can be added:
- Filebeat: A lightweight open source log file data collector. Usually, Filebeat is installed on the client that needs to collect data, and the directory and log format are specified. Filebeat can quickly collect data and send it to logstash for analysis, or directly to Elasticsearch storage. Compared with logstash running on the JVM in terms of performance It has obvious advantages and is an alternative to it. Often used in the EFLK architecture.
Filebeat combined with logstash brings benefits:
1) Through Logstash has a disk-based adaptive buffering system that will absorb incoming throughput, thereby relieving the pressure on Elasticsearch to continuously write data
2) From other data sources (such as databases, S3 Object storage or messaging queue)
3) Send data to multiple destinations, such as S3, HDFS (Hadoop Distributed File System) or write to file
4) Use conditional data flow logic to compose more complex processing pipelines
-
Cache/message queue (redis, kafka, RabbitMQ, etc.): Traffic peak clipping and buffering can be performed on highly concurrent log data. Such buffering can protect data from loss to a certain extent, and can also decouple the application of the entire architecture.
-
Fluentd: is a popular open source data collector. Due to the shortcomings of logstash being too heavyweight, Logstash's low performance and high resource consumption, Fluentd appeared later. Compared with logstash, Fluentd is easier to use, consumes less resources, has higher performance, and is more efficient and reliable in data processing. It is welcomed by enterprises and has become an alternative to logstash, and is often used in the EFK architecture. EFK is also often used as a solution for log data collection in Kubernetes clusters.
Fluentd is generally run through a DaemonSet in a Kubernetes cluster so that it can run a Pod on each Kubernetes worker node. It works by taking container log files, filtering and transforming the log data, and then passing the data to an Elasticsearch cluster where it is indexed and stored.
1.2 Why use ELK
Logs mainly include system logs, application logs, and security logs. System operation and maintenance and developers can use logs to understand server software and hardware information, check errors in the configuration process and the reasons for errors. Frequent analysis of logs can help you understand the server's load, performance security, and take timely measures to correct errors.
Often we can use tools such as grep and awk to analyze the logs of a single machine, but when the logs are scattered and stored on different devices. If you manage tens or hundreds of servers, you are still viewing logs using the traditional method of logging into each machine in turn. Does this feel cumbersome and inefficient. As a top priority, we use centralized log management, such as open source syslog, to collect and summarize logs on all servers. After centralized management of logs, the statistics and retrieval of logs has become a more troublesome thing. Generally, we can use Linux commands such as grep, awk and wc to achieve retrieval and statistics, but for more demanding queries, sorting and statistics, etc. And the huge number of machines is still a bit powerless to use this method.
Generally, a large-scale system is a distributed deployment architecture. Different service modules are deployed on different servers. When a problem occurs, in most cases, it is necessary to locate the specific server and service module based on the key information exposed by the problem, and build a set of centralized The log system can improve the efficiency of locating problems.
1.3 Basic features of a complete log system
- Collection: Ability to collect log data from multiple sources
- Transmission: It can stably analyze, filter and transmit log data to the storage system
- storage: store log data
- Analysis: Support UI analysis
- WARNING: Ability to provide error reporting, monitoring mechanisms
1.4 How ELK works
(1) Deploy Logstash on all servers that need to collect logs; or centralize the management of logs on the log server first, and deploy Logstash on the log server.
(2) Logstash collects logs, formats and outputs logs to the Elasticsearch cluster.
(3) Elasticsearch indexes and stores the formatted data.
(4) Kibana queries the data from the ES cluster to generate charts and displays the front-end data.
Summary: logstash, as a log collector, collects data from data sources, filters and formats the data, and then stores it in Elasticsearch, and kibana visualizes the logs.
2. Build ELK
node1节点(2C/4G):node1/192.168.137.101 Elasticsearch
node2节点(2C/4G):node2/192.168.137.102 Elasticsearch
Apache节点:apache/192.168.137.103 Logstash Kibana Apache
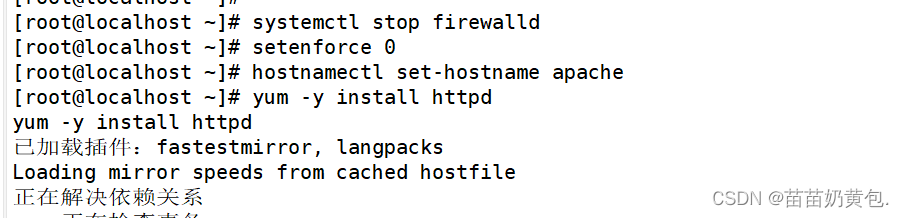
systemctl stop firewalld
setenforce 0
2.1 ELK Elasticsearch cluster deployment (operating on Node1 and Node2 nodes)
node1 operation
1.环境准备
#设置Java环境

java -version										#如果没有安装,yum -y install java
openjdk version "1.8.0_262"
OpenJDK Runtime Environment (build 1.8.0_262-b10)
OpenJDK 64-Bit Server VM (build 25.262-b12, mixed mode)
2.部署 Elasticsearch 软件
(1)安装elasticsearch—rpm包
#上传elasticsearch-6.7.2.rpm到/opt目录下
cd /opt
rpm -ivh elasticsearch-6.7.2.rpm
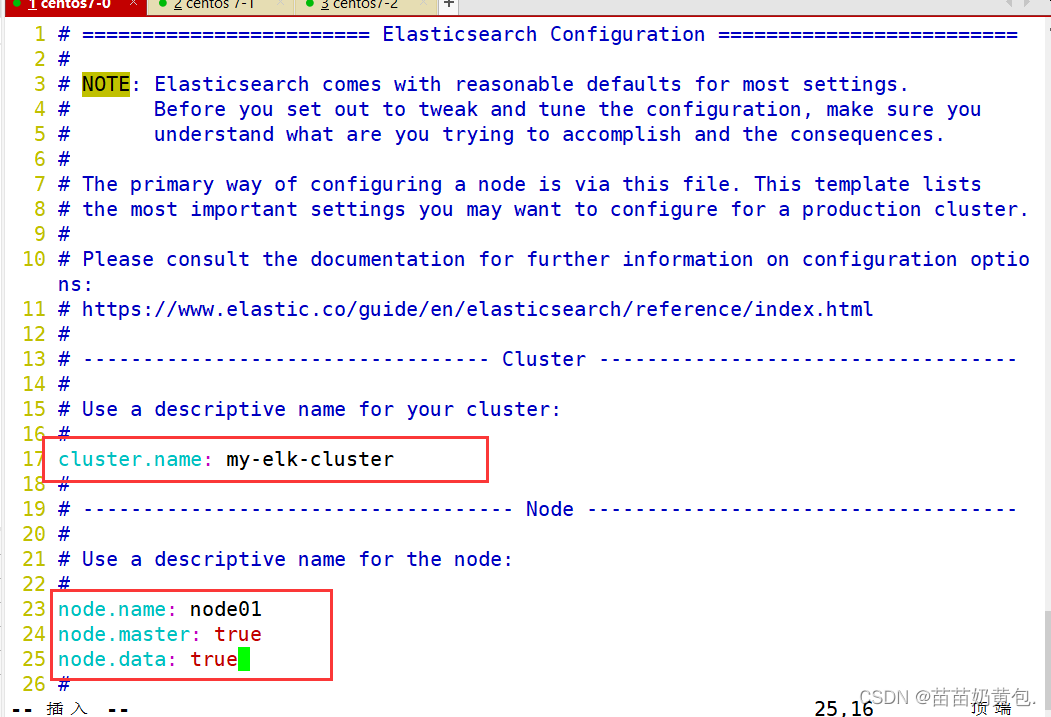
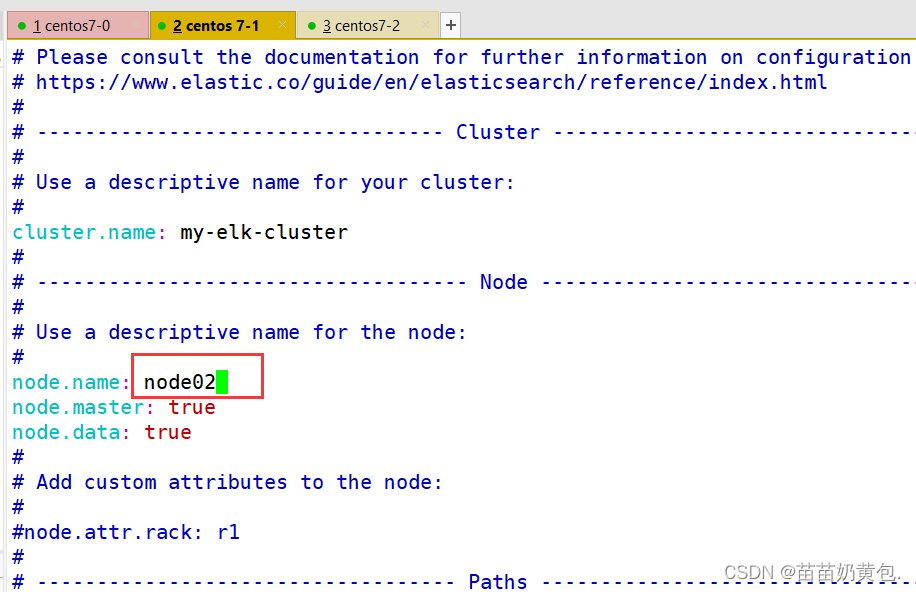
(2)修改elasticsearch主配置文件
cp /etc/elasticsearch/elasticsearch.yml /etc/elasticsearch/elasticsearch.yml.bak
vim /etc/elasticsearch/elasticsearch.yml
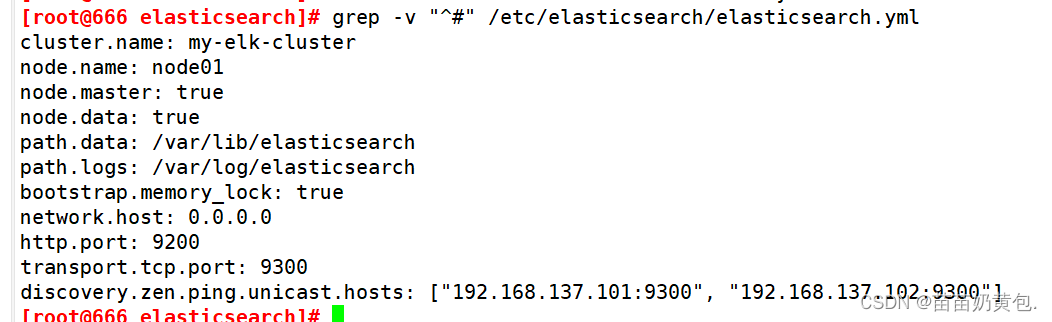
--17--取消注释,指定集群名字
cluster.name: my-elk-cluster
--23--取消注释,指定节点名字:Node1节点为node1,Node2节点为node2
node.name: node1
node.master: true #是否master节点,false为否
node.data: true #是否数据节点,false为否
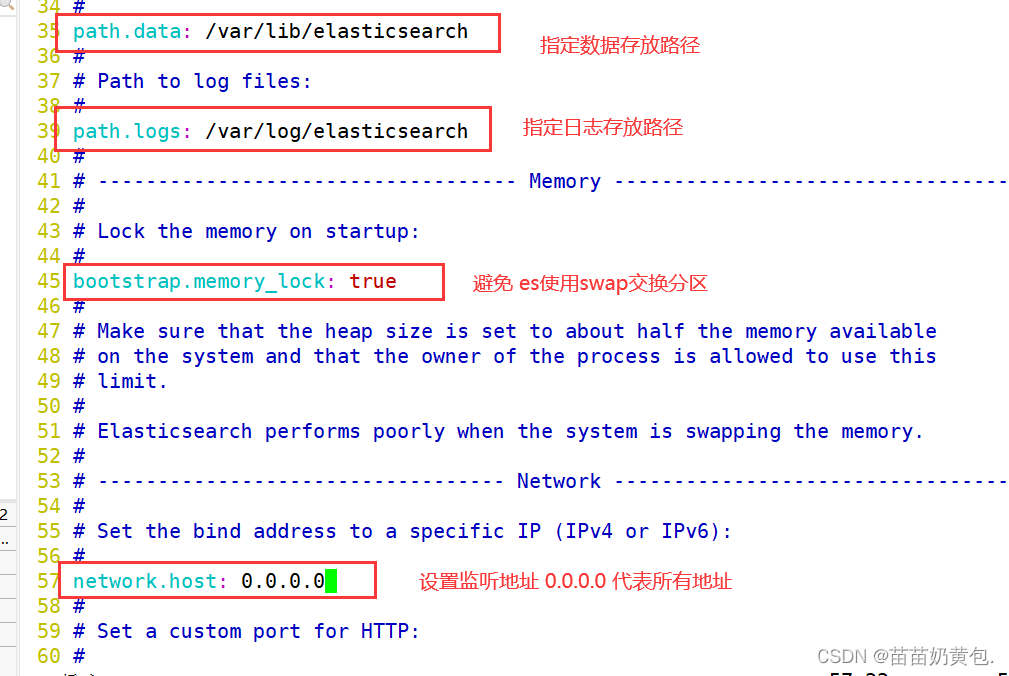
--33--取消注释,指定数据存放路径
path.data: /var/lib/elasticsearch
--37--取消注释,指定日志存放路径
path.logs: /var/log/elasticsearch
--43--取消注释,避免es使用swap交换分区
bootstrap.memory_lock: true
--55--取消注释,设置监听地址,0.0.0.0代表所有地址
network.host: 0.0.0.0
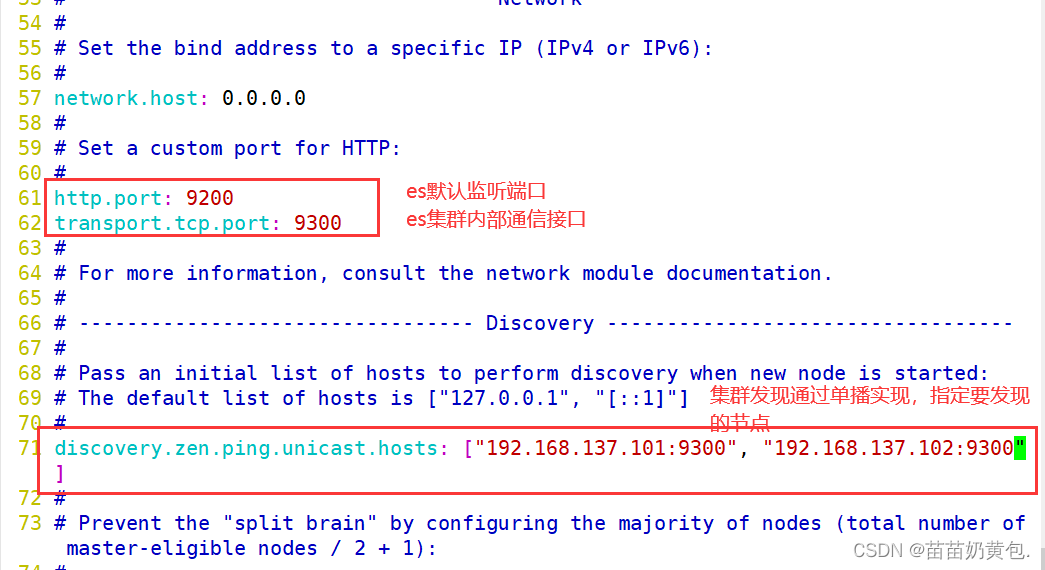
--59--取消注释,ES 服务的默认监听端口为9200
http.port: 9200 #指定es集群提供外部访问的接口
transport.tcp.port: 9300 #指定es集群内部通信接口
--68--取消注释,集群发现通过单播实现,指定要发现的节点
discovery.zen.ping.unicast.hosts: ["192.168.80.10:9300", "192.168.80.11:9300"]
grep -v "^#" /etc/elasticsearch/elasticsearch.yml
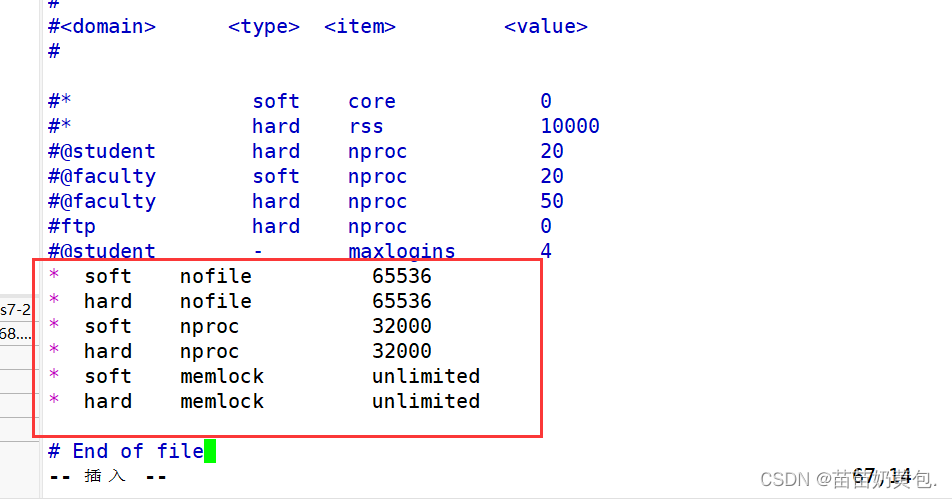
(3)es 性能调优参数
#优化最大内存大小和最大文件描述符的数量
vim /etc/security/limits.conf
......
* soft nofile 65536
* hard nofile 65536
* soft nproc 32000
* hard nproc 32000
* soft memlock unlimited
* hard memlock unlimited
vim /etc/systemd/system.conf
DefaultLimitNOFILE=65536
DefaultLimitNPROC=32000
DefaultLimitMEMLOCK=infinity
需重启生效
#优化elasticsearch用户拥有的内存权限
由于ES构建基于lucene, 而lucene设计强大之处在于lucene能够很好的利用操作系统内存来缓存索引数据,以提供快速的查询性能。lucene的索引文件segements是存储在单文件中的,并且不可变,对于OS来说,能够很友好地将索引文件保持在cache中,以便快速访问;因此,我们很有必要将一半的物理内存留给lucene ; 另一半的物理内存留给ES(JVM heap )。所以, 在ES内存设置方面,可以遵循以下原则:
1.当机器内存小于64G时,遵循通用的原则,50%给ES,50%留给操作系统,供lucene使用
2.当机器内存大于64G时,遵循原则:建议分配给ES分配 4~32G 的内存即可,其它内存留给操作系统,供lucene使用
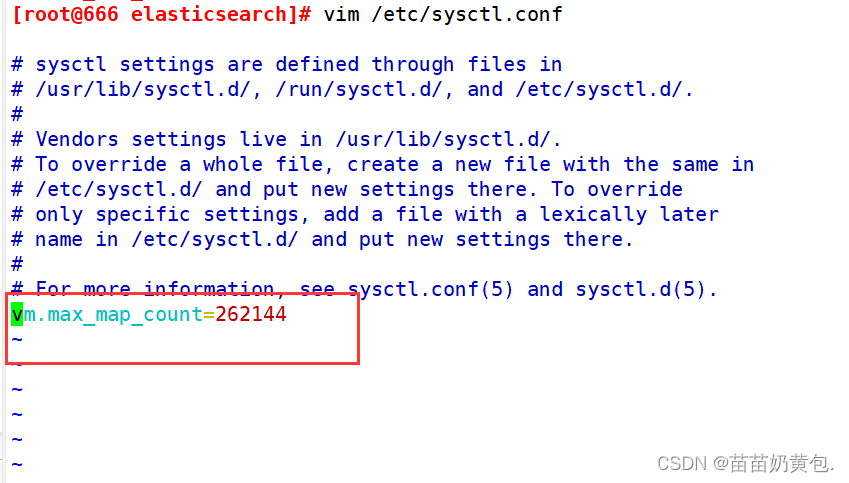
vim /etc/sysctl.conf
#一个进程可以拥有的最大内存映射区域数,参考数据(分配 2g/262144,4g/4194304,8g/8388608)
vm.max_map_count=262144
sysctl -p
sysctl -a | grep vm.max_map_count

node2 operates with node1
(5)查看节点信息
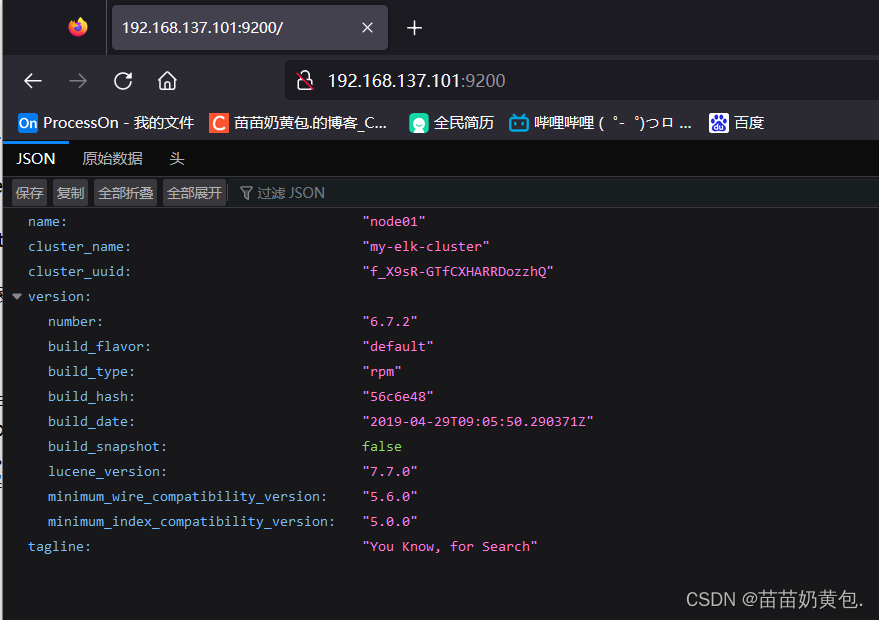
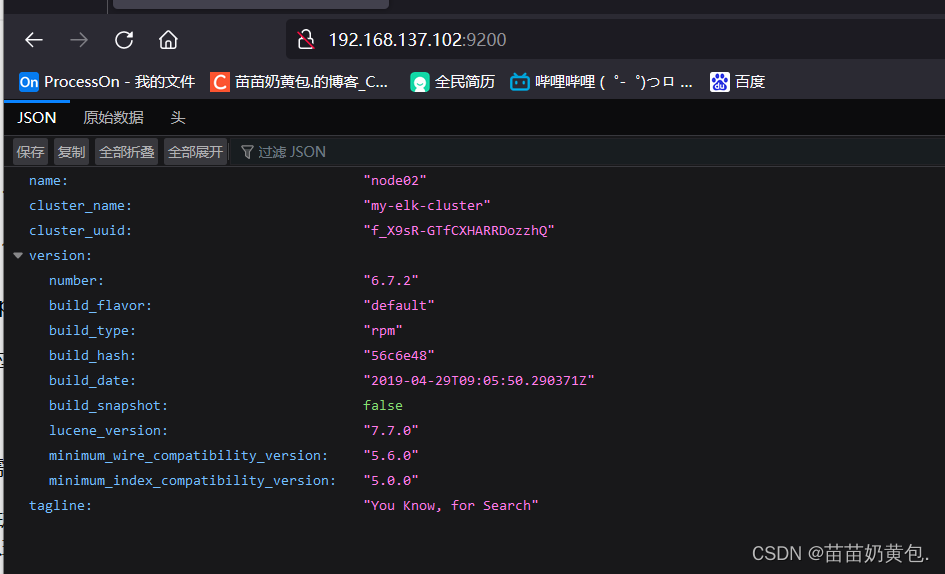
浏览器访问 http://192.168.137.101:9200 、 http://192.168.137.102:9200 查看节点 Node1、Node2 的信息。
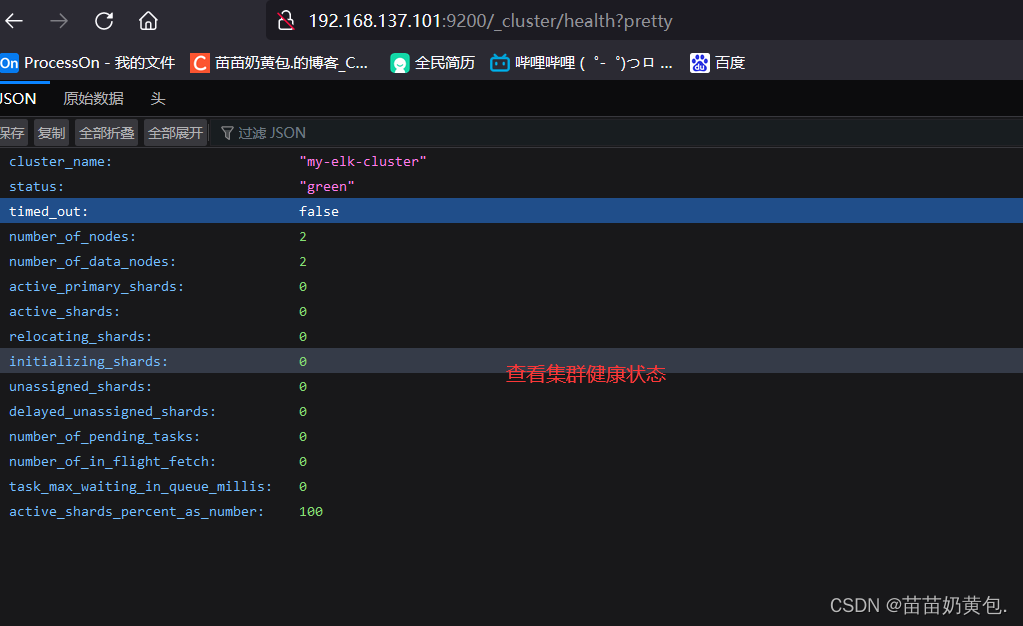
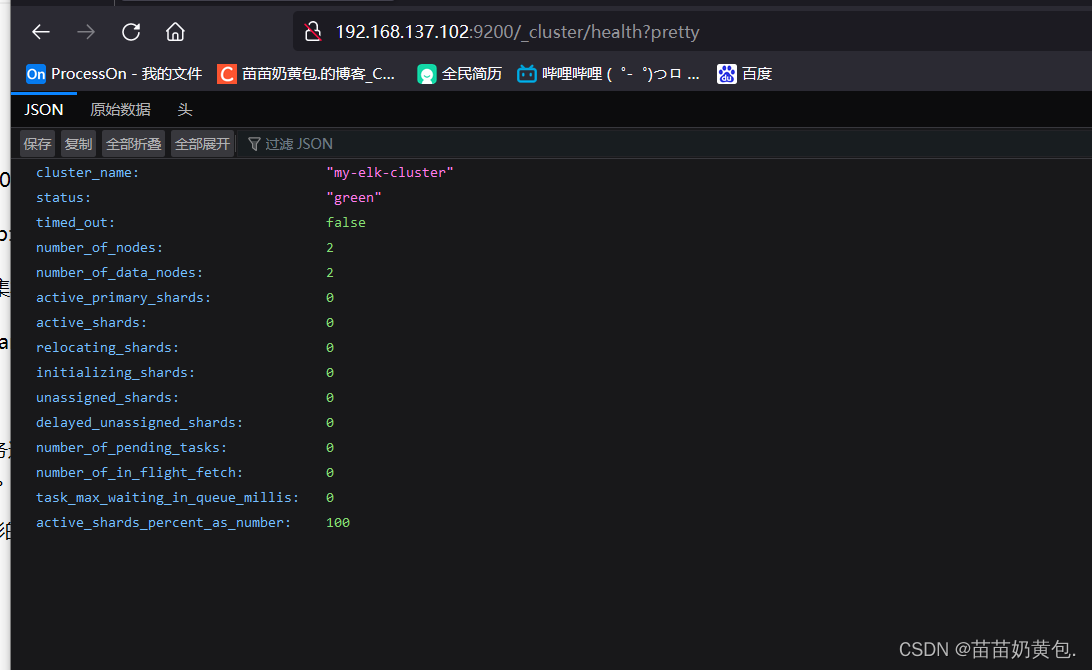
浏览器访问 http://192.168.137.101:9200/_cluster/health?pretty 、 http://192.168.137.101:9200/_cluster/health?pretty查看群集的健康情况,可以看到 status 值为 green(绿色), 表示节点健康运行。
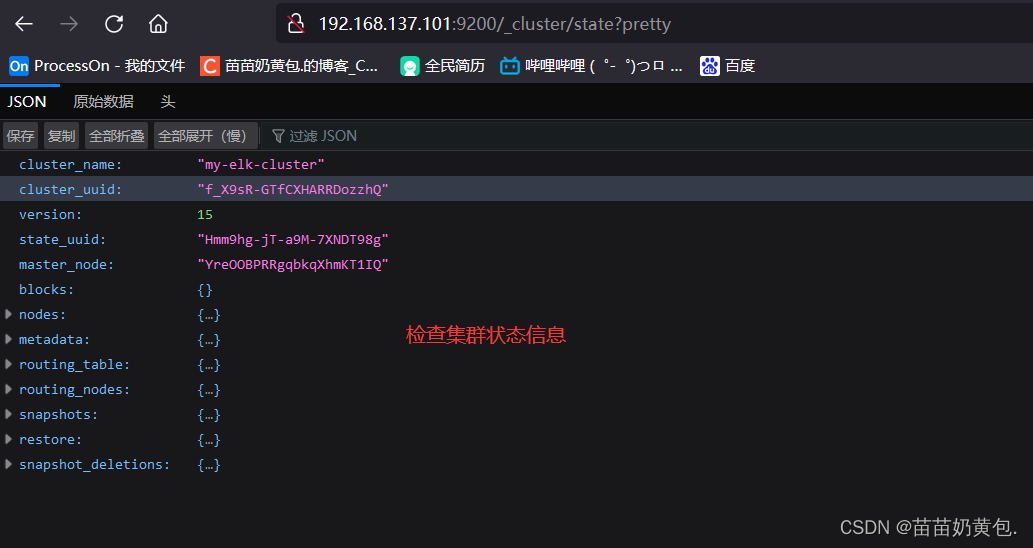
浏览器访问 http://192.168.137.101:9200/_cluster/state?pretty 检查群集状态信息。
#使用上述方式查看群集的状态对用户并不友好,可以通过安装 Elasticsearch-head 插件,可以更方便地管理群集。
2.2 Install the Elasticsearch-head plugin
After Elasticsearch version 5.0, the Elasticsearch-head plug-in needs to be installed as an independent service, and needs to be installed using the npm tool (a package management tool for NodeJS).
To install Elasticsearch-head, you need to install the dependent software node and phantomjs in advance.
node: is a JavaScript runtime environment based on the Chrome V8 engine.
phantomjs: is a webkit-based JavaScript API, which can be understood as an invisible browser, and it can do anything that a webkit-based browser can do.
(1)编译安装 node
#上传软件包 node-v8.2.1.tar.gz 到/opt
yum install gcc gcc-c++ make -y

cd /opt
tar zxvf node-v8.2.1.tar.gz

cd node-v8.2.1/
./configure
make && make install
(2)安装 phantomjs
#上传软件包 phantomjs-2.1.1-linux-x86_64.tar.bz2 到
cd /opt
tar jxvf phantomjs-2.1.1-linux-x86_64.tar.bz2
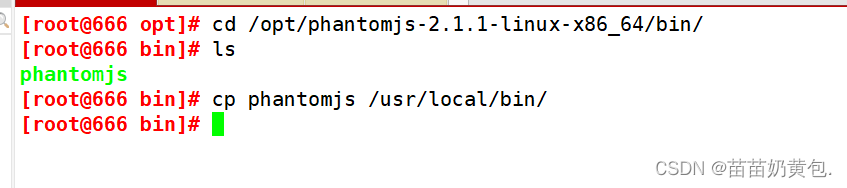
cd /opt/phantomjs-2.1.1-linux-x86_64/bin
cp phantomjs /usr/local/bin
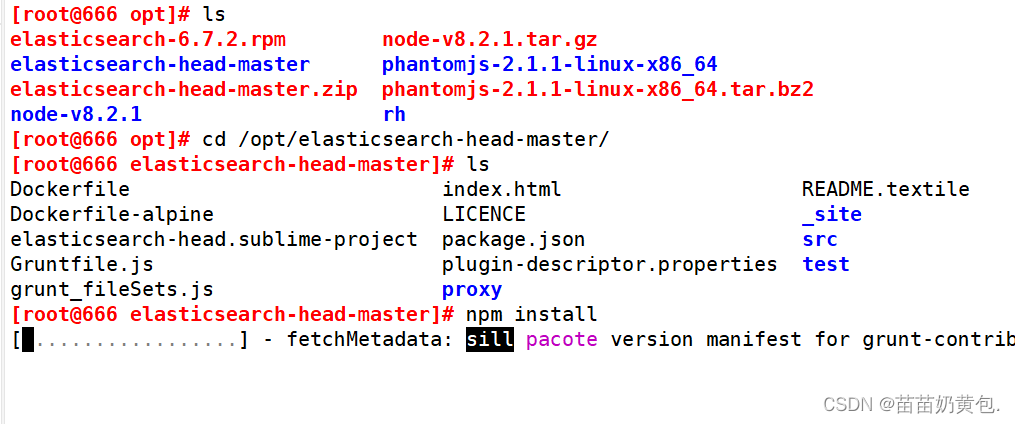
(3)安装 Elasticsearch-head 数据可视化工具
#上传软件包 elasticsearch-head-master.zip 到/opt
cd /opt
unzip elasticsearch-head-master.zip
cd /opt/elasticsearch-head/
npm install		 //安装依赖包
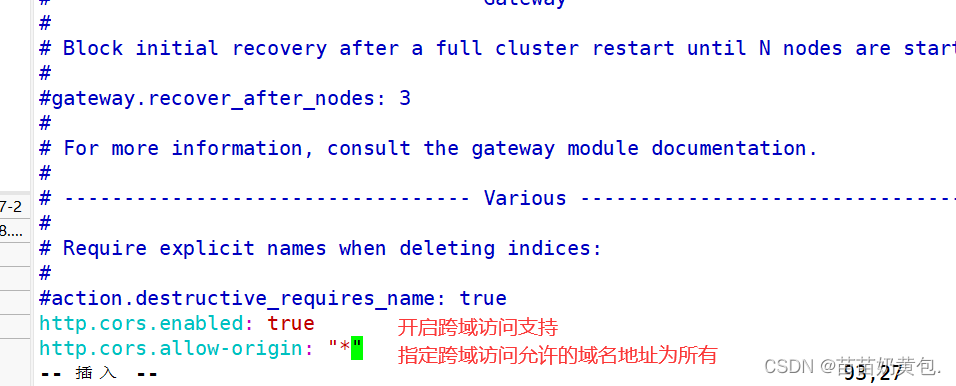
(4)修改 Elasticsearch 主配置文件
vim /etc/elasticsearch/elasticsearch.yml
......
--末尾添加以下内容--
http.cors.enabled: true #开启跨域访问支持,默认为 false
http.cors.allow-origin: "*" #指定跨域访问允许的域名地址为所有
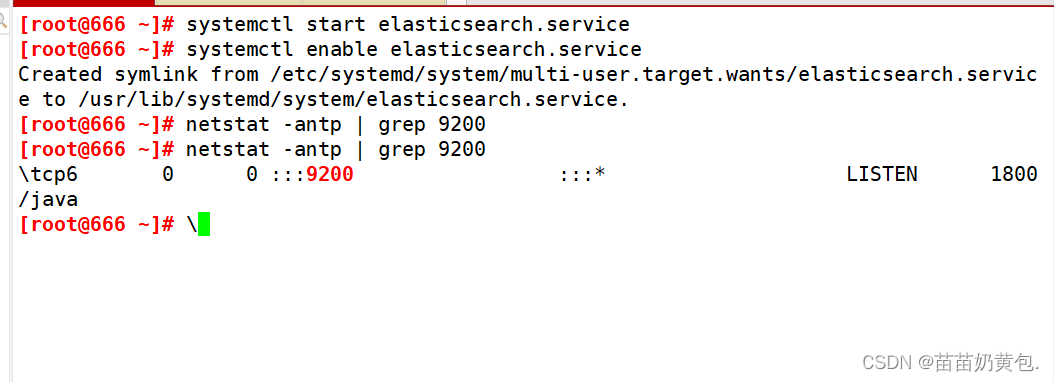
systemctl restart elasticsearch
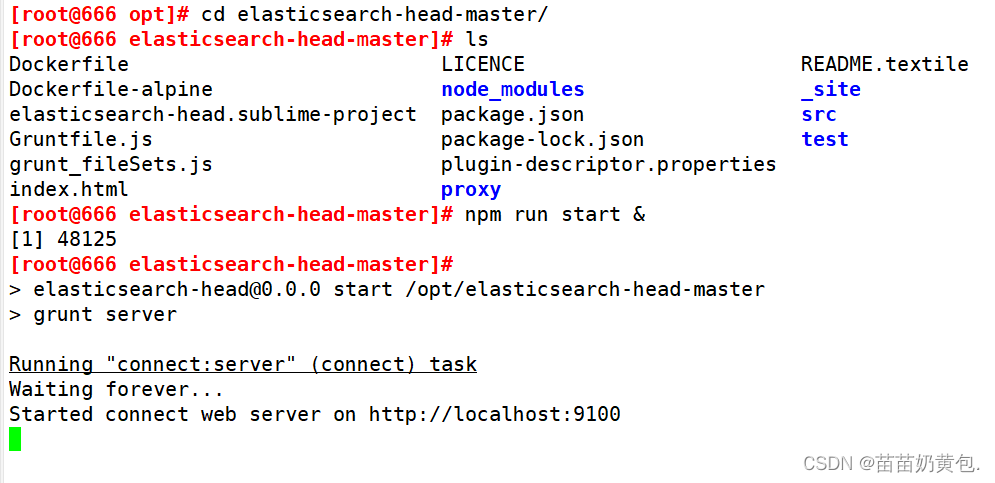
(5)启动 elasticsearch-head 服务
#必须在解压后的 elasticsearch-head 目录下启动服务,进程会读取该目录下的 gruntfile.js 文件,否则可能启动失败。
cd /usr/local/src/elasticsearch-head/
npm run start &
> [email protected] start /usr/local/src/elasticsearch-head
> grunt server
Running "connect:server" (connect) task
Waiting forever...
Started connect web server on http://localhost:9100
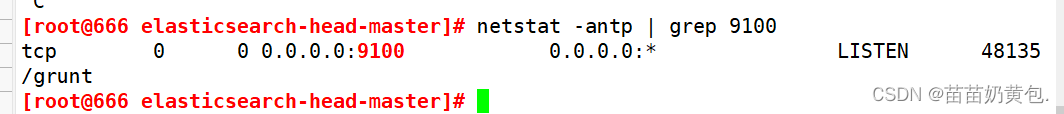
#elasticsearch-head 监听的端口是 9100
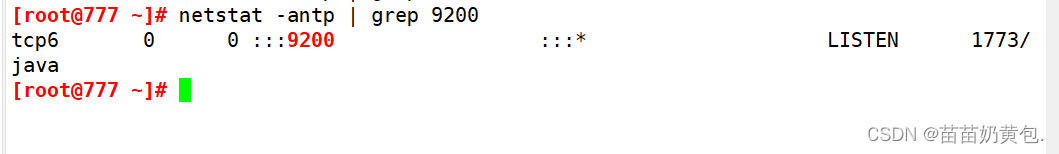
netstat -natp |grep 9100
(6)通过 Elasticsearch-head 查看 Elasticsearch 信息
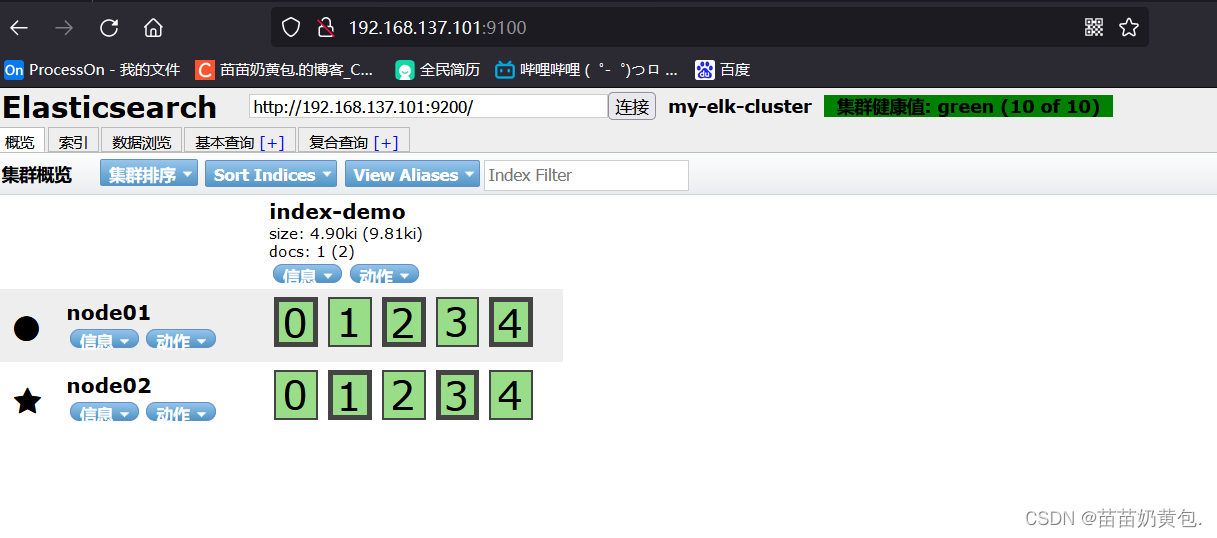
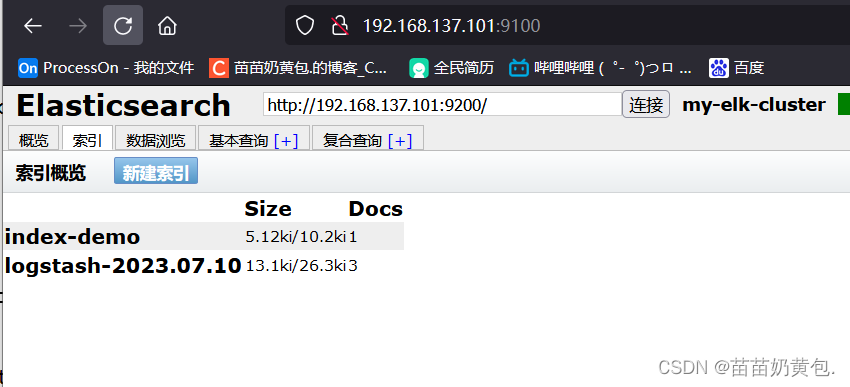
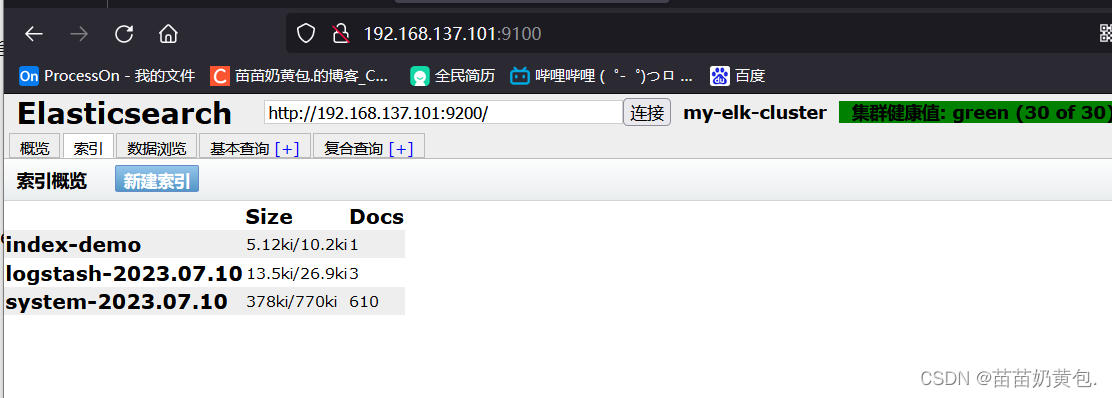
通过浏览器访问 http://192.168.137.101:9100/ 地址并连接群集。如果看到群集健康值为 green 绿色,代表群集很健康。
(7)插入索引
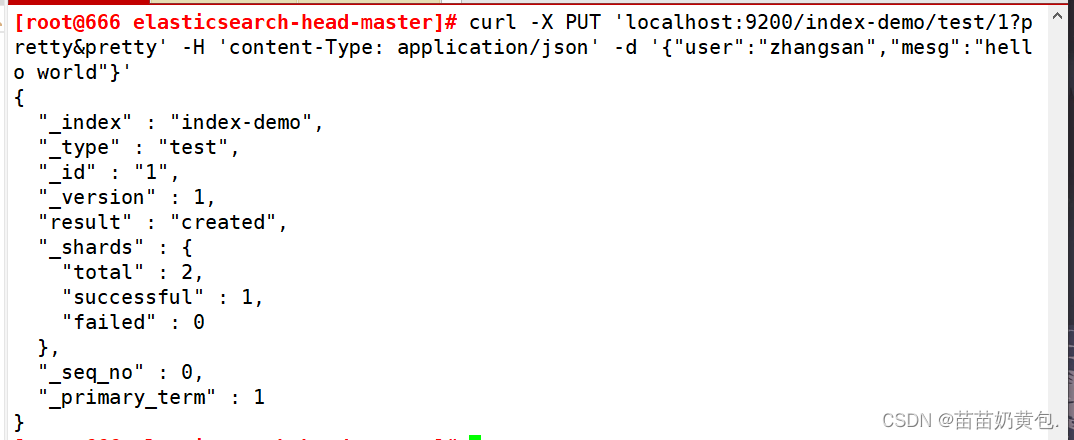
#通过命令插入一个测试索引,索引为 index-demo,类型为 test。
curl -X PUT 'localhost:9200/index-demo/test/1?pretty&pretty' -H 'content-Type: application/json' -d '{"user":"zhangsan","mesg":"hello world"}'
//输出结果如下:
{
"_index" : "index-demo",
"_type" : "test",
"_id" : "1",
"_version" : 1,
"result" : "created",
"_shards" : {
"total" : 2,
"successful" : 2,
"failed" : 0
},
"created" : true
}
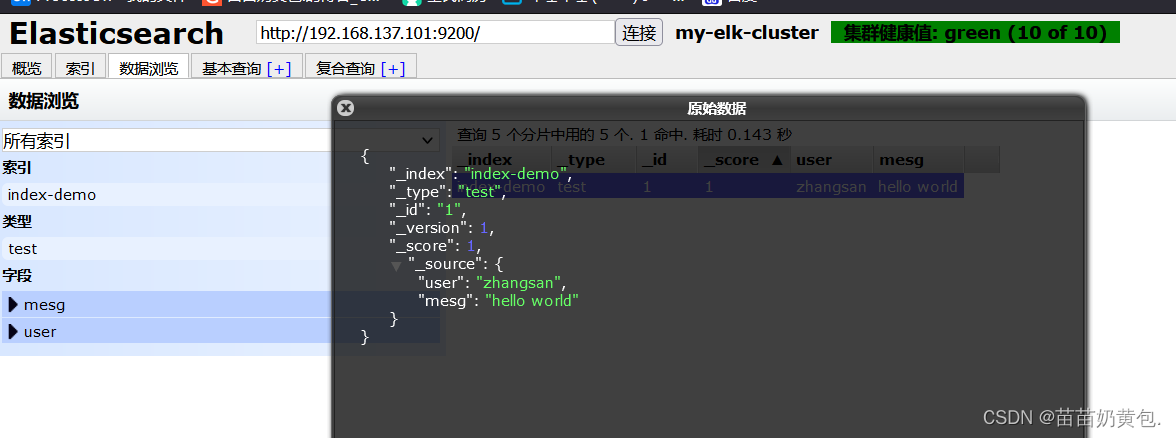
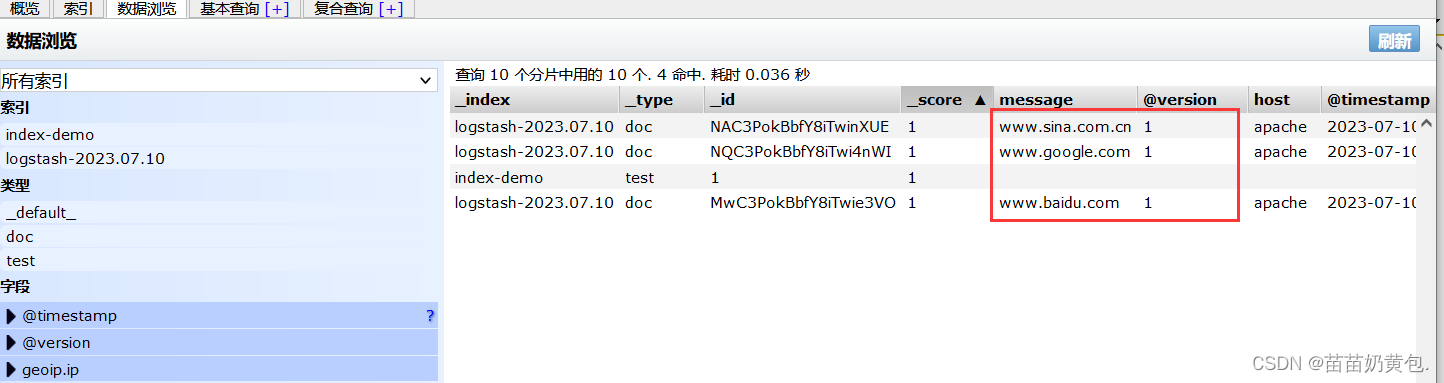
浏览器访问 http://192.168.80.10:9100/ 查看索引信息,可以看见索引默认被分片5个,并且有一个副本。
点击“数据浏览”,会发现在node1上创建的索引为 index-demo,类型为 test 的相关信息。
ELK Logstash deployment (operating on Apache nodes)
Logstash is generally deployed on servers whose logs need to be monitored. In this case, Logstash is deployed on the Apache server to collect the log information of the Apache server and send it to Elasticsearch.
1.更改主机名
hostnamectl set-hostname apache
2.安装Apahce服务(httpd)
yum -y install httpd
systemctl start httpd
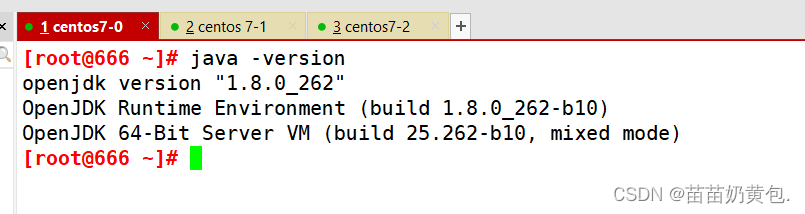
3.安装Java环境
yum -y install java
java -version
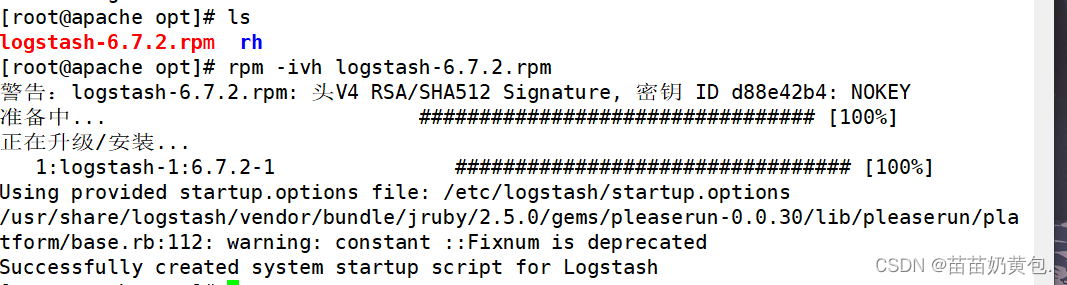
4.安装logstash
#上传软件包 logstash-6.7.2.rpm 到/opt目录下
cd /opt
rpm -ivh logstash-6.7.2.rpm
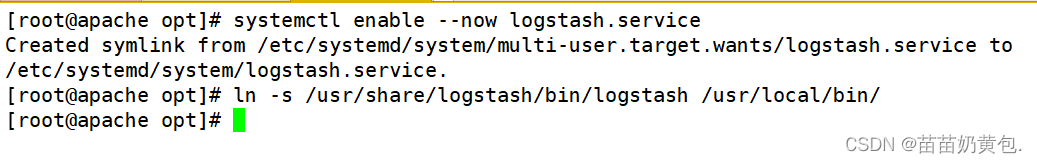
systemctl start logstash.service
systemctl enable logstash.service
ln -s /usr/share/logstash/bin/logstash /usr/local/bin/
5.测试 Logstash
Logstash 命令常用选项:
-f:通过这个选项可以指定 Logstash 的配置文件,根据配置文件配置 Logstash 的输入和输出流。
-e:从命令行中获取,输入、输出后面跟着字符串,该字符串可以被当作 Logstash 的配置(如果是空,则默认使用 stdin 作为输入,stdout 作为输出)。
-t:测试配置文件是否正确,然后退出。
定义输入和输出流:
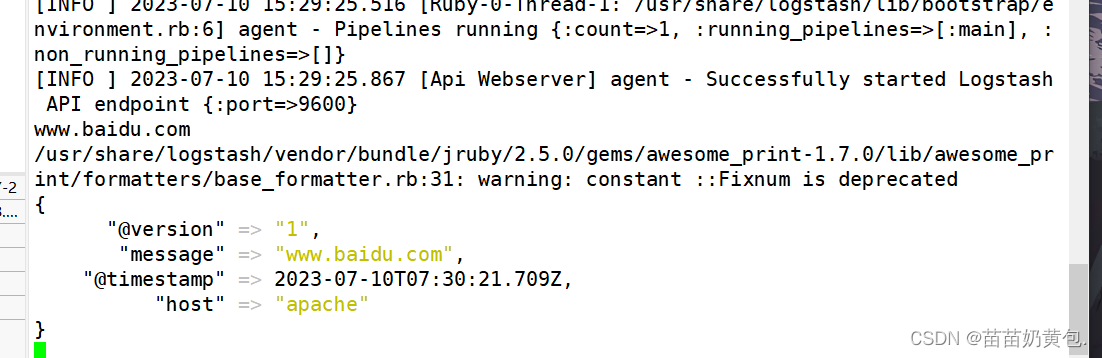
#输入采用标准输入,输出采用标准输出(类似管道),新版本默认使用 rubydebug 格式输出
logstash -e 'input { stdin{} } output { stdout{} }'
#使用 rubydebug 输出详细格式显示,codec 为一种编解码器
logstash -e 'input { stdin{} } output { stdout{ codec=>rubydebug } }'
......
www.baidu.com #键入内容(标准输入)
{
"@timestamp" => 2020-12-22T02:15:39.136Z, #输出结果(标准输出处理后的结果)
"@version" => "1",
"host" => "apache",
"message" => "www.baidu.com"
}
#使用 Logstash 将信息写入 Elasticsearch 中
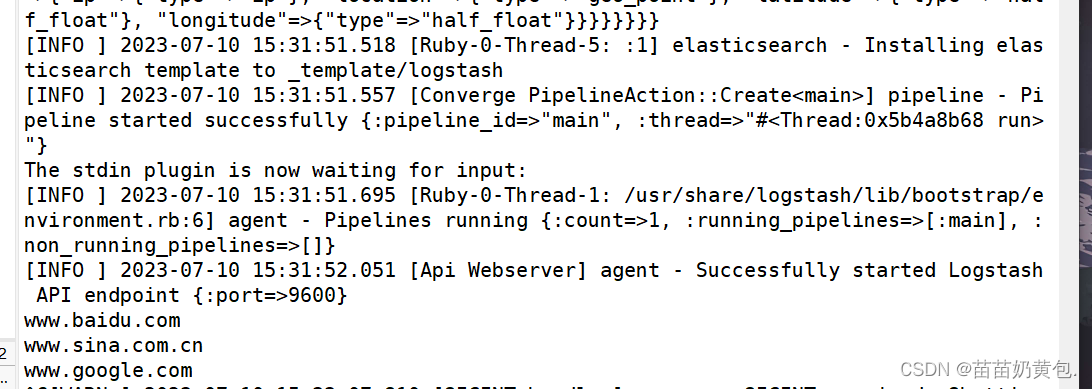
logstash -e 'input { stdin{} } output { elasticsearch { hosts=>["192.168.80.10:9200"] } }'
输入 输出 对接
......
www.baidu.com #键入内容(标准输入)
www.sina.com.cn #键入内容(标准输入)
www.google.com #键入内容(标准输入)
//结果不在标准输出显示,而是发送至 Elasticsearch 中,可浏览器访问 http://192.168.80.10:9100/ 查看索引信息和数据浏览。
6.定义 logstash配置文件
Logstash 配置文件基本由三部分组成:input、output 以及 filter(可选,根据需要选择使用)。
●input:表示从数据源采集数据,常见的数据源如Kafka、日志文件等
file beats kafka redis stdin
●filter:表示数据处理层,包括对数据进行格式化处理、数据类型转换、数据过滤等,支持正则表达式
grok 对若干个大文本字段进行再分割成一些小字段 (?<字段名>正则表达式) 字段名: 正则表达式匹配到的内容
date 对数据中的时间格式进行统一和格式化
mutate 对一些无用的字段进行剔除,或增加字段
mutiline 对多行数据进行统一编排,多行合并或拆分
●output:表示将Logstash收集的数据经由过滤器处理之后输出到Elasticsearch。
elasticsearch stdout
#格式如下:
input {
...}
filter {
...}
output {
...}
#在每个部分中,也可以指定多个访问方式。例如,若要指定两个日志来源文件,则格式如下:
input {
file {
path =>"/var/log/messages" type =>"syslog"}
file {
path =>"/var/log/httpd/access.log" type =>"apache"}
}
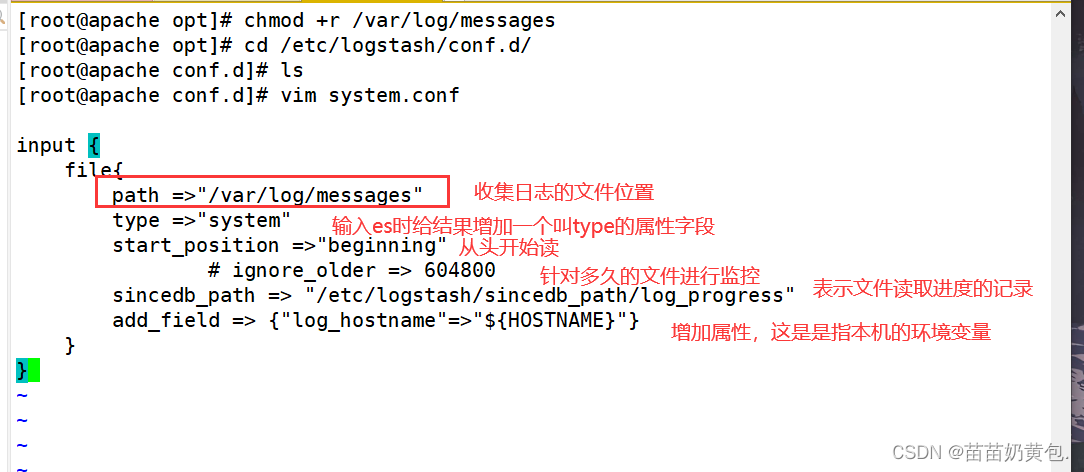
#修改 Logstash 配置文件,让其收集系统日志/var/log/messages,并将其输出到 elasticsearch 中。
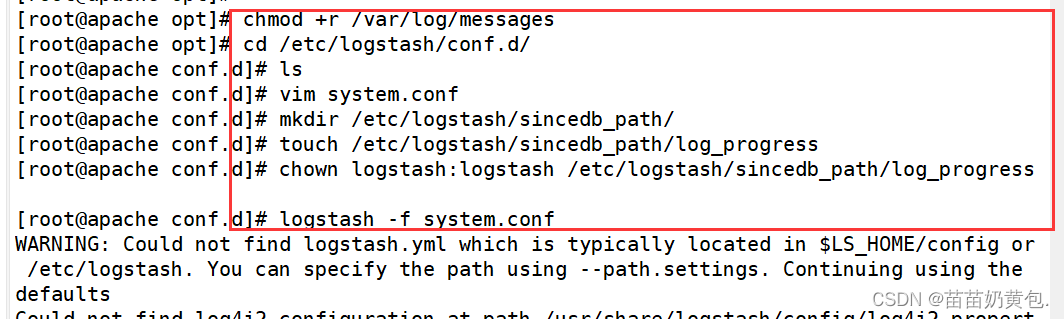
chmod +r /var/log/messages #让 Logstash 可以读取日志
cd /etc/logstash/conf.d/
vim system.conf
input {
file{
path =>"/var/log/messages"
type =>"system"
start_position =>"beginning"
# ignore_older => 604800
sincedb_path => "/etc/logstash/sincedb_path/log_progress"
add_field => {
"log_hostname"=>"${
HOSTNAME}"}
}
}
#path表示要收集的日志的文件位置
#type是输入ES时给结果增加一个叫type的属性字段
#start_position可以设置为beginning或者end,beginning表示从头开始读取文件,end表示读取最新的,这个要和ignore_older一起使用
#ignore_older表示了针对多久的文件进行监控,默认一天,单位为秒,可以自己定制,比如默认只读取一天内被修改的文件
#sincedb_path表示文件读取进度的记录,每行表示一个文件,每行有两个数字,第一个表示文件的inode,第二个表示文件读取到的位置(byteoffset)。默认为$HOME/.sincedb*
#add_field增加属性。这里使用了${HOSTNAME},即本机的环境变量,如果要使用本机的环境变量,那么需要在启动命令上加--alow-env
output {
elasticsearch {
#输出到 elasticsearch
hosts => ["192.168.80.10:9200","192.168.80.11:9200"] #指定 elasticsearch 服务器的地址和端口
index =>"system-%{+YYYY.MM.dd}" #指定输出到 elasticsearch 的索引格式
}
}
mkdir /etc/logstash/sincedb_path/
touch /etc/logstash/sincedb_path/log_progress
chown logstash:logstash /etc/logstash/sincedb_path/log_progress
logstash -f system.conf
浏览器访问 http://192.168.80.10:9100/ 查看索引信息
ELK Kiabana deployment (operated on Node1 node)
1.安装 Kiabana
#上传软件包 kibana-6.7.2-x86_64.rpm 到/opt目录
cd /opt
rpm -ivh kibana-6.7.2-x86_64.rpm
2.设置 Kibana 的主配置文件
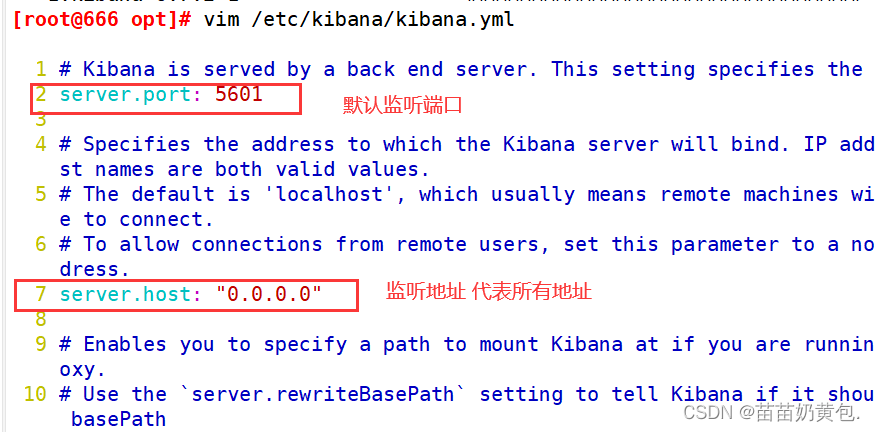
vim /etc/kibana/kibana.yml
--2--取消注释,Kiabana 服务的默认监听端口为5601
server.port: 5601
--7--取消注释,设置 Kiabana 的监听地址,0.0.0.0代表所有地址
server.host: "0.0.0.0"
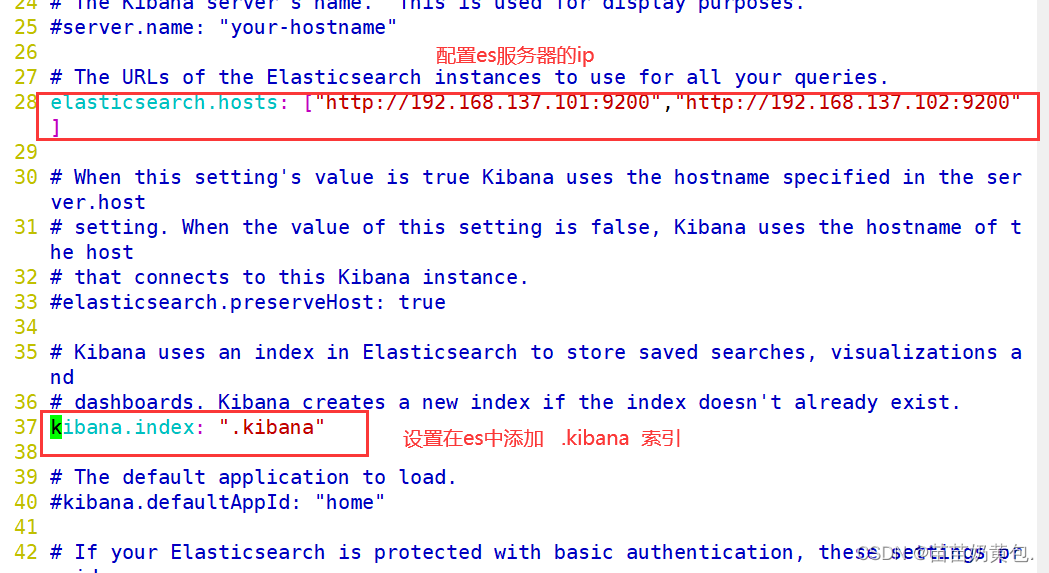
--28--取消注释,配置es服务器的ip,如果是集群则配置该集群中master节点的ip
elasticsearch.url: ["http://192.168.80.10:9200","http://192.168.80.11:9200"]
--37--取消注释,设置在 elasticsearch 中添加.kibana索引
kibana.index: ".kibana"
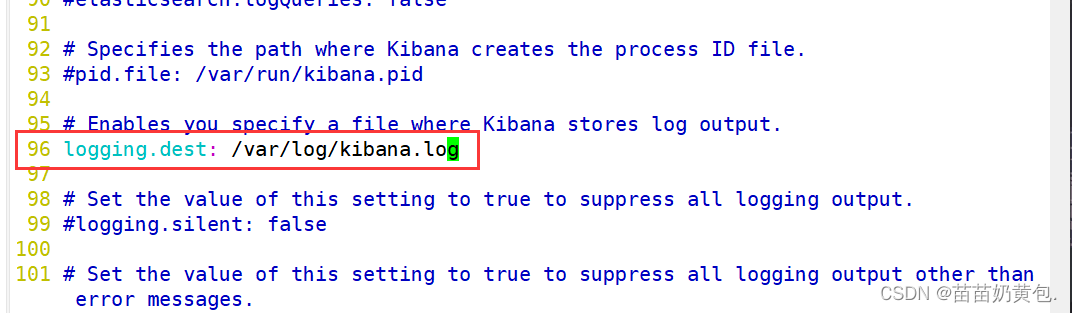
--96--取消注释,配置kibana的日志文件路径(需手动创建),不然默认是messages里记录日志
logging.dest: /var/log/kibana.log
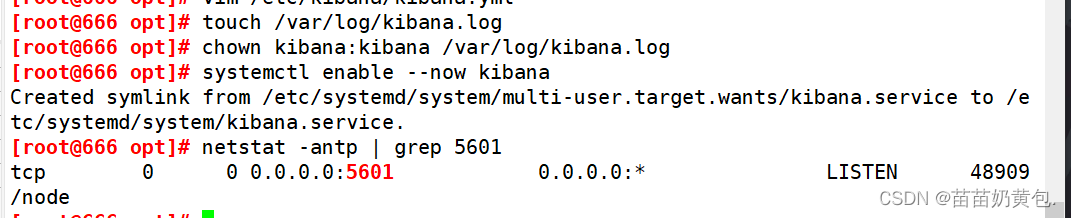
3.创建日志文件,启动 Kibana 服务
touch /var/log/kibana.log
chown kibana:kibana /var/log/kibana.log
systemctl start kibana.service
systemctl enable kibana.service
netstat -natp | grep 5601
4.验证 Kibana
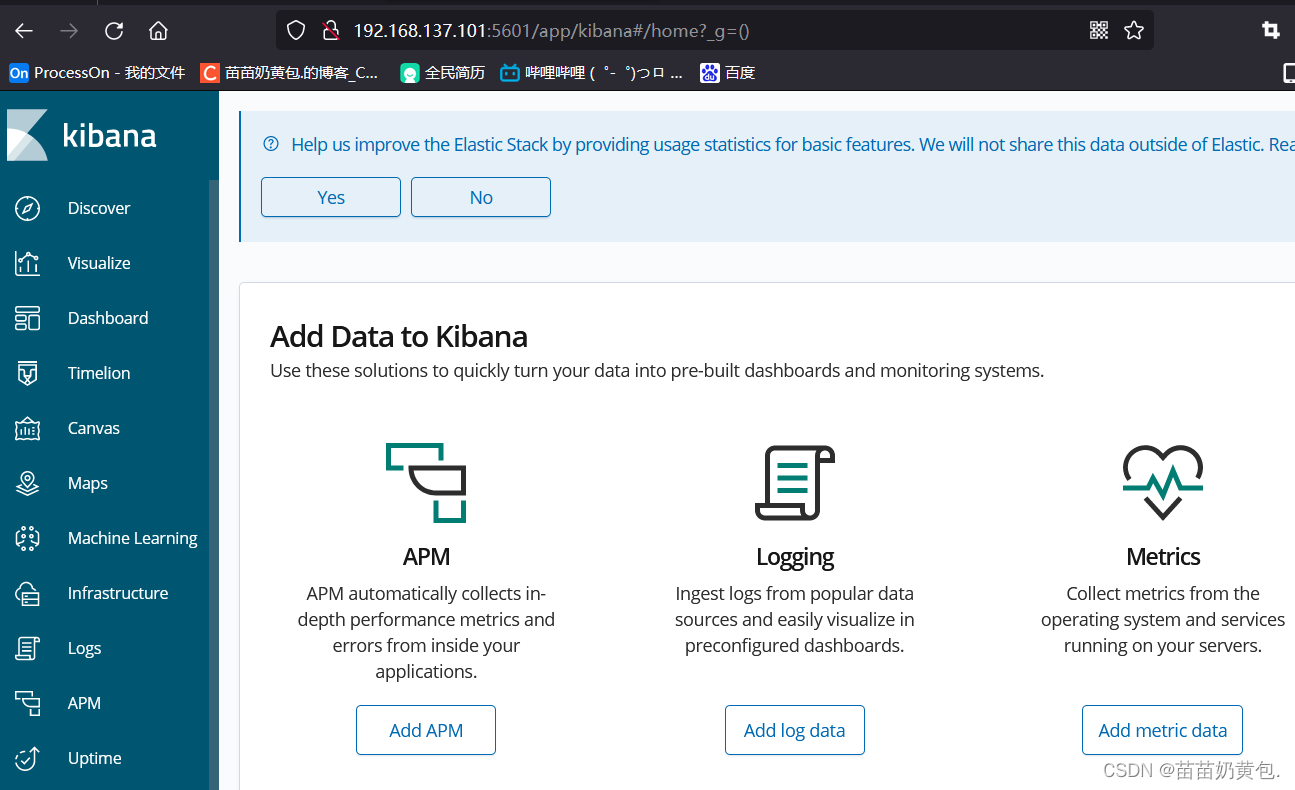
浏览器访问 http://192.168.80.10:5601
第一次登录需要添加一个 Elasticsearch 索引:
Management -> Index Pattern -> Create index pattern
Index pattern 输入:system-* #在索引名中输入之前配置的 Output 前缀“system”
Next step -> Time Filter field name 选择 @timestamp -> Create index pattern
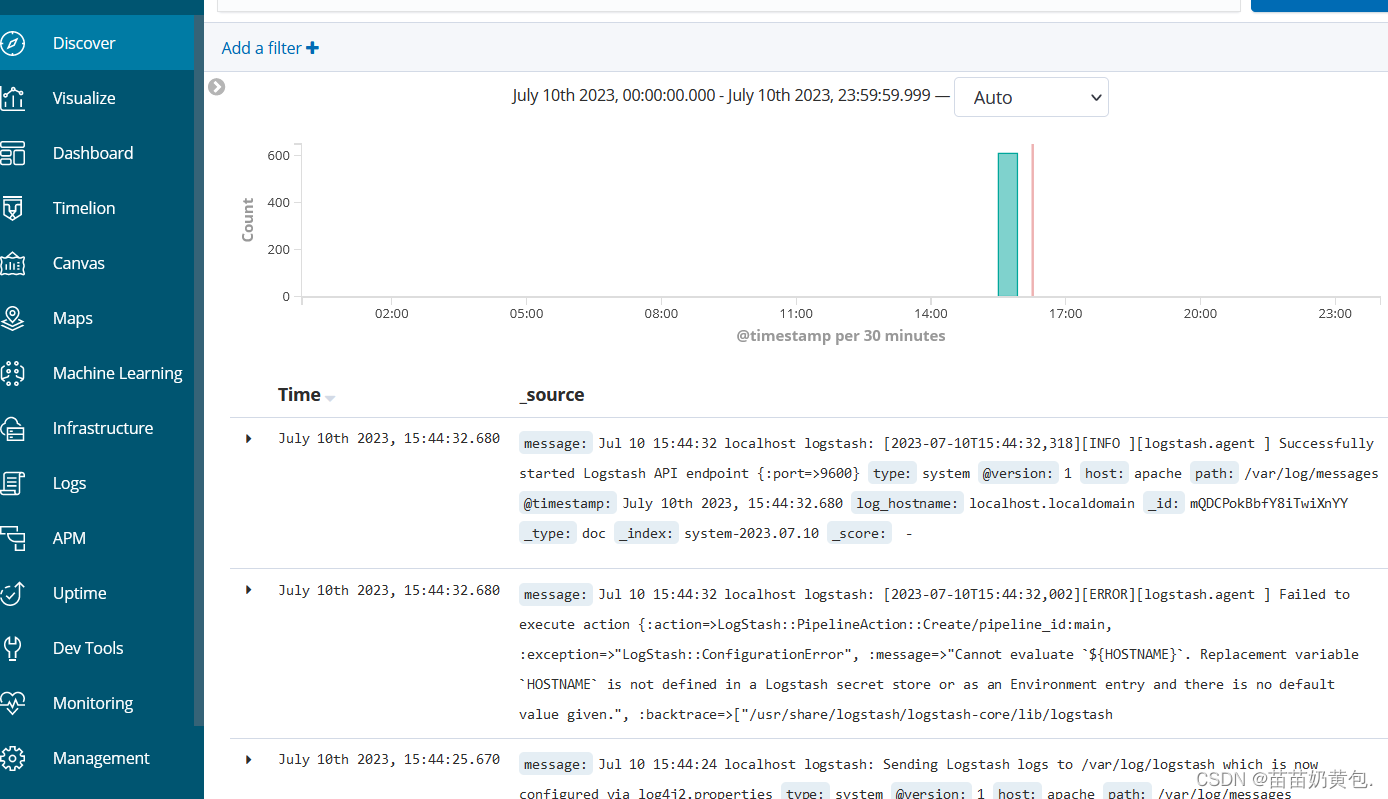
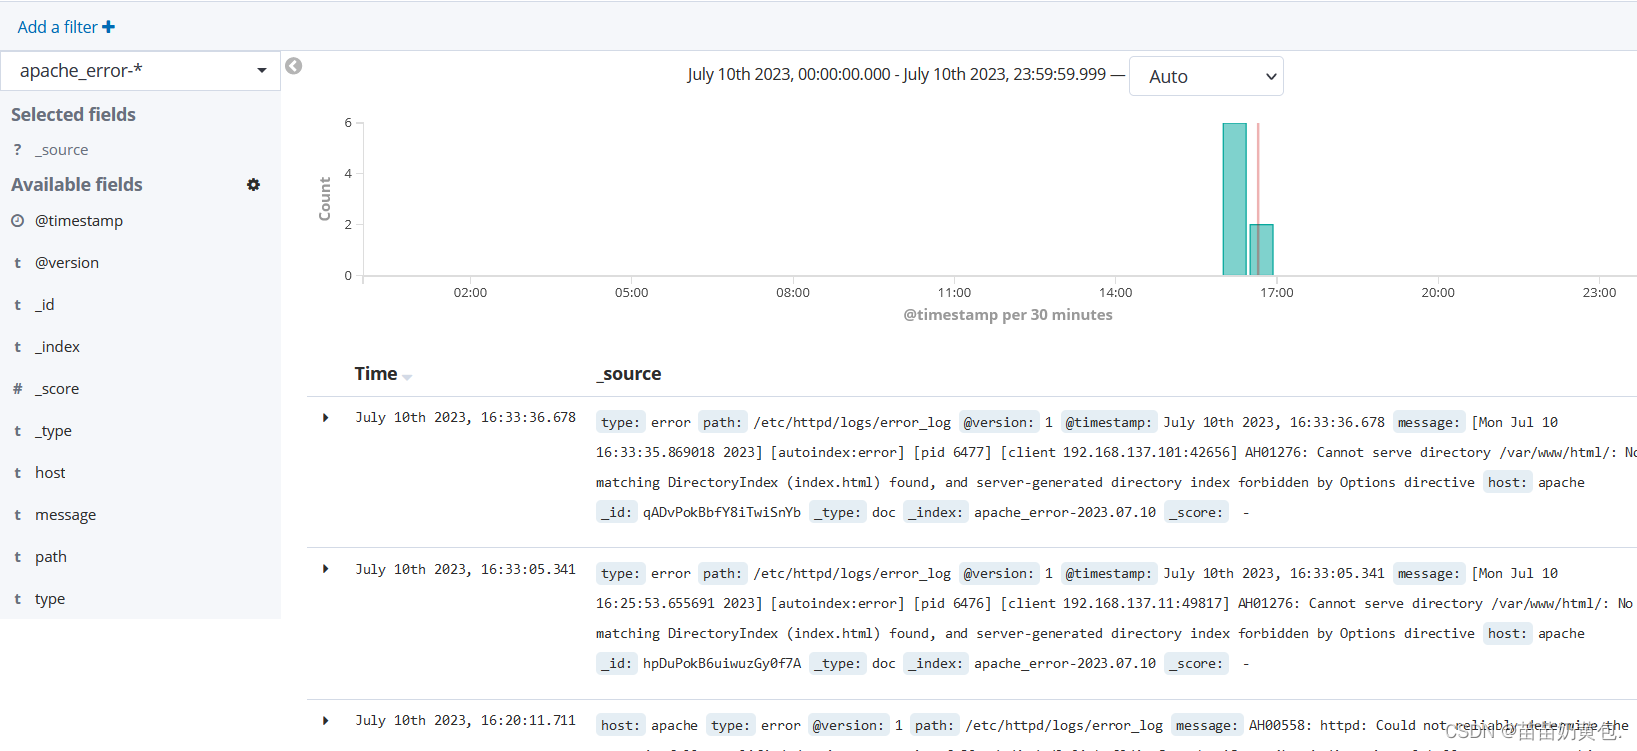
单击 “Discover” 按钮可查看图表信息及日志信息。
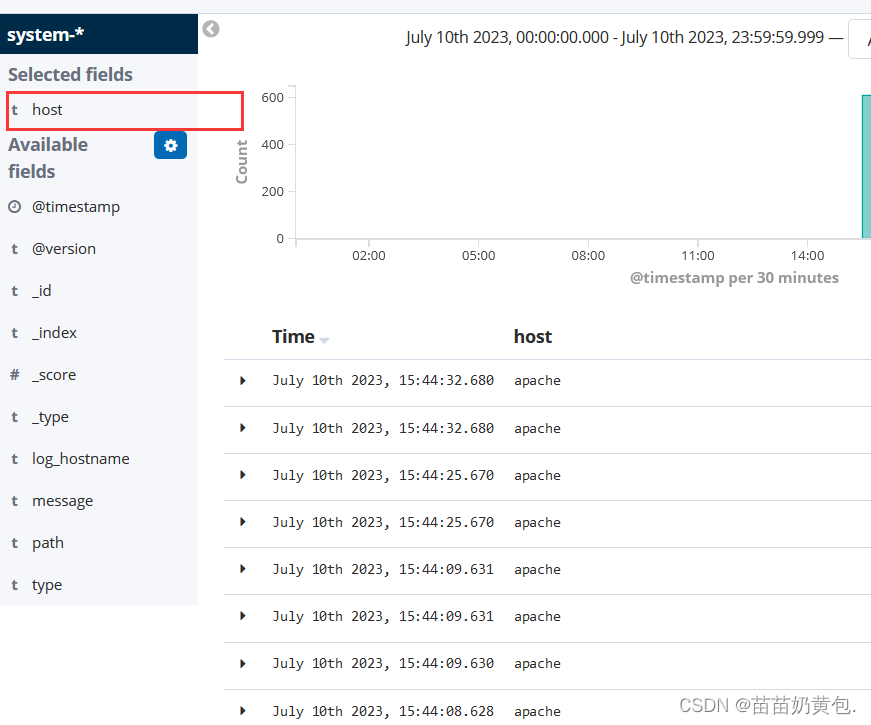
数据展示可以分类显示,在“Available Fields”中的“host”,然后单击 “add”按钮,可以看到按照“host”筛选后的结果
5.将 Apache 服务器的日志(访问的、错误的)添加到 Elasticsearch 并通过 Kibana 显示
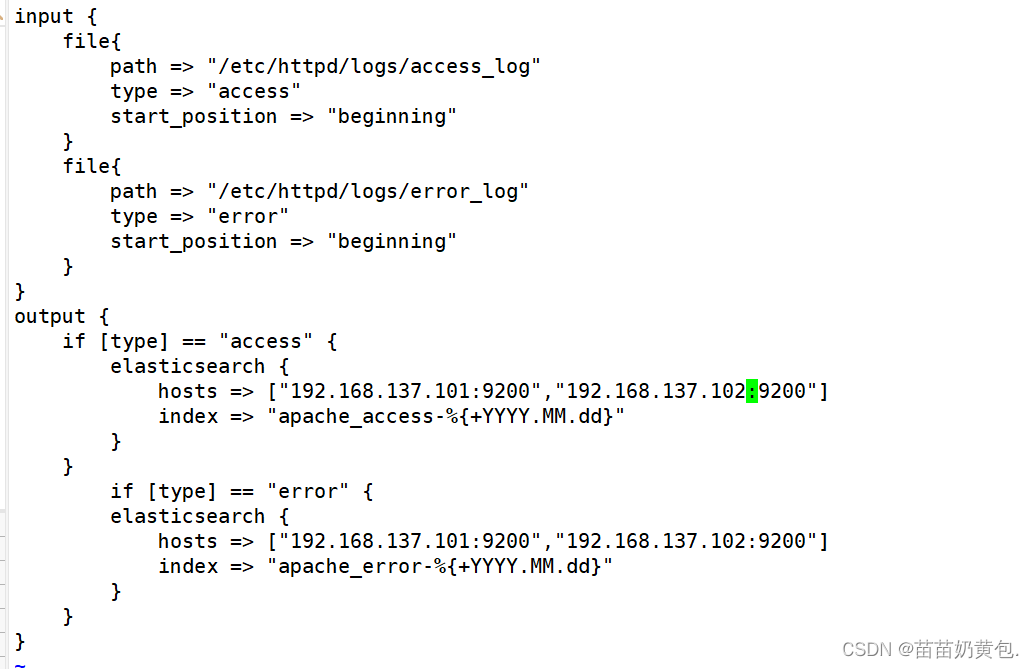
vim /etc/logstash/conf.d/apache_log.conf
input {
file{
path => "/etc/httpd/logs/access_log"
type => "access"
start_position => "beginning"
}
file{
path => "/etc/httpd/logs/error_log"
type => "error"
start_position => "beginning"
}
}
output {
if [type] == "access" {
elasticsearch {
hosts => ["192.168.80.10:9200","192.168.80.11:9200"]
index => "apache_access-%{+YYYY.MM.dd}"
}
}
if [type] == "error" {
elasticsearch {
hosts => ["192.168.80.10:9200","192.168.80.11:9200"]
index => "apache_error-%{+YYYY.MM.dd}"
}
}
}
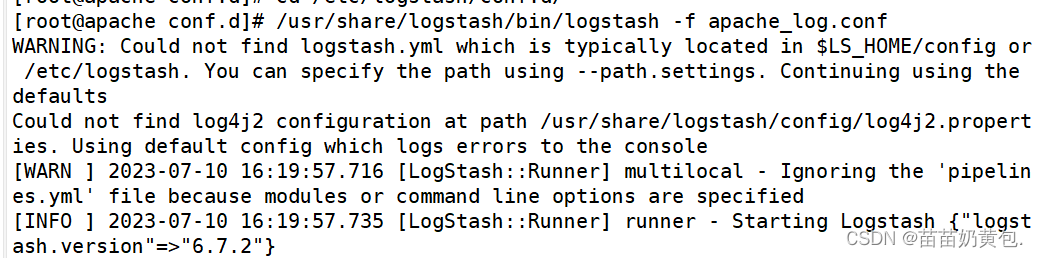
cd /etc/logstash/conf.d/
/usr/share/logstash/bin/logstash -f apache_log.conf
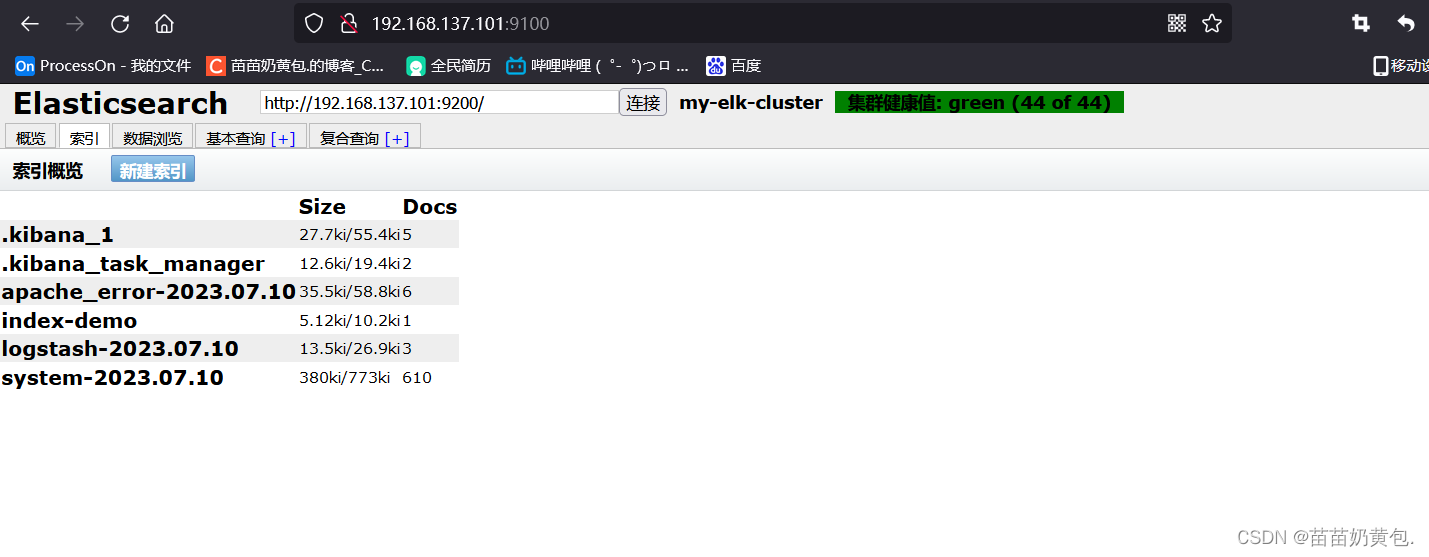
浏览器访问 http://192.168.80.10:9100 查看索引是否创建
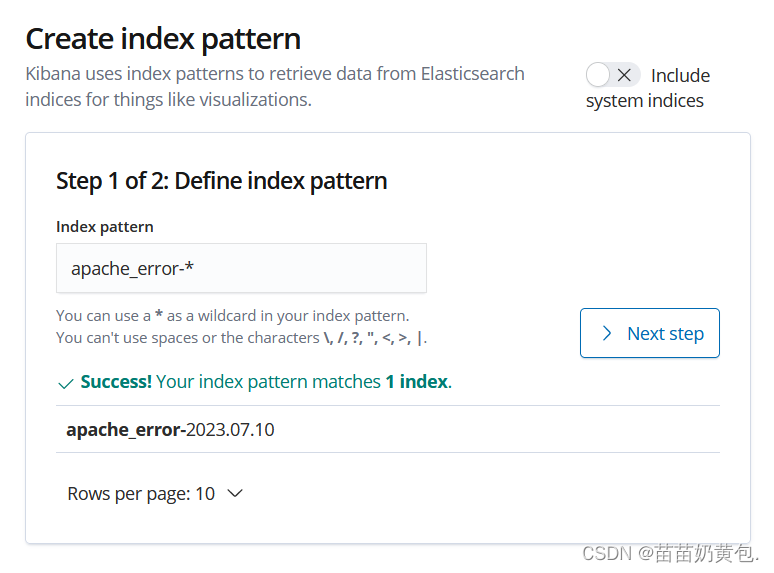
浏览器访问 http://192.168.80.10:5601 登录 Kibana,单击“Index Pattern -> Create Index Pattern”按钮添加索引, 在索引名中输入之前配置的 Output 前缀 apache_access-*,并单击“Create”按钮。在用相同的方法添加 apache_error-*索引。
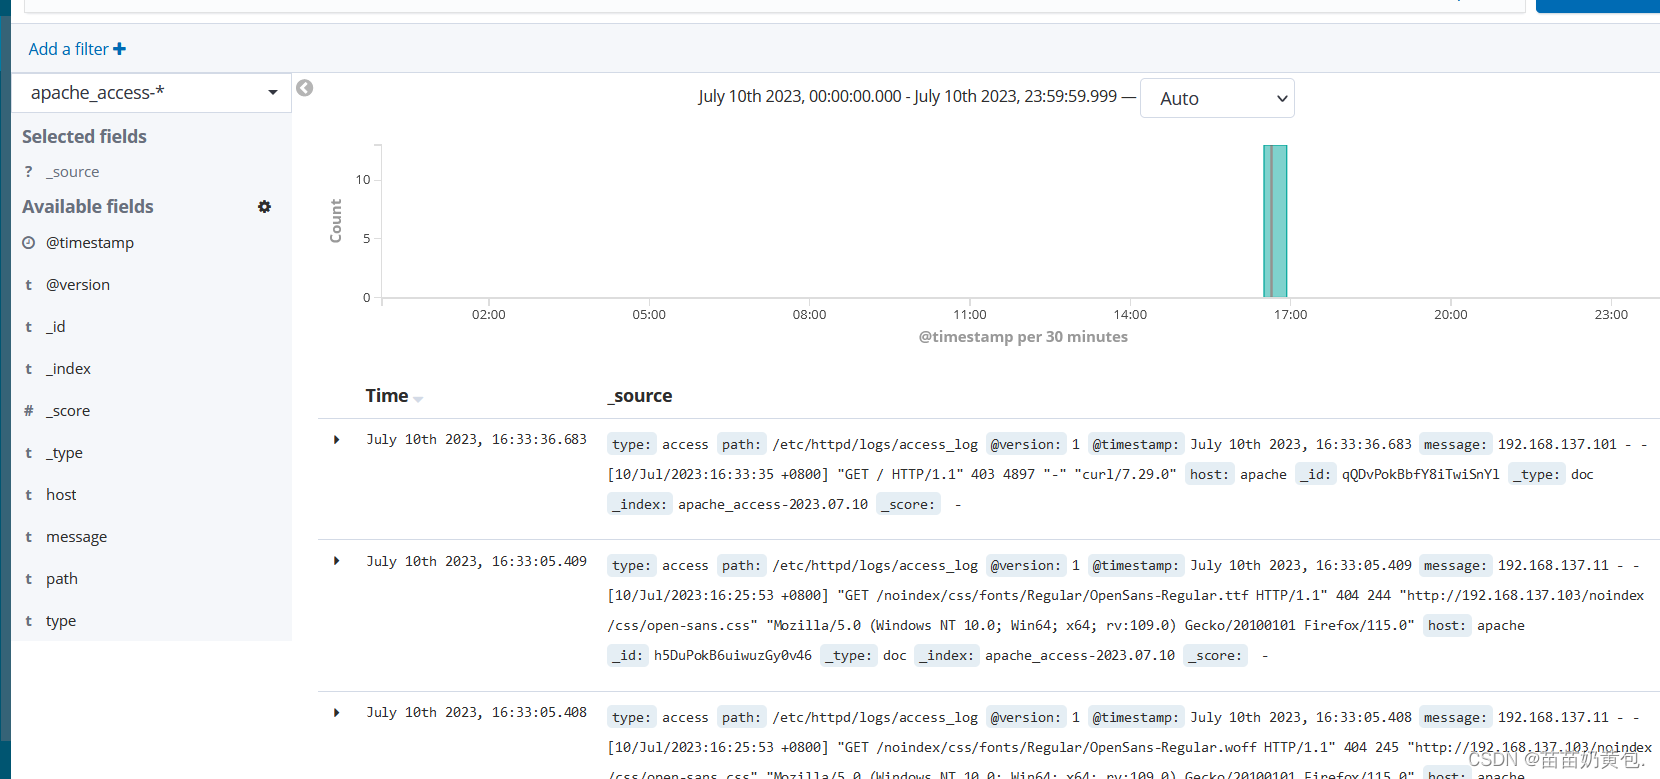
选择“Discover”选项卡,在中间下拉列表中选择刚添加的 apache_access-* 、apache_error-* 索引, 可以查看相应的图表及日志信息。