ELK log analysis system
- 1. Introduction
- 2. Introduction to Elasticsearch
- Three, Logstash introduction
- Four, Kibana introduction
- 5. Deploy ELK log analysis system
-
- 1. Requirements description
- 2. Equipment list
- 3. Experimental topology
- 4. Prepare the installation environment
- Configure ES node 1 server
-
- 1. Turn off the firewall and security functions
- 2. Modify the hostname configuration file
- 3. Mount the resource package remotely
- 4. Install the software package
- 5. Load system services
- 6. Self-starting service at boot
- 7. Back up configuration files
- 8. Modify the elasticsearch main configuration file
- 9. Create a database storage path
- 10. Authorized database storage path
- 11. Turn on elasticsearch service
- 12. View port service status
- 13. Install the compilation environment
- 14. Unzip the node node software package
- 15. Placement node
- 16. Compile and install
- Install phantomjs front-end framework
- Install elasticsearch-head data visualization tool
- The configuration of ES node 2 server is the same as that of node 1, repeat the above operations.
- Use the browser to enter the 192.168.142.152:9100 URL and connect to the address of another node to check the cluster health status
- Create index
- Configure Apache server, install logstash, collect logs
- Go back to node1 and install kibana
- Docking with all Apache log files of the Apache host (operating on the Apache server)
- Test Apache log information display
1. Introduction
Log server
提高安全性
集中存放日志
defect
对日志的分析困难
Structural analysis
AppServer (client)-Logtash/Agent (collecting and outputting logs) -> ElasticSerach/Cluster (index database) -> Kibana (log display tool) Server -> Browser
Simple result topology

ELK log analysis system
Elasticsearch
是实时全文搜索和分析引擎
Logstash
是一个用来搜集、分析、过滤日志的工具
Kibana
是一个基于Web的图形界面,用于搜索、分析和可视化存储在 Elasticsearch指标中的日志数据
Log processing steps
将日志进行集中化管理
将日志格式化( Logstash )并输出到Elasticsearch
对格式化后的数据进行索引和存储( Elasticsearch )
前端数据的展示( Kibana )
2. Introduction to Elasticsearch
1. Overview of Elasticsearch
提供了一个分布式多用户能力的全文搜索引擎
2. The concept of Elasticsearch
接近实时
集群
节点
索引:
索引(库)–>类型(表)–>文档(记录)
分片和副本
Three, Logstash introduction
1. Introduction to Logstash
一款强大的数据处理工具,可以实现数据传输、格式处理、格式化输出
数据输入、数据加工(如过滤,改写等)以及数据输出
2. The main components of LogStash
Shipper
Indexer
Broker
Search and Storage
Web Interface
Four, Kibana introduction
1, Kibana
一个针对Elasticsearch的开源分析及可视化平台
搜索、查看存储在Elasticsearch索引中的数据
通过各种图表进行高级数据分析及展示
2. Kibana main functions
Elasticsearch无缝之集成
整合数据,复杂数据分析
让更多团队成员受益
接口灵活,分享更容易
配置简单,可视化多数据源
简单数据导出
5. Deploy ELK log analysis system
1. Requirements description
配置ELK日志分析群集
使用Logstash收集日志
使用Kibana查看分析日志
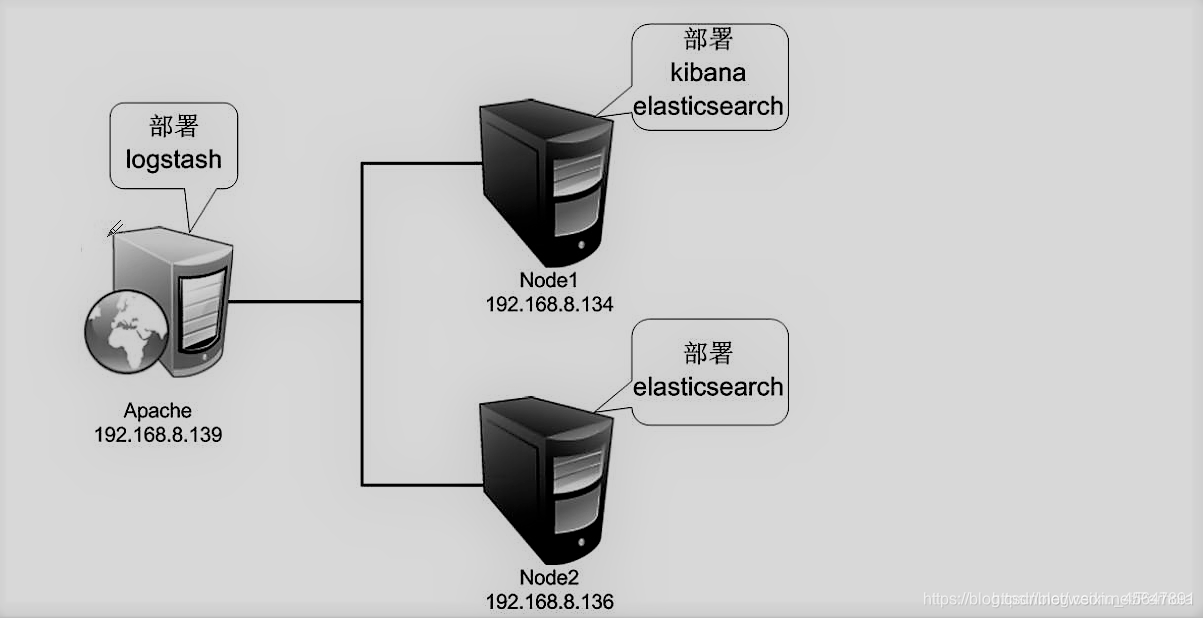
2. Equipment list
主机	操作系统	主机名/IP地址	主要软件
服务器	CentOS7-x86	node1/192.168.45.128	Elasticsearch、kibana
服务器	CentOS7-x86	node2/192.168.45.129	Elasticsearch
服务器	CentOS7-x86	apache/192.168.45.133	Logstatsh
3. Experimental topology
4. Prepare the installation environment
关闭防火墙和Selinux
Node1、Node2节点内存分配4G,Apache节点分配1G内存
通过VMware虛拟网络Vmnet8连接
Configure ES node 1 server
1. Turn off the firewall and security functions
systemctl stop firewalld.service
setenforce 0
2. Modify the hostname configuration file
vim /etc/hosts
192.168.142.152 node1
192.168.142.153 node2
3. Mount the resource package remotely
mount.cifs //192.168.142.1/elk /mnt
4. Install the software package
cd /mnt
rpm -ivh elasticsearch-5.5.0.rpm
5. Load system services
systemctl daemon-reload
6. Self-starting service at boot
systemctl enable elasticsearch.service
7. Back up configuration files
cd /etc/elasticsearch/
cp /etc/elasticsearch/elasticsearch.yml /etc/elasticsearch/elasticsearch.yml.bak
8. Modify the elasticsearch main configuration file
vim /etc/elasticsearch/elasticsearch.yml

#第17行,取消注释并修改集群名称
cluster.name: my-elk-cluster

#第23行,取消注释修改节点名字
node.name: node1

#第33行,取消注释修改数据存放路径
path.data: /data/elk_data

#第37行,取消注释修改日志存放路径
path.logs: /var/log/elasticsearch/

#第43行,取消注释并修改,取消在不启动时锁定内存
bootstrap.memory_lock: false

#第55行,取消注释并修改地址,放入所有的地址(0.0.0.0代表所有地址)
network.host: 0.0.0.0

#第59行,取消注释,放开服务端口
http.port: 9200

#第68行,取消注释修改节点名称
discovery.zen.ping.unicast.hosts: ["node1", "node2"]
9. Create a database storage path
mkdir -p /data/elk_data
10. Authorized database storage path
chown elasticsearch:elasticsearch /data/elk_data/
11. Turn on elasticsearch service
systemctl start elasticsearch.service
12. View port service status
netstat -ntap | grep 9200
tcp6       0      0 :::9200                 :::*                    LISTEN      96970/java
13. Install the compilation environment
yum install gcc gcc-c++ make -y
14. Unzip the node node software package
 cd /mnt
tar zxvf node-v8.2.1.tar.gz -C /opt
15. Placement node
cd /opt/node-v8.2.1/
./configure
16. Compile and install
make && make install
Install phantomjs front-end framework
1. Unzip the phantomjs package
cd /mnt
tar jxvf phantomjs-2.1.1-linux-x86_64.tar.bz2 -C /usr/local/src
2. Switch directory to view phantomjs command
cd /usr/local/src/phantomjs-2.1.1-linux-x86_64//bin
ls
phantomjs
3. Copy the directory to the system directory
cp phantomjs /usr/local/bin/
Install elasticsearch-head data visualization tool
1. Unzip the elasticsearch-head package
cd /mnt
tar zxvf elasticsearch-head.tar.gz -C /usr/local/src
2. Install elasticsearch-head data visualization tool
cd /usr/local/src/elasticsearch-head/
npm install
3. Modify the elasticsearch main configuration file
vim /etc/elasticsearch/elasticsearch.yml
#末行添加以下内容
http.cors.enabled: true
http.cors.allow-origin: "*"
4. Turn on the elasticsearch service
systemctl restart elasticsearch.service
5. Start background operation
npm run start &
6. View the service port status
netstat -ntap | grep 9100

tcp        0      0 0.0.0.0:9100            0.0.0.0:*               LISTEN      50105/grunt
[root@node1 elasticsearch-head]# netstat -ntap | grep 9200
tcp6       0      0 :::9200                 :::*                    LISTEN
The configuration of ES node 2 server is the same as that of node 1, repeat the above operations.
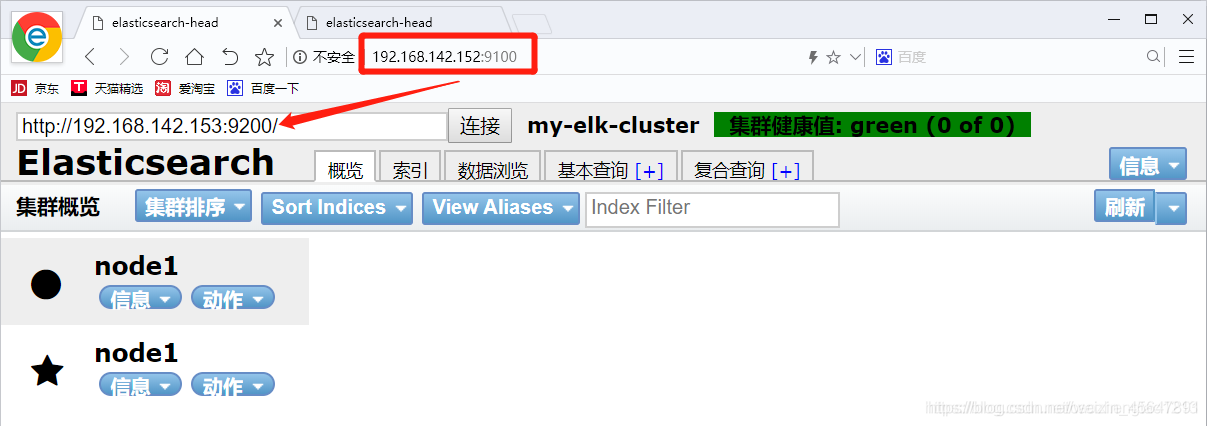
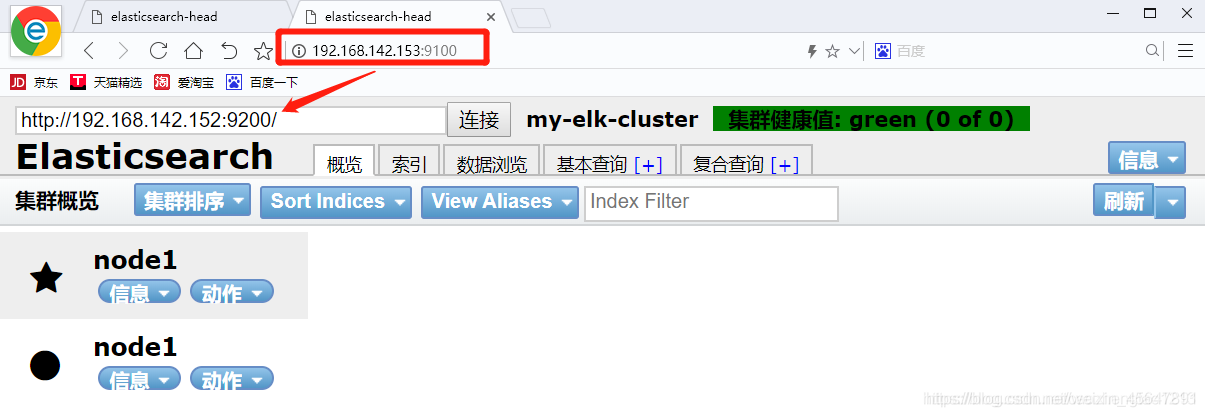
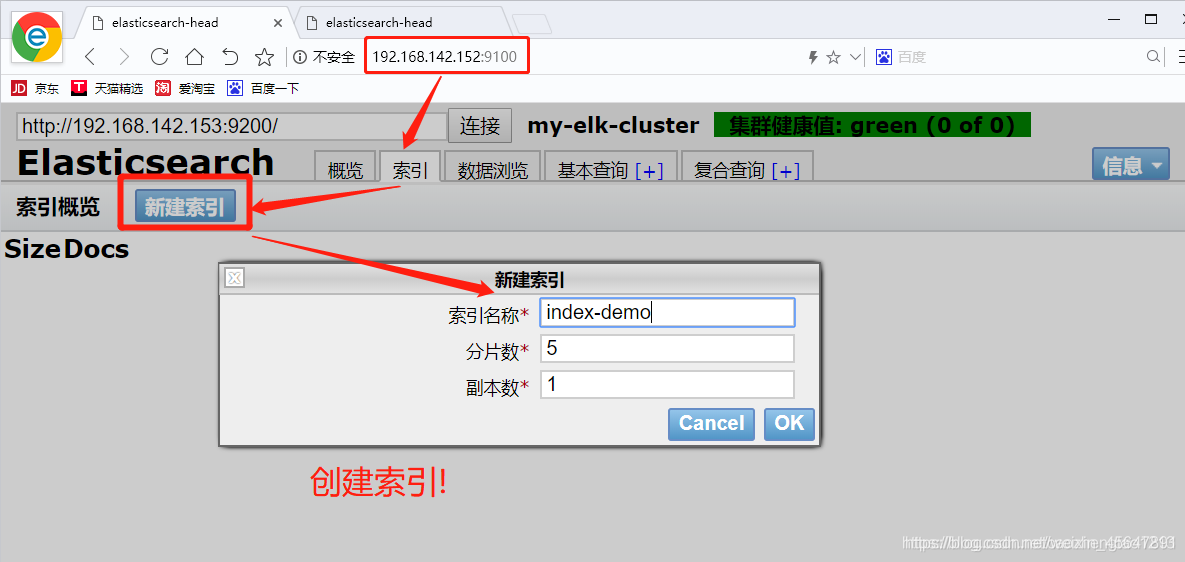
Use the browser to enter the 192.168.142.152:9100 URL and connect to the address of another node to check the cluster health status
Create index
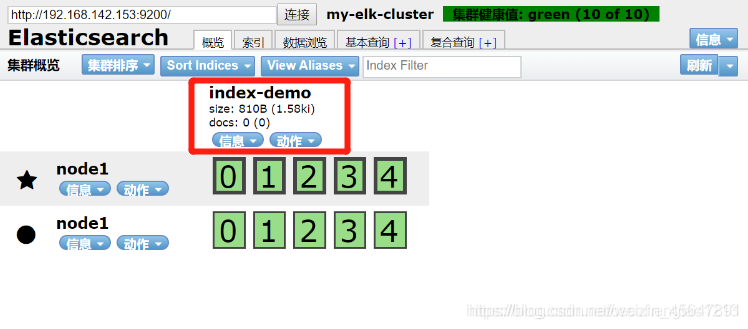
Go back to the overview to see the created index!
Configure Apache server, install logstash, collect logs
#安装Apache服务
yum install -y httpd

#远程挂载资源包
mount.cifs //192.168.142.1/elk /mnt

#切换到挂载点
cd /mnt

#安装logstash
rpm -ivh logstash-5.5.1.rpm

#开机自启动logstash服务
systemctl enable logstash.service

#启动logstash服务
systemctl start logstash.service

#建立命令软链接到系统
ln -s /usr/share/logstash/bin/logstash /usr/local/bin


#切换日志目录
cd /var/log

#授予他人读取权限
chmod o+r messages

#查看权限
ll

#切入logstash配置目录
cd /etc/logstash/conf.d/

#编辑文件
vim system.conf

#写入以下内容,用以收集系统日志
input {
        file{
        path => "/var/log/messages"
        type => "system"
        start_position => "beginning"
        }
}
output {
        elasticsearch {
		#地址指向node1节点
        hosts => ["192.168.142.152:9200"]
        index => "system-%{+YYYY.MM.dd}"
        }
}

#重启服务
systemctl restart logstash.service
Go back to node1 and install kibana
#切入挂载点
cd /mnt

#安装kibana
rpm -ivh kibana-5.5.1-x86_64.rpm

#切入kibana目录
cd /etc/kibana/

#备份kibana.yml文件
cp kibana.yml kibana.yml.bak

#修改kibana.yml文件
vim kibana.yml

#取消第2行的注释,放开5601端口
server.port: 5601

#取消第7行的注释并修改地址,放入所有的地址(0.0.0.0代表所有地址)
server.host: "0.0.0.0"

#取消第21行的注释并指向node1节点的url
elasticsearch.url: "http://192.168.142.152:9200"

#取消第30行注释,放开kibana首页
kibana.index: ".kibana"

#启动kibana服务
systemctl start kibana.service
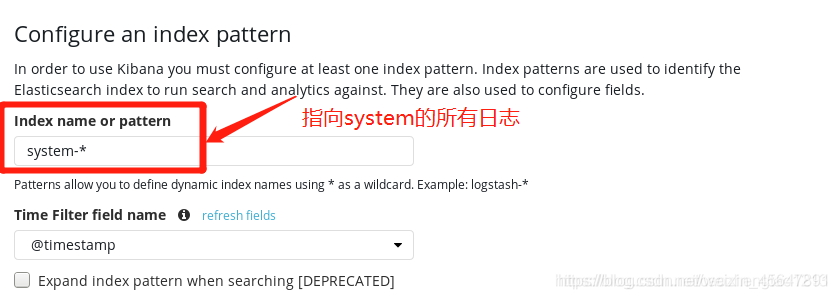
Test kibana to display log data, use a browser to access 192.168.142.152:5601
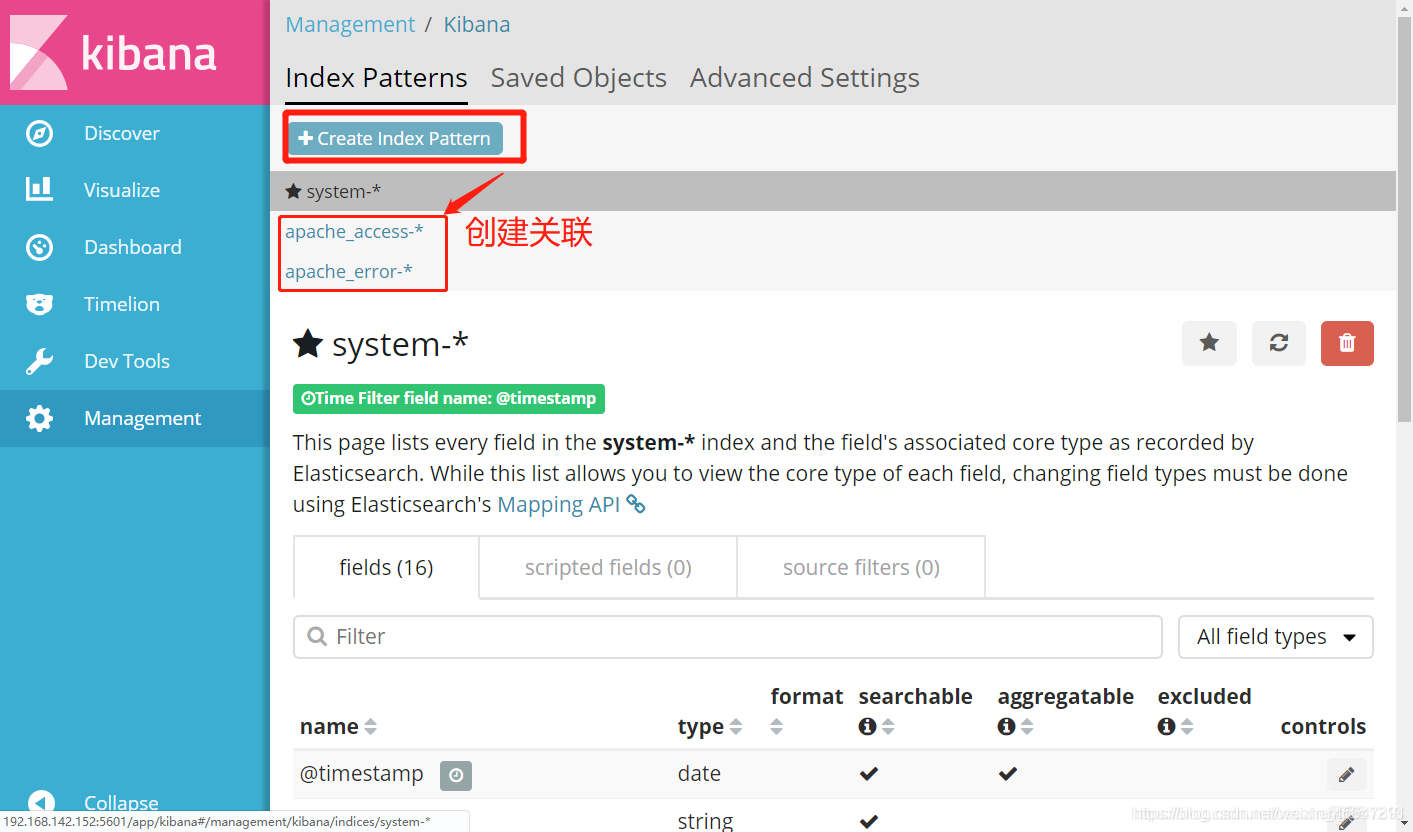
Docking with all Apache log files of the Apache host (operating on the Apache server)
#编辑Apache日志配置文件
vim apache_log.conf

input {
        file{
        path => "/etc/httpd/logs/access_log"
        type => "access"
        start_position => "beginning"
        }
        file{
        path => "/etc/httpd/logs/error_log"
        type => "error"
        start_position => "beginning"
        }
}
output {
        if [type] == "access" {
        elasticsearch {
        hosts => ["192.168.142.152:9200"]
        index => "apache_access-%{+YYYY.MM.dd}"
        }
    }
        if [type] == "error" {
        elasticsearch {
        hosts => ["192.168.142.152:9200"]
        index => "apache_error-%{+YYYY.MM.dd}"
        }
    }
}


#重启服务,稍等片刻!
logstash -f apache_log.conf
Test Apache log information display