Table of contents
1.3 Additional components can be added
1.4 Filebeat combined with logstash brings benefits
2.2 Elasticsearch core concept
2.2.2cluster cluster, ES is a distributed system
2.2.3 Node node is a server in the cluster
2.2.7 Shards and replicas (shards & replicas)
3.2 Main components in Logstash
7.2Elasticsearch cluster deployment (operation on Node1)
7.3 Install Elasticsearch software
7.4 Configuring the Elasticsearch main configuration file
7.5 Create data storage path and authorize
7.6 View node1 node information
8. Elasticsearch cluster deployment (operation on Node2)
8.1 The previous steps are consistent with the node1 node
8.2 Upload the configuration file to the node2 node on the node1 node
8.3 Modify the configuration file (node2)
8.4 Create data storage path and authorize
8.5 Check the information of node2 node
Nine. Install the Elasticsearch-head plugin
9.3 Install Elasticsearch-head data visualization tool
9.4 Modify the Elasticsearch main configuration file
9.5 Modify the Gruntfile.js configuration file and app.js configuration file
9.6 Start elasticsearch-head service
9.7 View Elasticsearch information through Elasticsearch-head
Ten. Logstash deployment (operate on client node: 192.168.40.170)
Common options for Logstash commands
Define input and output streams
Eleven defines the logstash configuration file
11.1 The Logstash configuration file basically consists of three parts (choose to use as needed)
11.2 Modify the Logstash configuration file
11.4. Browser verification, view index informationEdit
12. Kibana deployment (Node1 node)
12.2 Setting up kibana's main configuration file
1. Introduction to ELK
1.1 Overview of ELK
- ELK is the collective name of the three software, that is, the abbreviation of the three open source software of Elasticsearch, Logstash and Kibana . These three pieces of software are all open source software, usually used together, and have been attributed to the Elastic.co enterprise, so they are referred to as the ELK protocol stack. ELK is mainly used to deploy in the enterprise architecture, collect log information of multiple services on multiple devices, and provide them to users after unified integration. It can search, analyze and visualize logs from any source and in any format.
1.2 Composition of ELK
In the ELK architecture, the three software functions of Elasticsearch, Logstash and Kibana are as follows:
1.2.1 ElasticSearch
- It is a distributed storage search engine developed based on Lucene (a full-text search engine architecture) and used to store various logs.
- Elasticsearch is developed in Java and can communicate with Elasticsearch through a RESTful web interface through a browser.
- Elasticsearch is a real-time, distributed, scalable search engine that allows full-text, structured searches. It is typically used to index and search large volumes of log data, and can also be used to search many different types of documents.
1.2.2 Logstash
- Logstash: as a data collection engine . It supports dynamic collection of data from various data sources, and performs operations such as filtering, analyzing, enriching, and unifying the format on the data, and then stores it in a location specified by the user, and generally sends it to Elasticsearch.
- Logstash is written in Ruby language and runs on the Java Virtual Machine (JVM). It is a powerful data processing tool that can realize data transmission, format processing, and format output. Logstash has a powerful plug-in function, which is often used for log processing.
1.2.3 Kibana
- Kiabana: Kibana is usually deployed together with Elasticsearch. Kibana is a powerful data visualization Dashboard for Elasticsearch. Kibana provides a graphical web interface to browse Elasticsearch log data, which can be used to summarize, analyze and search for important data.
1.2.4 Summary
- Logstash (log collection) : mainly used to collect, output, and format data
- Elasticsearch (log storage and search) : used for indexing, because of its copy and fragmentation, its search ability is very strong
- Kibana (display) : As a display, it is a data analysis and visualization platform. After the log is collected, the index is created by es, and finally passed to kibana, and displayed through kibana. His compatibility is very good.
1.3 Additional components can be added
- Filebeat: A lightweight open source log file data collector. Usually, Filebeat is installed on the client that needs to collect data, and the directory and log format are specified. Filebeat can quickly collect data and send it to logstash for analysis, or directly to Elasticsearch storage. Compared with logstash running on the JVM in terms of performance It has obvious advantages and is an alternative to it. Often used in the EFLK architecture.
1.4 Filebeat combined with logstash brings benefits
- Through Logstash has a disk-based adaptive buffering system that will absorb incoming throughput, relieving Elasticsearch of the pressure of continuously writing data
- Extract from other data sources such as databases, S3 object stores, or messaging queues
- Send data to multiple destinations such as S3, HDFS (Hadoop Distributed File System) or write to a file
- Use conditional dataflow logic to compose more complex processing pipelines
-
Cache/message queue (redis, kafka, RabbitMQ, etc.): Traffic peak clipping and buffering can be performed on highly concurrent log data. Such buffering can protect data from loss to a certain extent, and can also decouple the application of the entire architecture .
-
Fluentd: is a popular open source data collector. Due to the shortcomings of logstash being too heavyweight, Logstash's low performance and high resource consumption, Fluentd appeared later. Compared with logstash, Fluentd is easier to use, consumes less resources, has higher performance, and is more efficient and reliable in data processing. It is welcomed by enterprises and has become an alternative to logstash, and is often used in the EFK architecture. EFK is also often used as a solution for log data collection in Kubernetes clusters.
Fluentd is generally run through a DaemonSet in a Kubernetes cluster so that it can run a Pod on each Kubernetes worker node. It works by taking container log files, filtering and transforming the log data, and then passing the data to an Elasticsearch cluster where it is indexed and stored.
1.5 Steps of log processing
- Centrally manage the logs of APP servers to Logstash agent.
- Format the log (Logstash) and output it to the Elasticsearch cluster
- Index and store formatted data (Elasticsearch)
- Display of front-end data (Kibana)
- The interface display can be viewed online.
- Summary: logstash, as a log collector, collects data from data sources, filters and formats the data, and then stores it in Elasticsearch, and kibana visualizes the logs.
二.Elasticsearch
2.1 Overview of Elasticsearch
- It is a distributed multi-user capable full-text search engine
2.2 Elasticsearch core concept
2.2.1 Near real-time (NRT)
elasticsearch是一个接近实时的搜索平台,这意味着,从索引一个文档直到这个文档能够被搜索到有一个轻微的延迟(通常是1秒)
2.2.2cluster cluster, ES is a distributed system
A cluster is organized by one or more nodes, which jointly hold your entire data and provide indexing and search functions together. One of the nodes is the master node, which can be elected through elections and provides joint indexing and search functions across nodes. The cluster has a uniquely marked name, the default is elasticsearch, the cluster name is very important, each node is added to its cluster based on the cluster name. Therefore, make sure to use different cluster names in different environments.
—A cluster can have only one node. It is strongly recommended to configure elasticsearch in cluster mode. es has a cluster mechanism, nodes join the cluster through the cluster name, and the nodes in the cluster will have their own unique identity (own name)
2.2.3 Node node is a server in the cluster
A node is a single server, part of a cluster, that stores data and participates in the cluster's indexing and search functions. Like clusters, nodes are identified by name, which defaults to a character name randomly assigned at node startup. Of course, you can define it yourself. The name is also important, used to identify the node corresponding to the server in the cluster.
Nodes can be added to a cluster by specifying the cluster name. By default, each node is set to join the elasticsearch cluster. If multiple nodes are started, assuming they can automatically discover each other, they will automatically form a cluster called elasticsearch.
2.2.4 index index
An index is a collection of documents with somewhat similar characteristics. For example, you could have an index for customer data, an index for product catalogs, and an index for order data. An index is identified by a name (must be all lowercase letters), and when we want to index, shrink, update and delete documents in the corresponding index, we will use this name. In a cluster, multiple indexes can be defined. (Indexes are relative to relational database libraries)
ps: The type is relative to the table of the relational database-"index (library)-"type (table)-"document (record)
2.2.5 Type (type)
Type (type) In an index, you can define one or more types. A type is a logical categorical partition of your index, the meaning of which is entirely up to you to define. Typically, a type is defined for documents with a common set of fields. For example: We assume that we operate a blogging platform and store all data in an index. In this index, you can define a type for user data, a type for blog data, and another type for comment data. (The type is relative to the table of the relational database)
2.2.6 document (document)
The document is the final data, and a document can be considered as a record. It is the smallest data unit in ES, just like a piece of data in a table
2.2.7 Shards and replicas (shards & replicas)
In practical cases, the data stored by the index may exceed the hardware limit of a single node. For example, a 1 billion document requiring 1TB space may not fit on a single node's disk or a search request from a single node is too slow. To solve this problem, elasticsearch provides the function of dividing the index into multiple shards. When creating an index, you can define the number of shards you want. Each shard is a fully functional independent index that can reside on any node in the cluster.
三.Logstash
3.1 Overview of Logstash
- A powerful data processing tool
- It can realize data transmission, format processing and format output
- Data input (from business input), data processing (such as filtering, rewriting, etc.) and data output (output to Elasticsearch cluster)
3.2 Main components in Logstash
- shipper : The log collector, responsible for monitoring the changes of the local log files, and collecting the latest contents of the log files in time. Usually, the remote agent only needs to run this component
- indexer : log storage, responsible for receiving logs and writing them to local files
- broker : log hub, responsible for connecting multiple shippers and multiple indexers
- search and storage : Allows searching and storage of events
- web interface : Web-based display interface
4.Kibana
4.1 Overview of Kibana
- An open source analysis and visualization platform for Elasticsearch;
- Search to view data stored in the Elasticsearch index;
- Advanced data analysis and display through various icons;
- Make massive amounts of data easier to understand;
- The operation is simple, and the browser-based user interface can quickly create a dashboard (dashboard) to display in real time
- Elasticsearch query dynamics;
- Setting up and installing Kibana is very simple, without writing code, you can complete Kibana installation and start Elasticsearch monitoring in a few minutes.
4.2 Main functions of Kibana
- Elasticsearch seamless integration . The Kibana architecture is customized for Elasticsearch, and any structured and unstructured data can be added to the Elasticsearch index. Kibana also takes full advantage of Elasticsearch's powerful search and analysis capabilities.
- Integrate data : Kibana is better able to handle large volumes of data and create column charts, line charts, scatterplots, histograms, pie charts, and maps from them.
- Complex data analysis : Kibana has improved Elasticsearch's analysis capabilities, which can analyze data more intelligently, perform mathematical transformations, and split data into blocks according to requirements.
- Benefit more team members : The powerful database visualization interface enables all business positions to benefit from data collection.
- Flexible interface and easier sharing: Using Kibana can create, save, and share data more conveniently, and quickly communicate visual data.
- Simple configuration : The configuration and activation of Kibana is very simple, and the user experience is very friendly. Kibana comes with its own web server and can be up and running quickly.
- Visualize multiple data sources : Kibana can easily integrate data from Logstash, ES-Hadoop, Beats, or third-party technologies into Elasticsearch. The supported third-party technologies include Apache Flume, Fluentd, etc.
- Simple data export : Kibana can easily export the data of interest, combine it with other data, and then quickly model and analyze it to discover new results.
5. Advantages of ELK
- The processing method is flexible. Elasticsearch is a full-text index with powerful search capabilities .
- Configuration is relatively simple . The configuration of Kibana is very simple, Elasticsearch uses Json interfaces all, and the configuration is not complicated. The configuration of Logstash uses modules, and the configuration is relatively simple.
- High retrieval performance . The ELK architecture can usually achieve second-level response to queries of tens of billions of data.
- The cluster scales linearly. Elasticsearch itself has no concept of a single point, the automatic default cluster mode, both Elasticsearch and Logstash can
- Flexible expansion.
- The pages are beautiful . Kibana's front-end design is beautiful and easy to operate.
6. Working principle of ELK
- Deploy Logstash on all servers that need to collect logs; or centralize the management of logs on the log server first, and deploy Logs tash on the log server.
- Logstash collects logs, formats them and outputs them to an Elasticsearch cluster.
- Elasticsearch indexes and stores formatted data.
- Kibana queries data from ES clusters to generate graphs and displays front-end data.
Seven. ELK cluster deployment
7.1 Environment preparation
| server type | IP address | installed components |
| node1 | 192.168.40.16 | Elasticsearch、Kibana |
| node2 | 192.168.40.17 | Elasticsearch |
| client node | 192.168.40.170 | logstash, Apache (for testing) |
ps注意:这里做实验前需要注意要把服务器内存调成4G以上,不然会报错7.2Elasticsearch cluster deployment (operation on Node1)
#关闭防火墙
systemctl stop firewalld.service
setenforce 0
#更改主机名
Node1节点:hostnamectl set-hostname node1
Node2节点:hostnamectl set-hostname node2
#配置域名解析
echo "192.168.40.16" node1 >>/etc/hosts
echo "192.168.40.17" node2 >>/etc/hosts
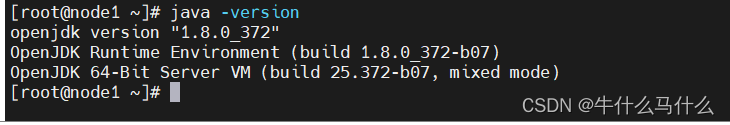
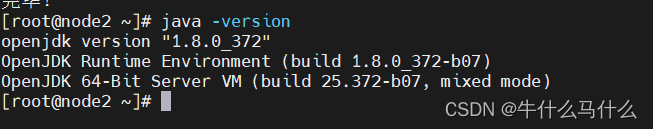
#查看Java环境,如果没有安装,yum -y install java
java -version 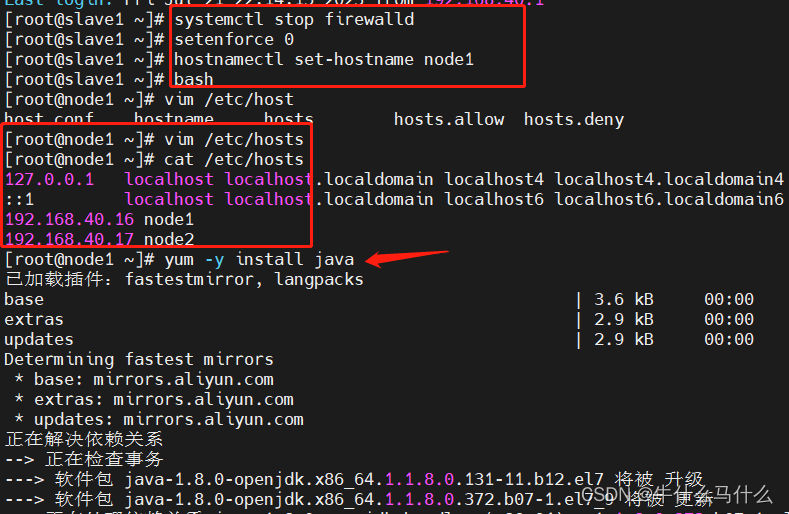
7.3 Install Elasticsearch software
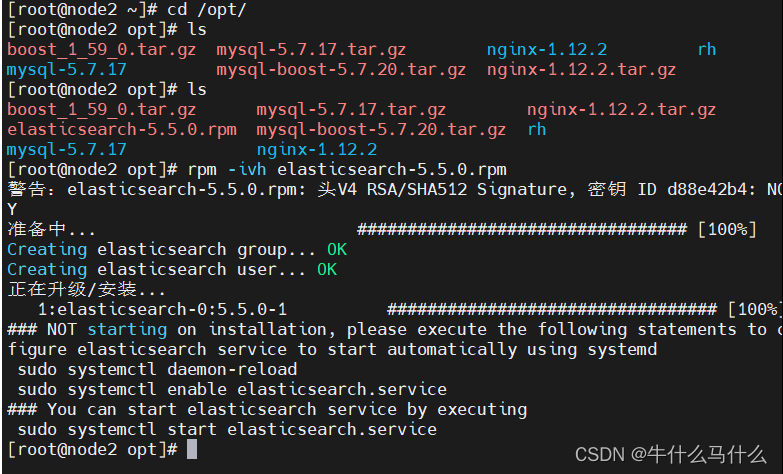
上传elasticsearch-5.5.0.rpm到/opt目录下
cd /opt
rpm -ivh elasticsearch-5.5.0.rpm

加载系统服务
systemctl daemon-reload
systemctl enable elasticsearch.service
cd /etc/elasticsearch/
cp elasticsearch.yml elasticsearch.yml.bak
7.4 Configuring the Elasticsearch main configuration file
修改elasticsearch主配置文件
vim /etc/elasticsearch/elasticsearch.yml
--17--取消注释,指定集群名字
cluster.name: liy
--23--取消注释,指定节点名字:Node1节点为node1,Node2节点为node2
node.name: node1
--33--取消注释,指定数据存放路径
path.data: /data/elk_data
--37--取消注释,指定日志存放路径
path.logs: /var/log/elasticsearch/
--43--取消注释,改为在启动的时候不锁定内存
bootstrap.memory_lock: false
--55--取消注释,设置监听地址,0.0.0.0代表所有地址
network.host: 0.0.0.0
--59--取消注释,ES 服务的默认监听端口为9200
http.port: 9200
--68--取消注释,集群发现通过单播实现,指定要发现的节点 node1、node2
discovery.zen.ping.unicast.hosts: ["node1", "node2"]

#查看主配置文件
grep -v "^#" /etc/elasticsearch/elasticsearch.yml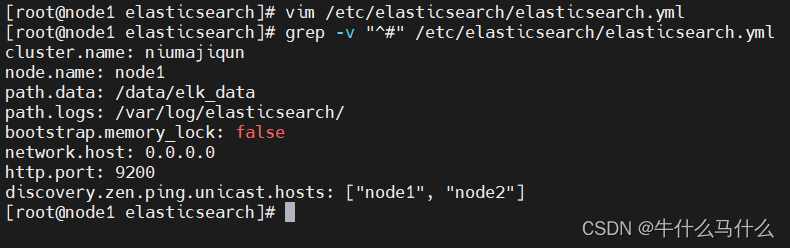
7.5 Create data storage path and authorize
#创建数据存放路径并授权
mkdir -p /data/elk_data
chown elasticsearch:elasticsearch /data/elk_data/
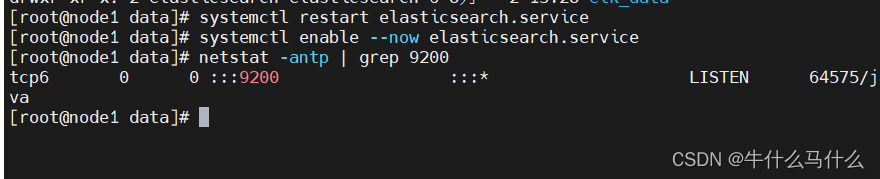
#启动elasticsearch是否成功开启
systemctl start elasticsearch.service
systemctl enable --now elasticsearch.service
netstat -antp | grep 9200
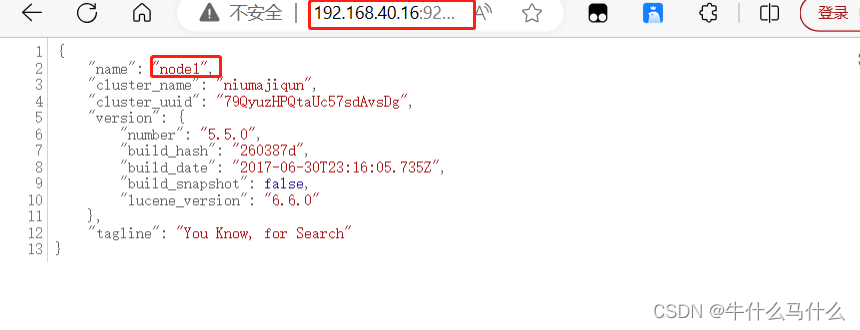
#查看节点信息
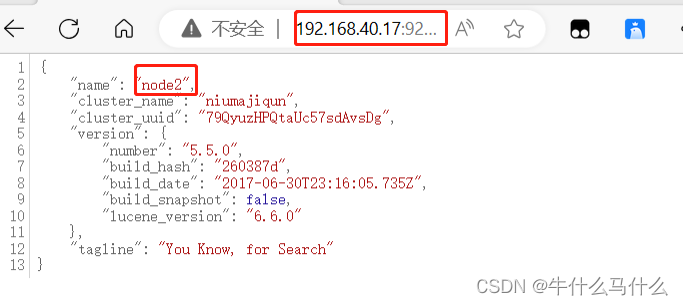
浏览器访问 ,查看节点 Node1 的信息
http://192.168.40.16:9200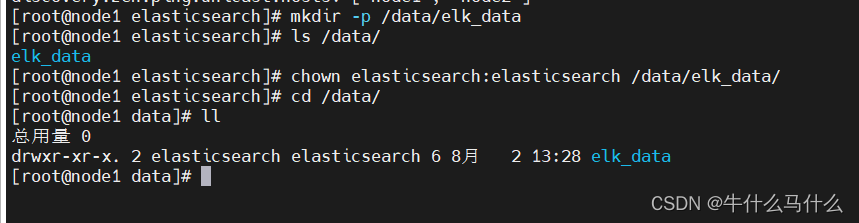
7.6 View node1 node information
green
http://192.168.40.16:9200/_cluster/health?pretty
#######  使用以上方式查看状态并不友好,可以通过 elasticsearch-head插件来直接管理  #####
8. Elasticsearch cluster deployment (operation on Node2)
8.1 The previous steps are consistent with the node1 node

8.2 Upload the configuration file to the node2 node on the node1 node
scp /etc/elasticsearch/elasticsearch.yml [email protected]:/etc/elasticsearch/
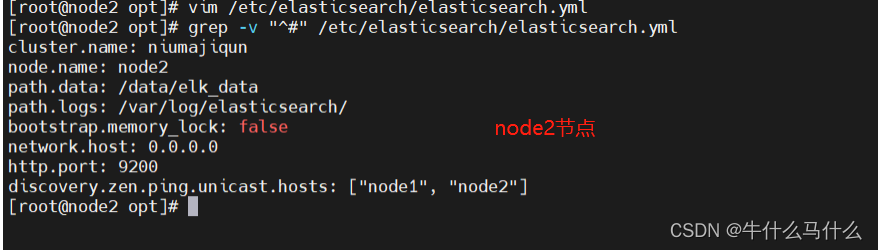
8.3 Modify the configuration file (node2)
vim /etc/elasticsearch/elasticsearch.yml
grep -v "^#" /etc/elasticsearch/elasticsearch.yml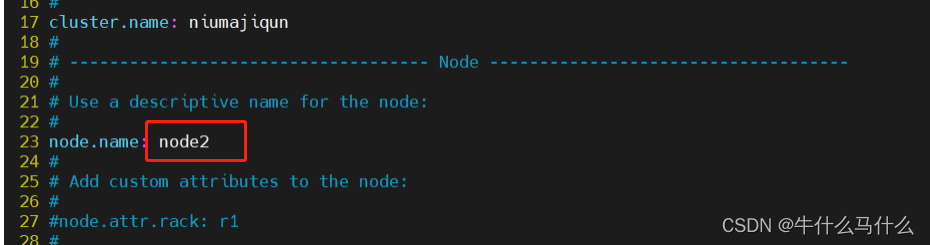
8.4 Create data storage path and authorize
mkdir -p /data/elk_data
chown elasticsearch:elasticsearch /data/elk_data/
systemctl daemon-reload
systemctl enable --now elasticsearch.service
systemctl start elasticsearch
netstat -antp | grep 9200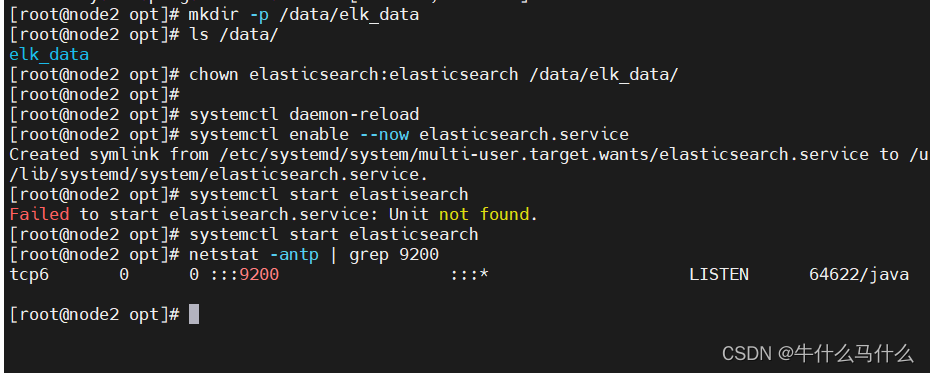
8.5 Check the information of node2 node
Nine. Install the Elasticsearch-head plugin
- After the es service is started, the access interface is rather ugly. In order to better view the information in the index library, we can install the elasticsearch-head plug-in. This plug-in can see the es management interface more conveniently and quickly.
Elasticsearch 在 5.0 版本后,Elasticsearch-head 插件需要作为独立服务进行安装,需要使用npm工具(NodeJS的包管理工具)安装。
安装 Elasticsearch-head 需要提前安装好依赖软件 node 和 phantomjs。
node:是一个基于 Chrome V8 引擎的 JavaScript 运行环境。
phantomjs:是一个基于 webkit 的JavaScriptAPI,
可以理解为一个隐形的浏览器,任何基于 webkit 浏览器做的事情,它都可以做到。
9.1 Compile and install node1
上传软件包 node-v8.2.1.tar.gz 到/opt
yum install gcc gcc-c++ make -y

cd /opt
tar zxvf node-v8.2.1.tar.gz

cd node-v8.2.1/
./configure
make -j4 && make install        #时间比较久,请耐心等待
9.2 Install phantomjs (node1)
#上传软件包 phantomjs-2.1.1-linux-x86_64.tar.bz2 到

cd /opt

tar jxvf phantomjs-2.1.1-linux-x86_64.tar.bz2 -C /usr/local/src/

cd /usr/local/src/phantomjs-2.1.1-linux-x86_64/bin

cp phantomjs /usr/local/bin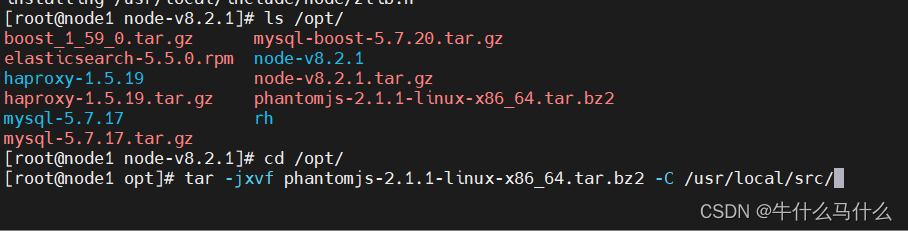

9.3 Install Elasticsearch-head data visualization tool
#安装 Elasticsearch-head 数据可视化工具
#上传软件包 elasticsearch-head.tar.gz 到/opt

cd /opt
tar zxvf elasticsearch-head.tar.gz -C /usr/local/src/
cd /usr/local/src/elasticsearch-head/
npm install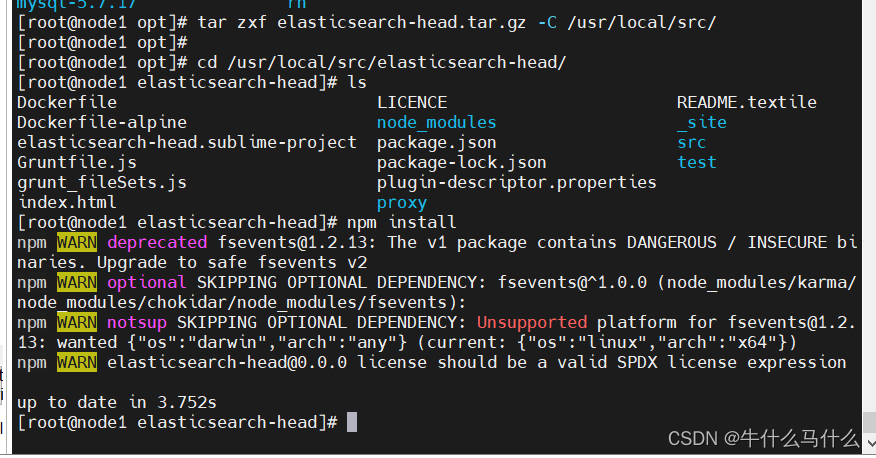
9.4 Modify the Elasticsearch main configuration file
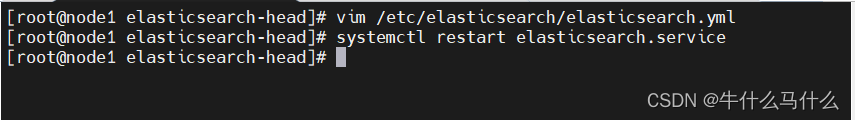
#修改 Elasticsearch 主配置文件
vim /etc/elasticsearch/elasticsearch.yml
......
--末尾添加以下内容--
http.cors.enabled: true				#开启跨域访问支持,默认为 false
http.cors.allow-origin: "*"			#指定跨域访问允许的域名地址为所有
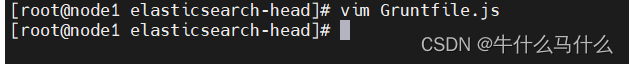
9.5 Modify the Gruntfile.js configuration file and app.js configuration file

9.6 Start elasticsearch-head service
#必须在解压后的 elasticsearch-head 目录下启动服务,进程会读取该目录下的 gruntfile.js 文件,否则可能启动失败。
cd /usr/local/src/elasticsearch-head/node_modules/grunt/bin
./grunt server

 netstat -anput |grep 9100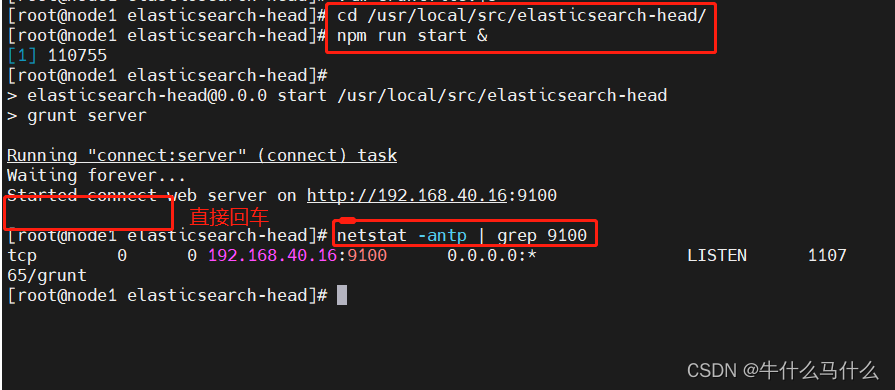
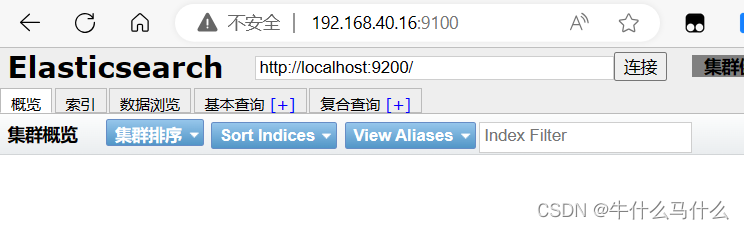
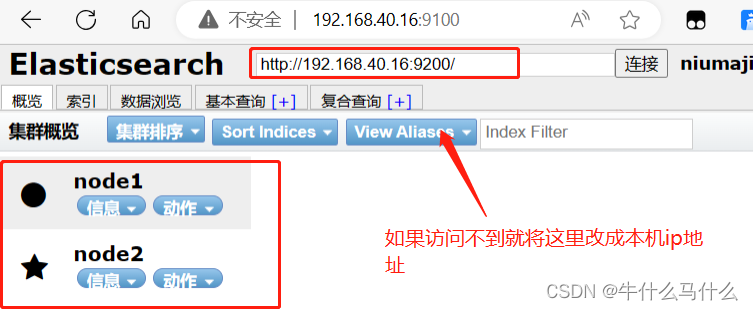
9.7 View Elasticsearch information through Elasticsearch-head
- Browser access http://192.168.40.16:9100/ address and connect to the cluster. If you see the cluster health value is green, it means the cluster is healthy.
9.8 Insert index and test
(7)#插入索引
##登录192.168.40.16 node1主机#####  索引为index-demo,类型为test,可以看到成功创建

curl -X PUT 'localhost:9200/index-demo/test/1?pretty&pretty' -H 'content-Type: application/json' -d '{"user":"hello","mesg":"haha oooo"}'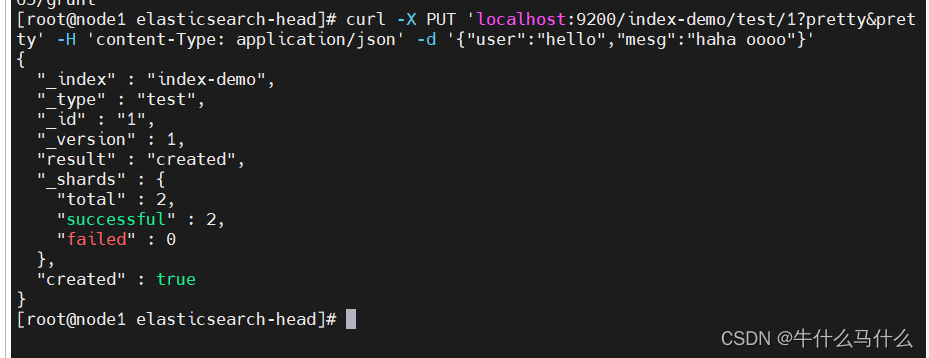
 浏览器访问 http://192.168.40.16:9100/ 查看索引信息,可以看见索引默认被分片5个,并且有一个副本。
 点击“数据浏览”,会发现在node1上创建的索引为 index-demo,类型为 test 的相关信息。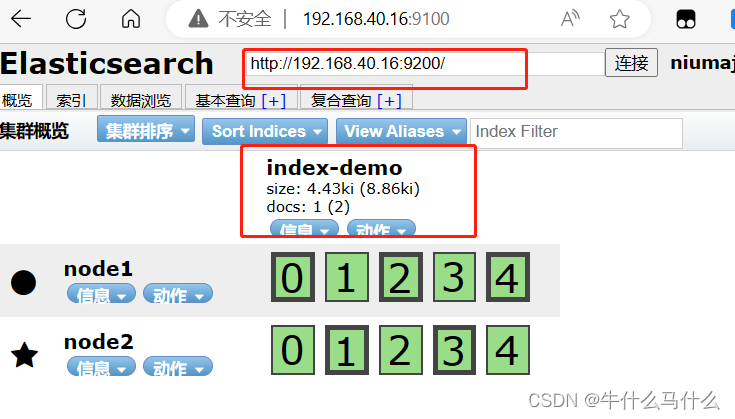
Ten. Logstash deployment (operate on client node: 192.168.40.170)
- Logstash is generally deployed on servers whose logs need to be monitored. In this case, Logstash is deployed on the Apache server to collect the log information of the Apache server and send it to Elasticsearch.
10.1 Install Logstash
#修改主机名
hostnamectl set-hostname client
bash
#安装httpd并启动
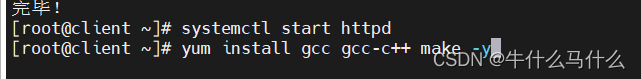
yum -y install httpd
systemctl start httpd
#查看java环境
java -version
#安装logstash
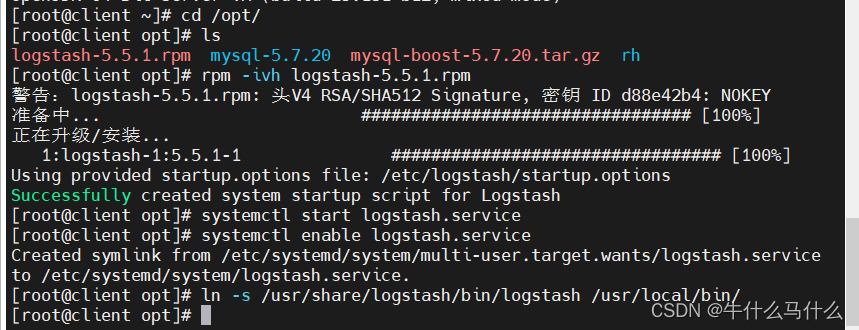
cd /opt
rpm -ivh logstash-5.5.1.rpm
systemctl start logstash.service
systemctl enable logstash.service
#创建软连接
ln -s /usr/share/logstash/bin/logstash /usr/local/bin/
10.2 Testing Logstash
Common options for Logstash commands
Logstash这个命令测试

-f:通过这个选项可以指定 Logstash 的配置文件,根据配置文件配置 Logstash 的输入和输出流。

-e:从命令行中获取,输入、输出后面跟着字符串,
该字符串可以被当作 Logstash 的配置(如果是空,则默认使用 stdin 作为输入,stdout 作为输出)。

-t:测试配置文件是否正确,然后退出。

logstash -f  配置文件名字      去连接elasticsearch
Define input and output streams
The input adopts standard input, and the output adopts standard output (similar to pipeline)
to specify the data input port, the default is 9600~9700
#输入采用标准输入 输出采用标准输出---登录192.168.40.170在client服务器上
logstash -e 'input { stdin{} } output { stdout{} }'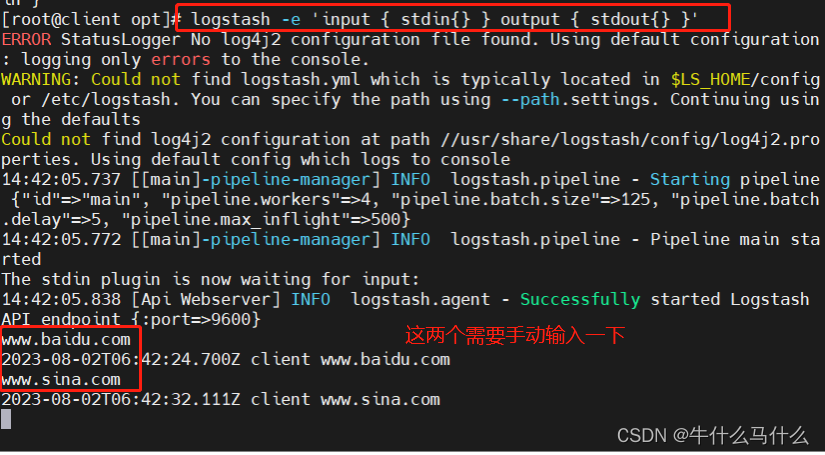
Use rubydebug to output detailed format display, codec is a codec
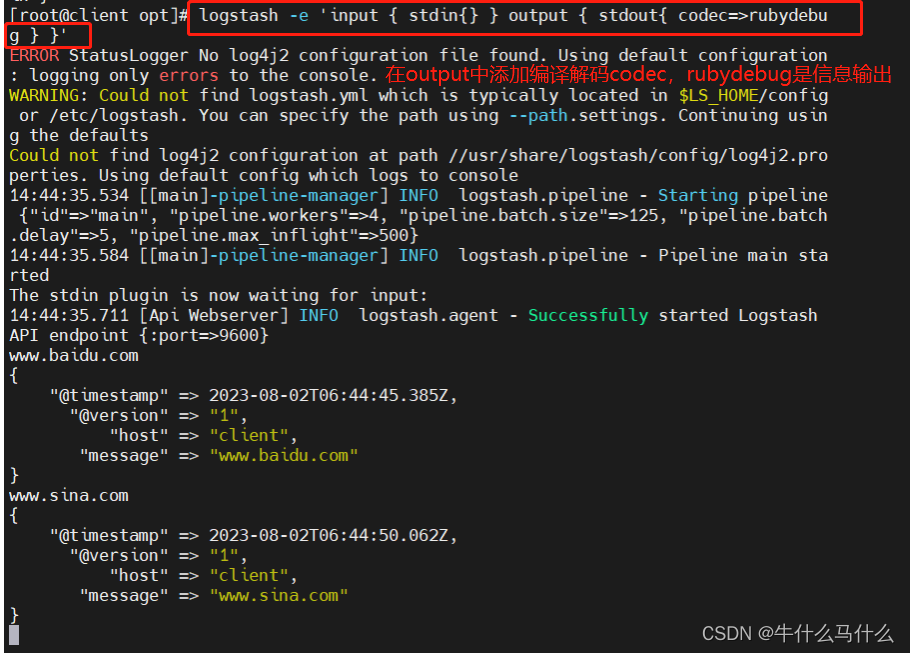
Among them, the yellow font means that the timestamp, version, local name, and information will be output
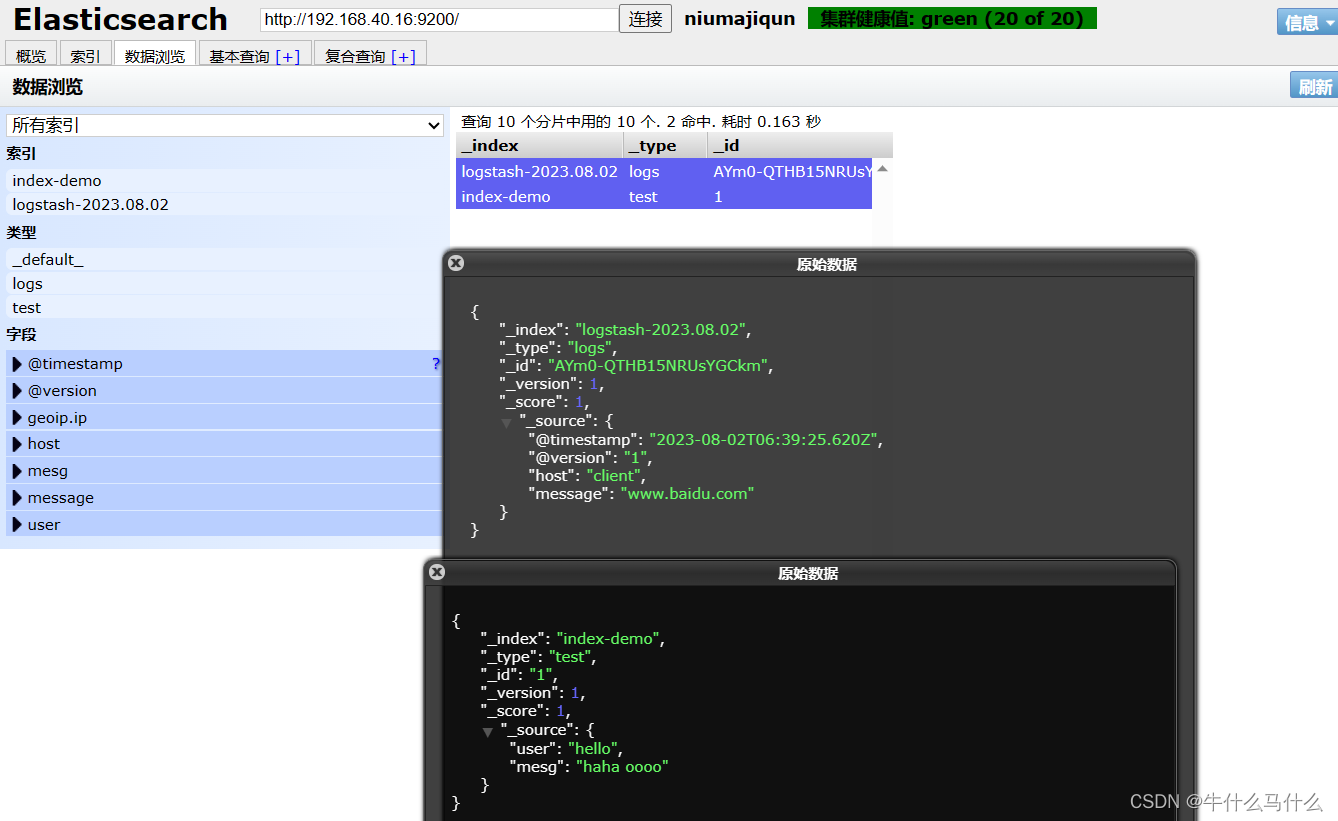
Write information to Elasticsearch using Logstash
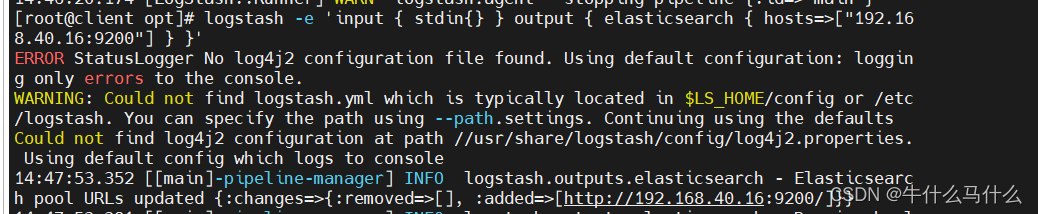
The results are not displayed on the standard output, but are sent to Elasticsearch, and the browser can visit http://192.168.40.16:9100/ to view index information and data browsing
Eleven defines the logstash configuration file
11.1 The Logstash configuration file basically consists of three parts (choose to use as needed)
- input: Indicates collecting data from data sources, common data sources such as Kafka, log files, etc.
- filter: Indicates the data processing layer, including data formatting, data type conversion, data filtering, etc., and supports regular expressions
- output: Indicates that the data collected by Logstash is processed by the filter and then output to Elasticsearch.
11.2 Modify the Logstash configuration file
- Modify the Logstash configuration file to collect system logs /var/log/messages and output them to elasticsearch

11.3 Configure logstash file
#修改 Logstash 配置文件,让其收集系统日志/var/log/messages,并将其输出到 elasticsearch 中。
#文件必须以.conf格式结尾
cd /etc/logstash/
cd conf.d/
ls
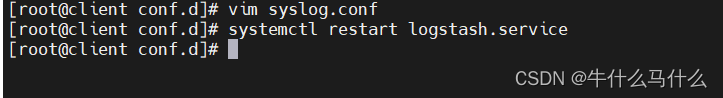
vim syslog.conf
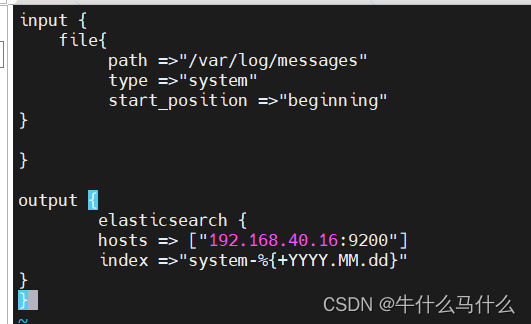
input {
file{
path =>"/var/log/messages" #指定要收集的日志的位置
type =>"system" #自定义日志类型标识
start_position =>"beginning" #表示从开始处收集
}
}
output {
elasticsearch { #输出到 elasticsearch
hosts => ["192.168.40.16:9200"] #指定 elasticsearch 服务器的地址和端口
index =>"system-%{+YYYY.MM.dd}" #指定输出到 elasticsearch 的索引格式
}
}
#重启服务
systemctl restart logstash
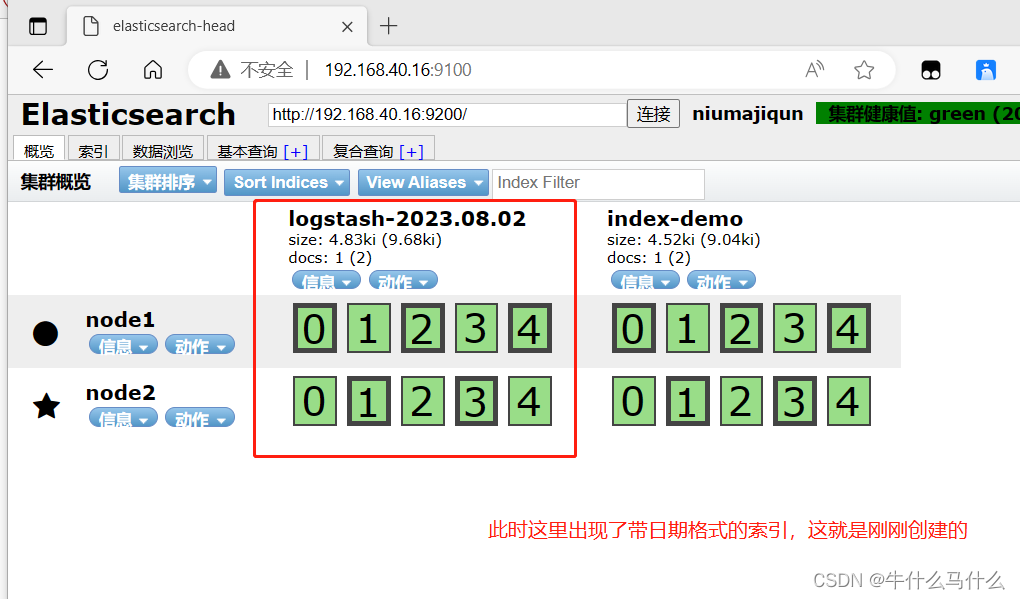
#打开浏览器 输入http://192.168.40.16:9100/ 查看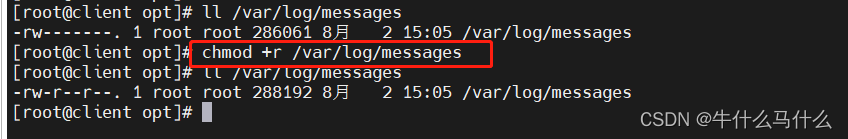
11.4. Browser verification, view index information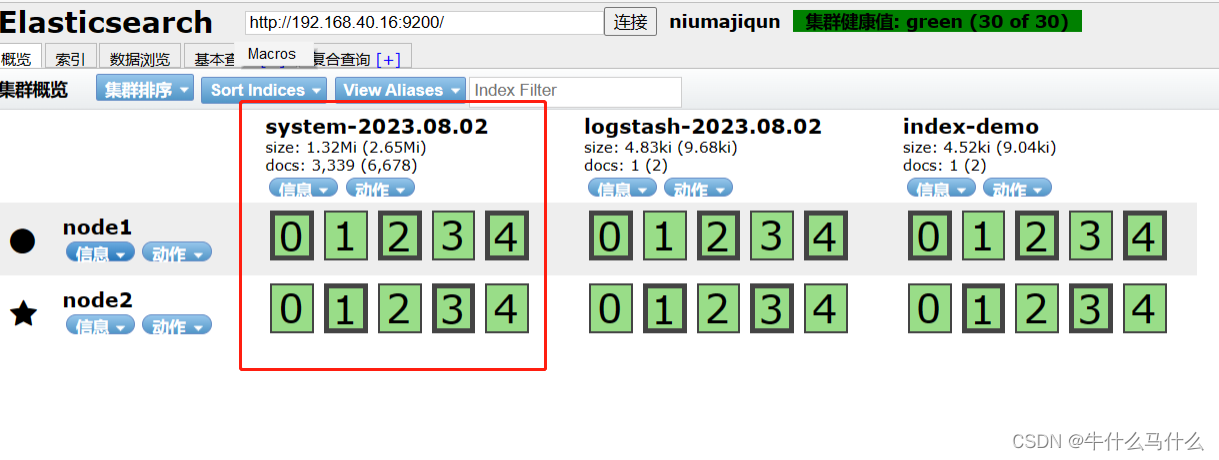
You can see that there are a lot of system log information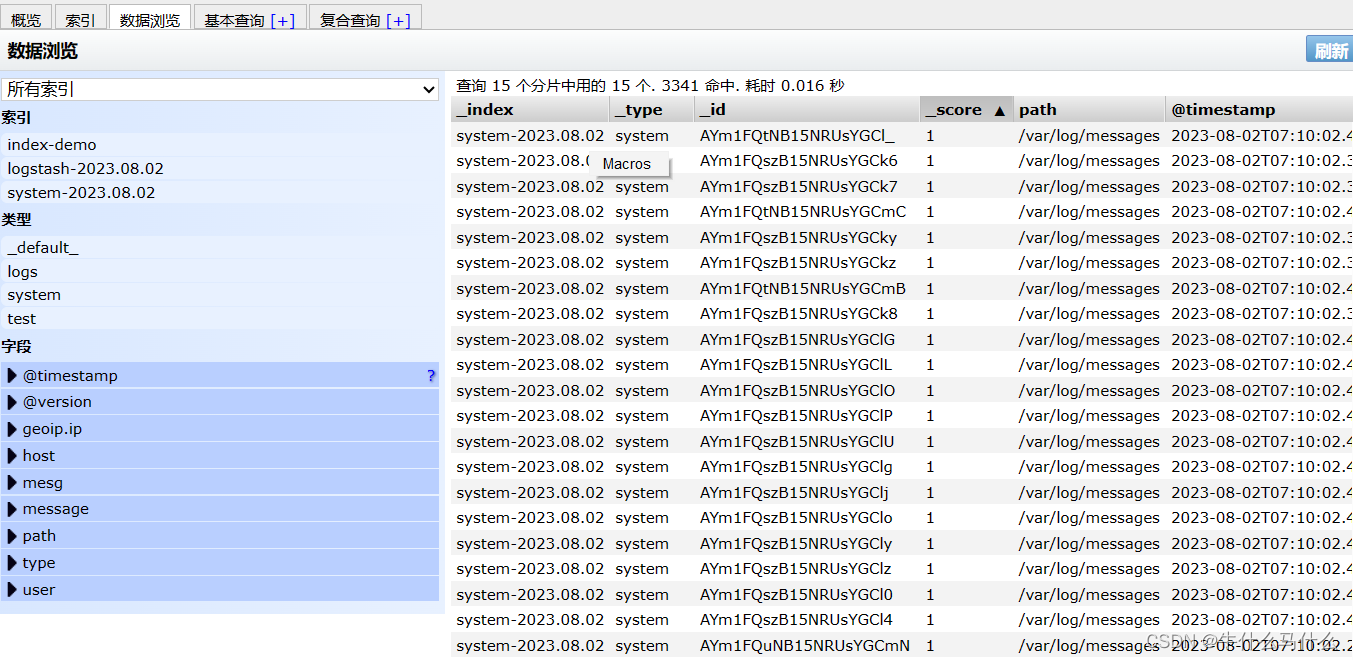
You can see that there is a lot of information, but it is not easy to filter the information, so we will install kiabana next
12. Kibana deployment (Node1 node)
- This service only needs to be deployed on one server in the ES cluster
12.1 Install Kibana
#安装 Kiabana
#上传软件包 kibana-5.5.1-x86_64.rpm 到/opt目录
cd /opt/
rz
rpm -ivh kibana-5.5.1-x86_64.rpm 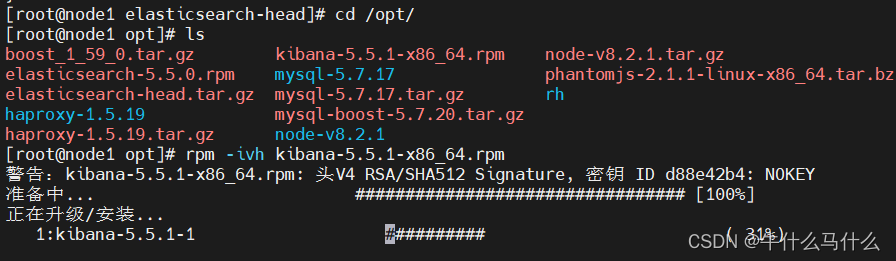
12.2 Setting up kibana's main configuration file
#设置 Kibana 的主配置文件
vim /etc/kibana/kibana.yml

--2--取消注释,Kiabana 服务的默认监听端口为5601
server.port: 5601
--7--取消注释,设置 Kiabana 的监听地址,0.0.0.0代表所有地址
server.host: "0.0.0.0"
--21--取消注释,设置和 Elasticsearch 建立连接的地址和端口
elasticsearch.url: "http://192.168.40.16:9200"
--30--取消注释,设置在 elasticsearch 中添加.kibana索引
kibana.index: ".kibana"
12.3 Start kibana service
systemctl daemon-reload
systemctl start kibana.service
systemctl enable kibana.service
netstat -antp | grep 5601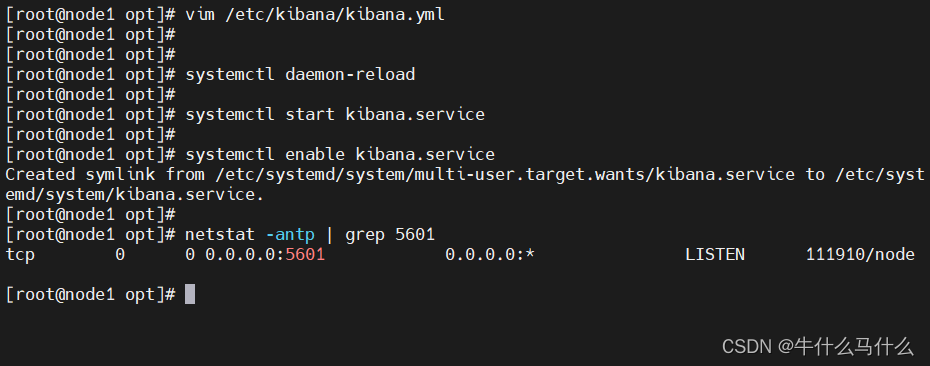 12.4 Verify Kibana
- Browser access http://192.168.40.16:5601
第一次登录需要添加一个 Elasticsearch 索引:
Index name or pattern
//输入:system-* #在索引名中输入之前配置的 Output 前缀“system”
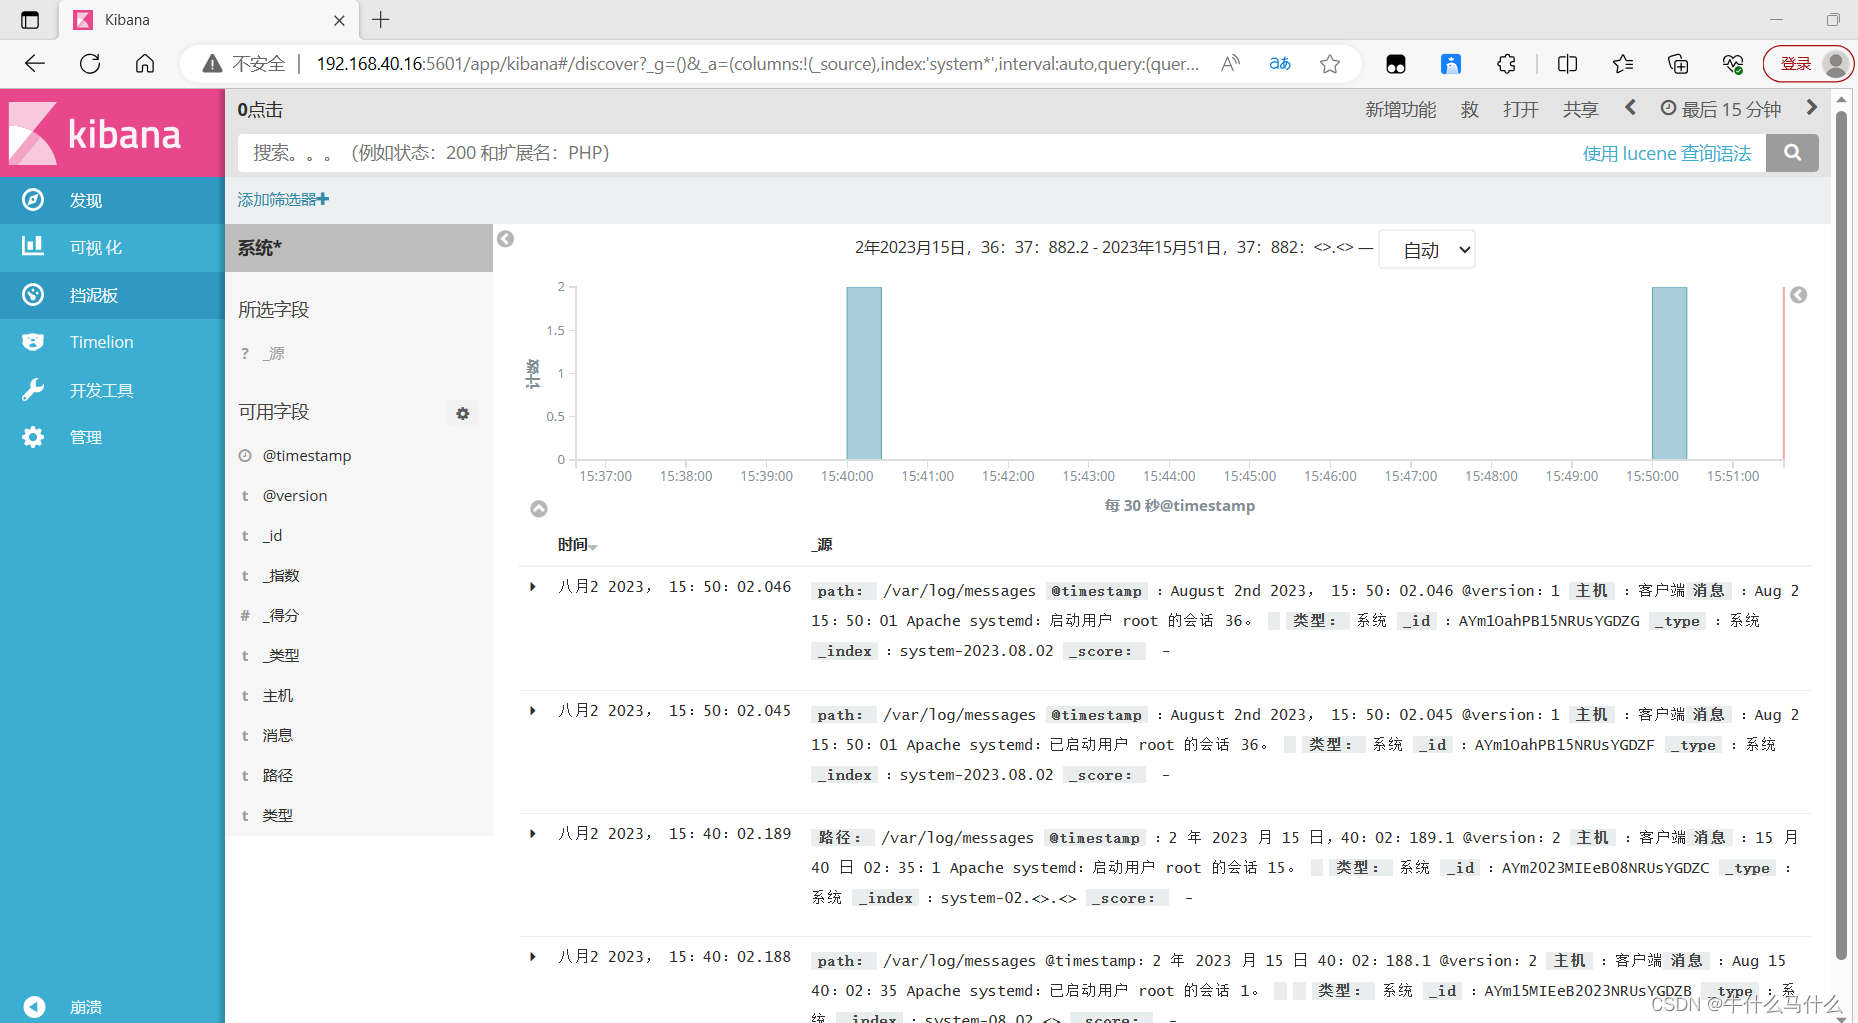
单击 “create” 按钮创建,单击 “Discover” 按钮可查看图表信息及日志信息。
数据展示可以分类显示,在“Available Fields”中的“host”,
然后单击 “add”按钮,可以看到按照“host”筛选后的结果 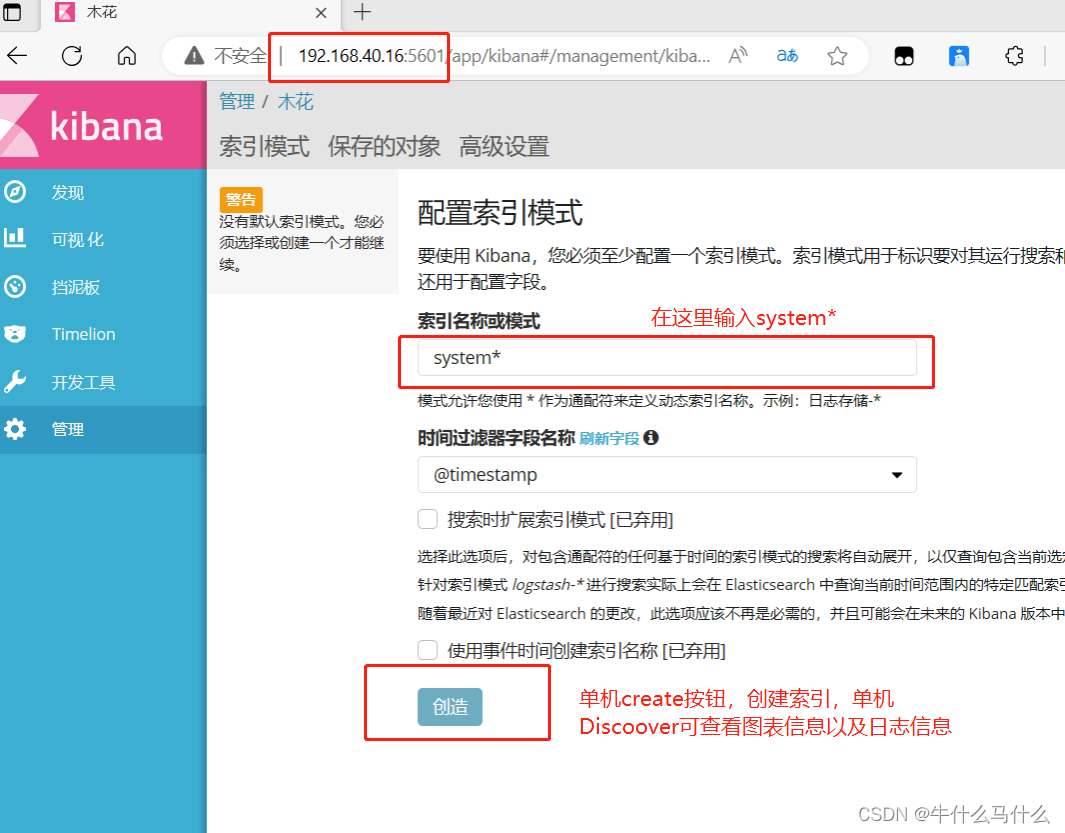
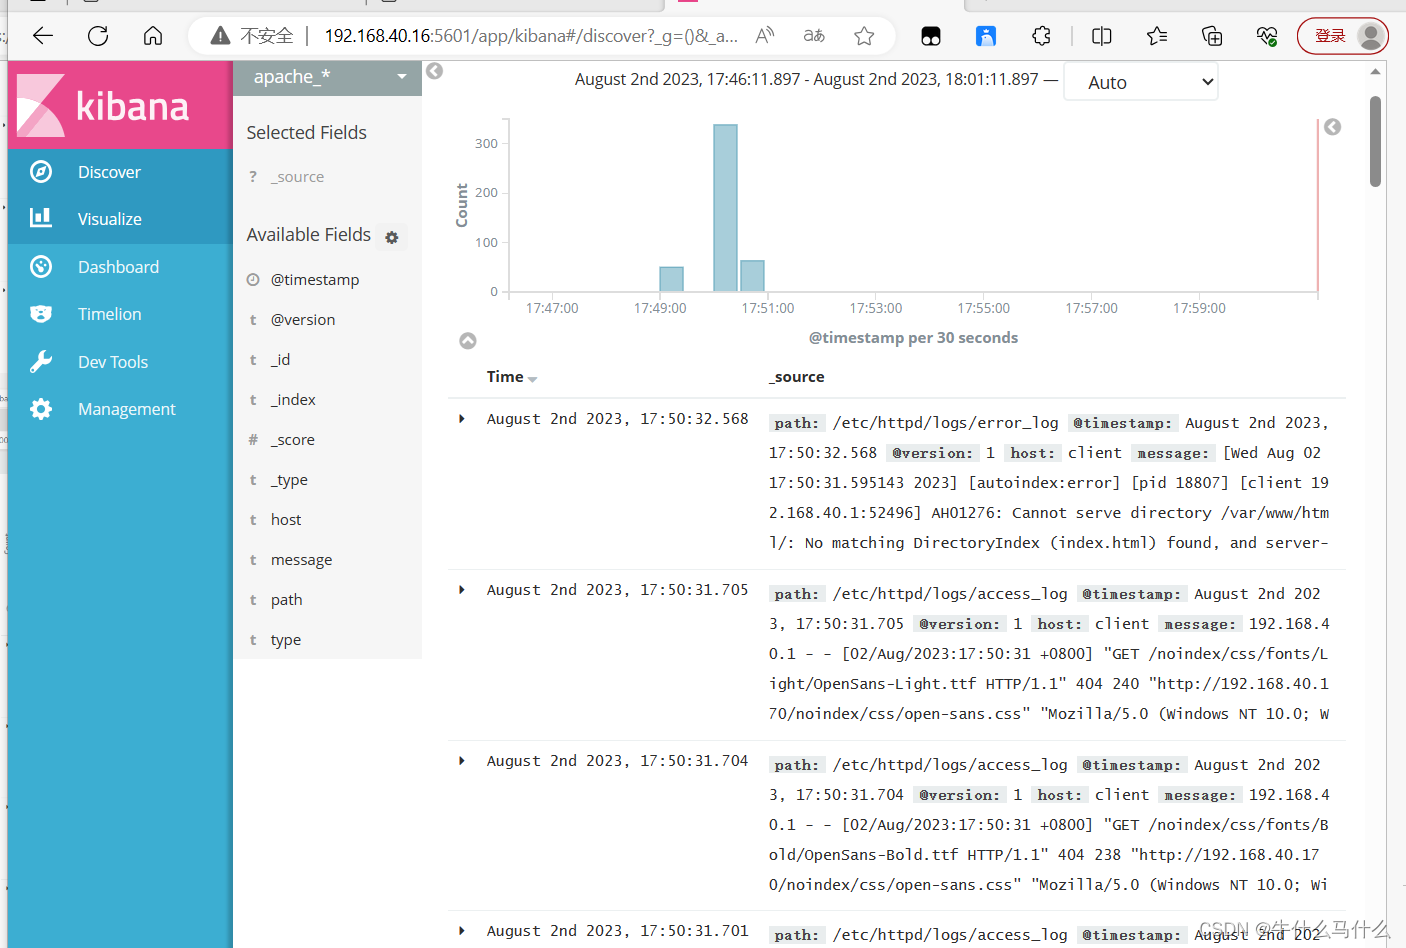
12.5 Add Apache server logs (accessed, errors) to Elasticsearch and display them through Kibana (operation on 192.168.40.170)
[root@client ~]# vim /etc/logstash/conf.d/apache_log.conf

vim /etc/logstash/conf.d/apache_log.conf

input {
    file{
        path => "/etc/httpd/logs/access_log"        #apache服务的访问日志路径
        type => "access"                            #访问日志
        start_position => "beginning"               #从头开始
    }
    file{
        path => "/etc/httpd/logs/error_log"         #apache服务的错误日志路径
        type => "error"                             #错误日志
        start_position => "beginning"               #开始位置从头开始
    }
}
output {
    if [type] == "access" {                         #判断类型为访问日志
        elasticsearch {                             #指定与es建立连接的ip
            hosts => ["192.168.40.16:9200"]
            index => "apache_access-%{+YYYY.MM.dd}"     #索引为apache的_access的日期
        }
    }
        if [type] == "error" {                        # 判断类型为错误日志
        elasticsearch {
            hosts => ["192.168.40.16:9200"]
            index => "apache_error-%{+YYYY.MM.dd}"
        }
    }
}
cd /etc/logstash/conf.d/
#加载配置文件
/usr/share/logstash/bin/logstash -f /etc/logstash/conf.d/apache_log.conf
#浏览器访问http://192.168.226.30/测试刷新日志文件,否则可能没有日志同步到ES
#浏览器访问http://192.168.226.10:5601
点击左下角有个management选项---index patterns---create index pattern
----分别创建apache_error-* 和 apache_access-* 的索引 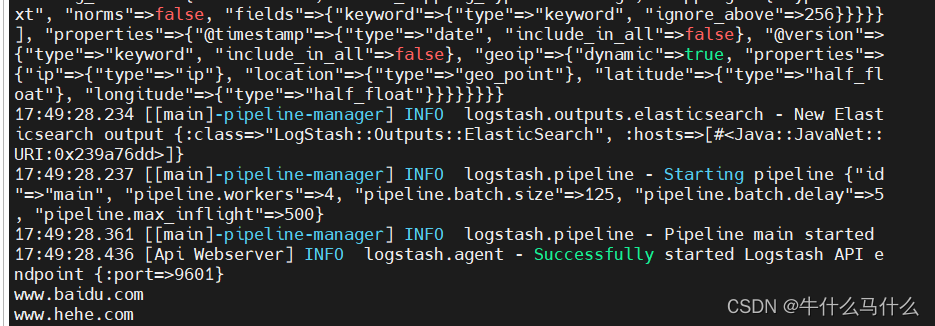
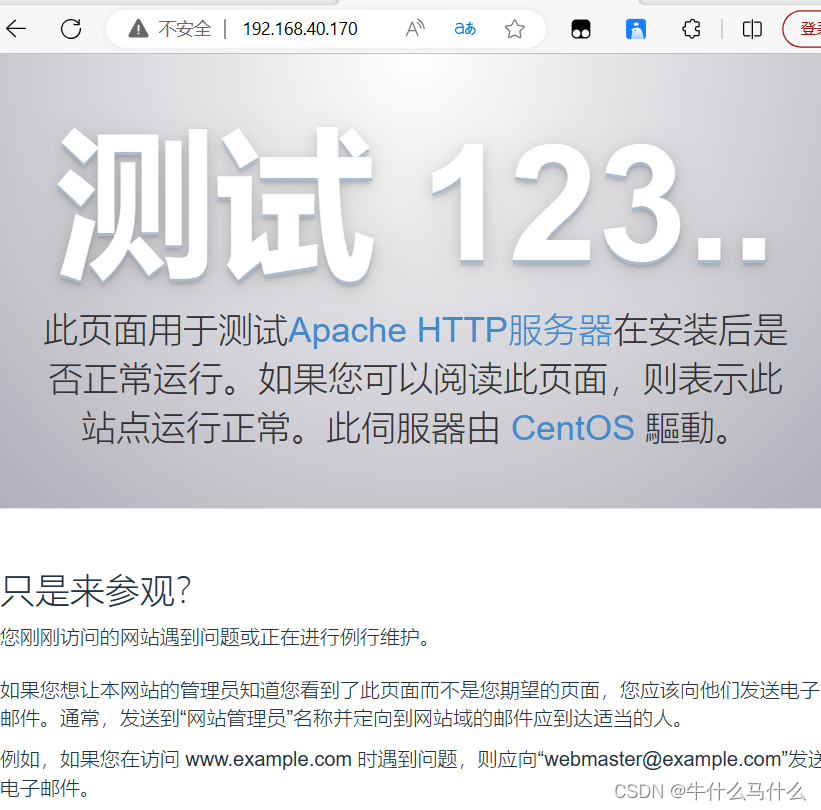
Visit (192.168.40.170) to visit the apache page
Browser access http://192.168.40.16:9100 to check whether the index is created
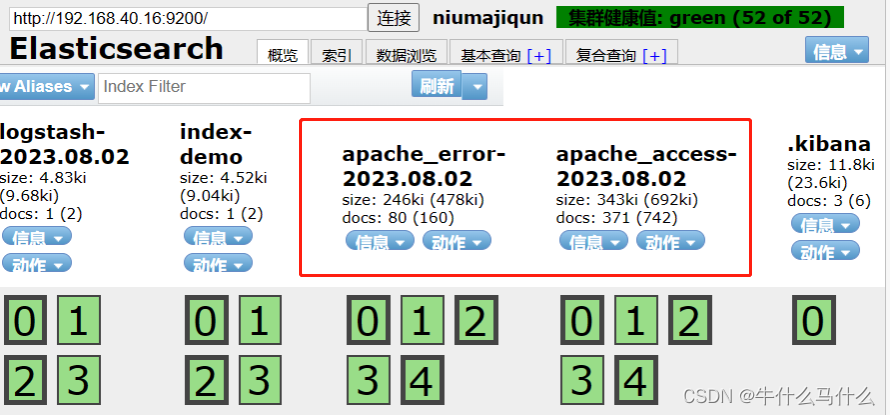
Browser access http://192.168.40.16:5601

The access can be refreshed on the host machine, the log will be refreshed, and the time can be viewed in kibana