SpringCloud microservice technology stack. Dark horse follow-up eight
- today's goal
- 1. Getting to know Sentinel
- 2. Flow control
- 3. Isolation and de-escalation
- 4. Authorization Rules
- 5. Rule persistence
today's goal

1. Getting to know Sentinel
1.1. Avalanche problem and solution
1.1.1. Avalanche problem
In microservices, the call relationship between services is intricate, and a microservice often depends on multiple other microservices.
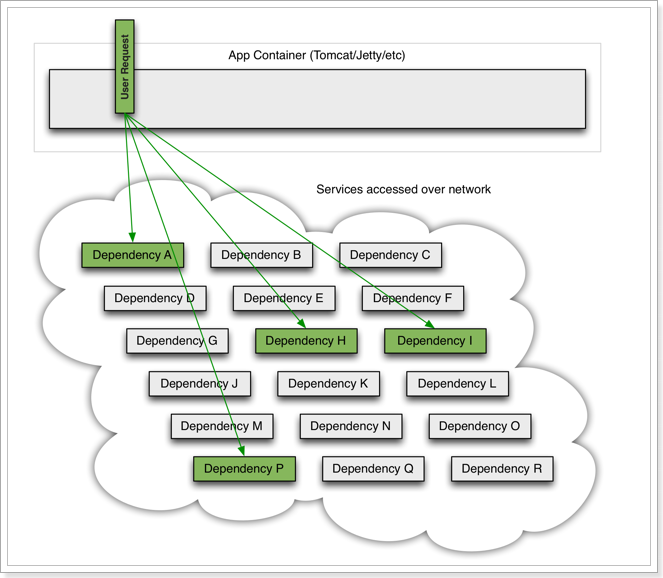
As shown in the figure, if service provider I fails, part of the business of the current application will also be blocked because it depends on service I. At this time, other services that do not depend on Service I seem to be unaffected.

However, the business request that depends on service I is blocked, and the user will not get a response, so the thread of tomcat will not be released, so more and more user requests arrive, and more and more threads will be blocked:
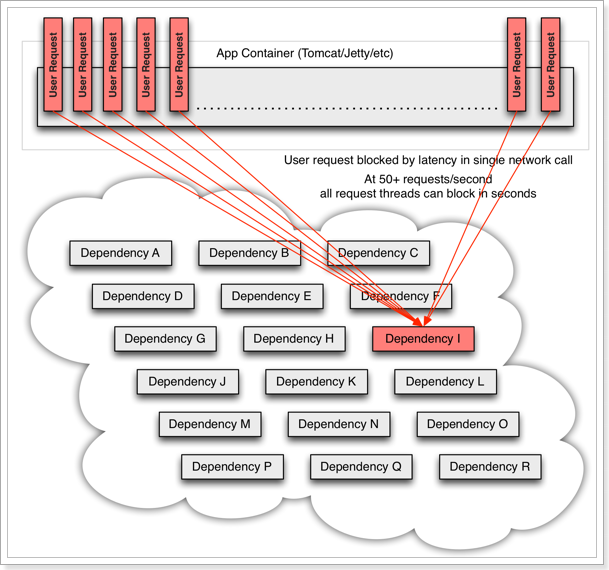
The number of threads and concurrency supported by the server is limited. If the request is blocked all the time, the server resources will be exhausted, and all other services will be unavailable, so the current service will also be unavailable.
Then, other services that depend on the current service will eventually become unavailable over time, forming a cascading failure, and an avalanche occurs: Avalanche:
a service failure in the microservice call link, causing the entire chain All the microservices in the path are unavailable, it's an avalanche .
1.1.2. Timeout processing
There are four common ways to solve the avalanche problem:
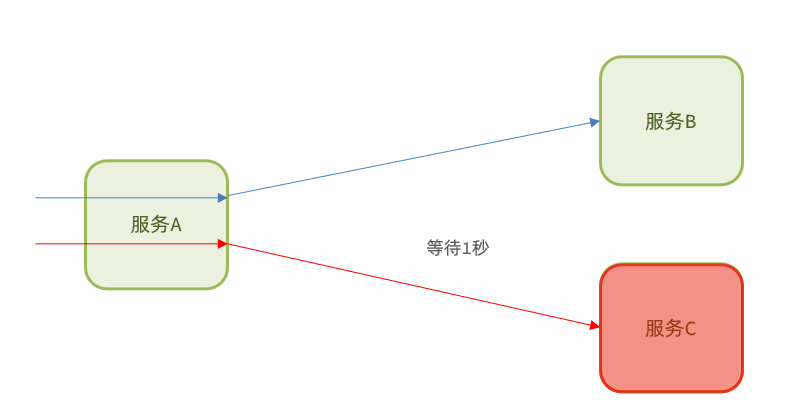
• Timeout processing: set the timeout period, and return an error message if there is no response to the request for a certain period of time, instead of waiting endlessly
1.1.3. Wall mode
Option 2: warehouse wall mode
The warehouse wall pattern comes from the design of the cabin:
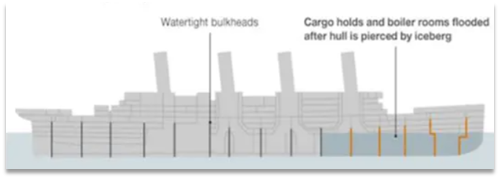
The cabin will be separated into multiple independent spaces by partitions. When the hull is damaged, only part of the space will enter, and the failure will be controlled within a certain range to prevent the entire hull from being submerged.
Similar to this, we can limit the number of threads that each business can use to avoid exhausting the resources of the entire tomcat, so it is also called thread isolation.

1.1.4. Circuit breaker
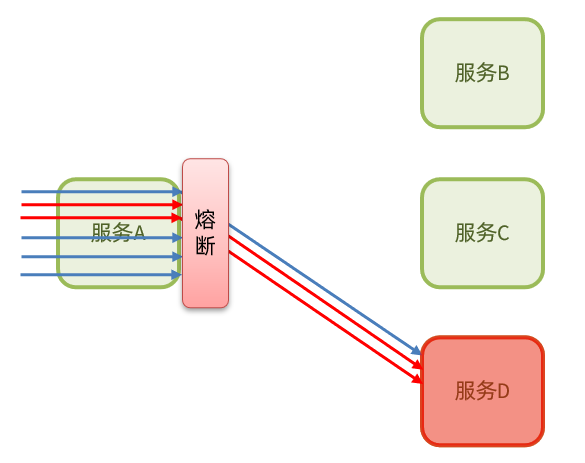
Circuit breaker mode: The abnormal proportion of business execution is counted by the circuit breaker . If the threshold is exceeded, the business will be fused and all requests to access the business will be intercepted.
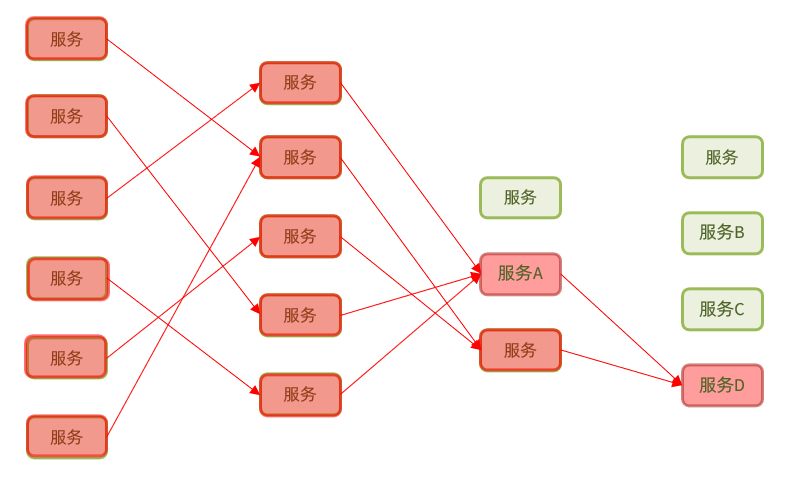
The circuit breaker will count the number of requests to access a service, the abnormal ratio:
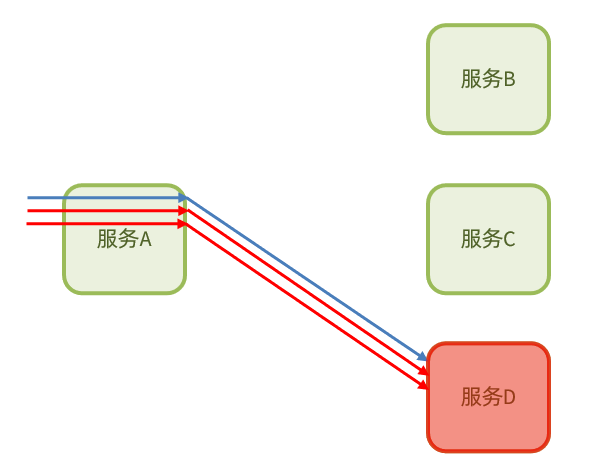
When it is found that the abnormal ratio of requests to access service D is too high, it is considered that service D has the risk of causing an avalanche, and all requests to access service D will be intercepted to form a circuit breaker:

1.1.5. Current limiting
Flow control : QPS to limit business access to avoid service failure due to sudden increase in traffic.
1.1.6. Summary
What is the avalanche problem?
- Microservices call each other, because a service failure in the call chain causes the entire link to be inaccessible.
It can be considered:
Current limiting is the protection of services, avoiding service failures caused by instantaneous high concurrent traffic, thereby avoiding avalanches. is a precautionary measure.
Timeout processing, thread isolation, and downgrade fuse are used to control the fault within a certain range and avoid avalanches when some services fail. is a remedy .
1.2. Comparison of service protection technologies
Multiple service protection technologies are supported in Spring Cloud:
The Hystrix framework was more popular in the early days, but currently the most widely used in China is the Sentinel framework of Alibaba. Here we make a comparison:
| Sentinel | Hystrix | |
|---|---|---|
| isolation strategy | Semaphore isolation | Thread pool isolation/semaphore isolation |
| Circuit breaker downgrade strategy | Based on slow call ratio or abnormal ratio | Based on failure rate |
| Real-time indicator implementation | sliding window | Sliding window (based on RxJava) |
| rule configuration | Support multiple data sources | Support multiple data sources |
| Scalability | multiple extension points | plug-in form |
| Annotation-based support | support | support |
| Limiting | Based on QPS, support current limiting based on call relationship | limited support |
| traffic shaping | Support slow start, uniform queuing mode | not support |
| System Adaptive Protection | support | not support |
| console | Out of the box, you can configure rules, view second-level monitoring, machine discovery, etc. | imperfect |
| Adaptation to Common Frameworks | Servlet、Spring Cloud、Dubbo、gRPC 等 | Servlet、Spring Cloud Netflix |
1.3. Sentinel introduction and installation
1.3.1. Getting to know Sentinel
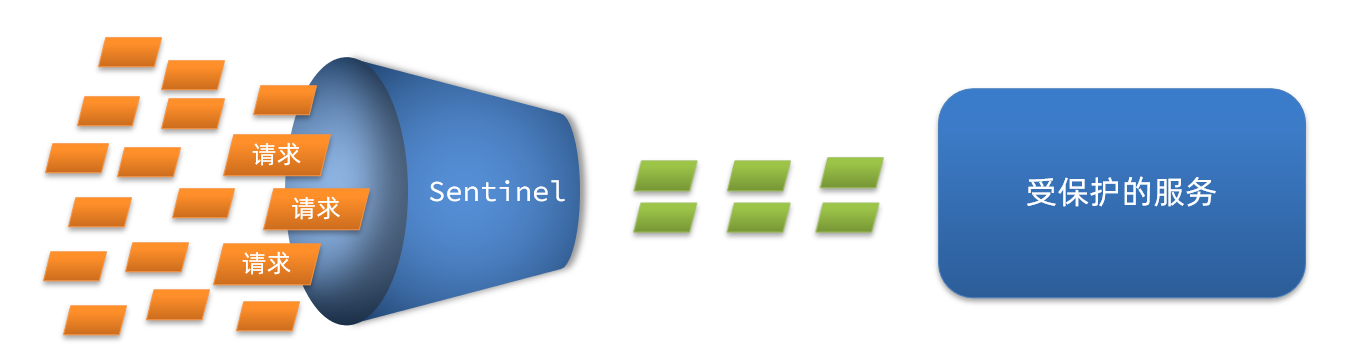
Sentinel is a microservice traffic control component open sourced by Alibaba. Official website address: Sentinel official website
Sentinel has the following characteristics:
• Rich application scenarios : Sentinel has undertaken the core scenarios of Alibaba's Double Eleven traffic promotion in the past 10 years, such as seckill (that is, burst traffic is controlled within the range that the system capacity can bear), message peak-shaving and valley-filling, cluster traffic Control, real-time fusing of downstream unavailable applications, etc.
• Complete real-time monitoring : Sentinel also provides real-time monitoring functions. In the console, you can see the second-level data of a single machine connected to the application, or even the aggregated running status of a cluster with a scale of less than 500.
• Extensive open source ecosystem : Sentinel provides out-of-the-box integration modules with other open source frameworks/libraries, such as integration with Spring Cloud, Dubbo, and gRPC. You only need to introduce the corresponding dependencies and perform simple configurations to quickly access Sentinel.
• Perfect SPI extension point : Sentinel provides easy-to-use and complete SPI extension interface. You can quickly customize the logic by implementing the extension interface. For example, custom rule management, adaptation of dynamic data sources, etc.
1.3.2. Install Sentinel
1) Download
Sentinel officially provides a UI console, which is convenient for us to set the current limit on the system. You can download it on GitHub .
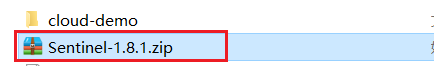
The pre-class materials also provide the downloaded jar package:

2) run
Put the jar package in any non-Chinese directory

Excuting an order:
java -jar sentinel-dashboard-1.8.1.jar

If you want to modify Sentinel's default port, account, and password, you can use the following configuration:
| configuration item | Defaults | illustrate |
|---|---|---|
| server.port | 8080 | service port |
| sentinel.dashboard.auth.username | sentinel | default username |
| sentinel.dashboard.auth.password | sentinel | default password |
For example, modify the port:
java -D to keep up with the above three requests
It is recommended to change the port here
java -Dserver.port=8099 -jar sentinel-dashboard-1.8.1.jar
3) visit
Visit the http://localhost:8099 page, and you can see the sentinel console:
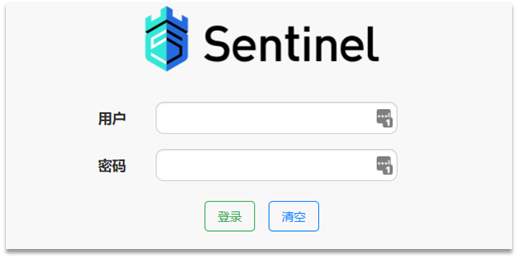
You need to enter the account number and password, the default is: sentinel
After logging in, I found a blank, nothing:
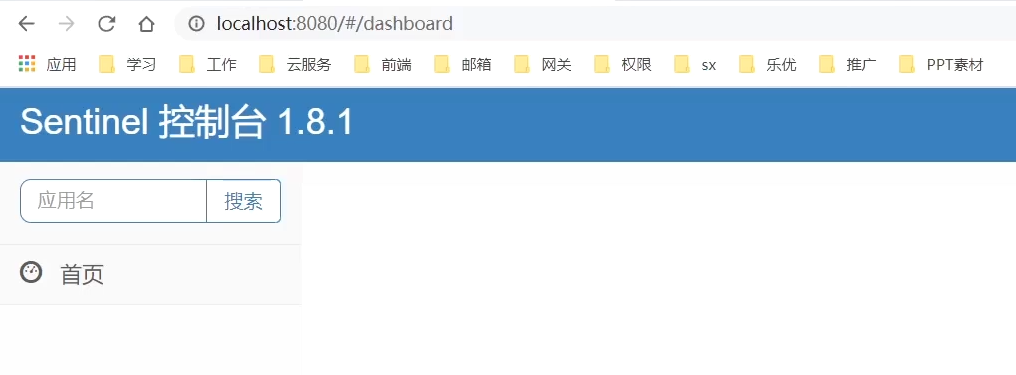
this is because we have not yet integrated with the microservice.
1.4. Microservice integration Sentinel

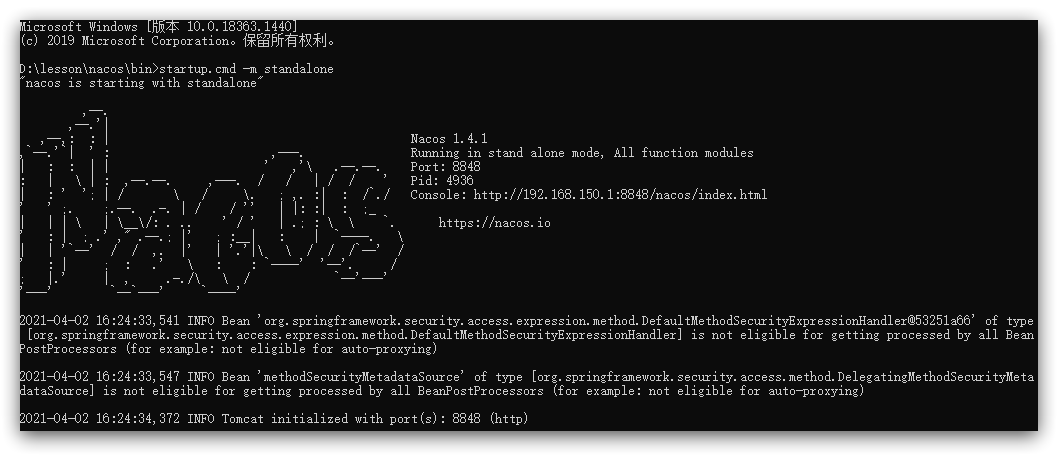
Start Nacos
./startup.cmd -m standalone
The effect picture after startup is as follows:
just enter the address in the browser:
http://127.0.0.1:8848/nacos
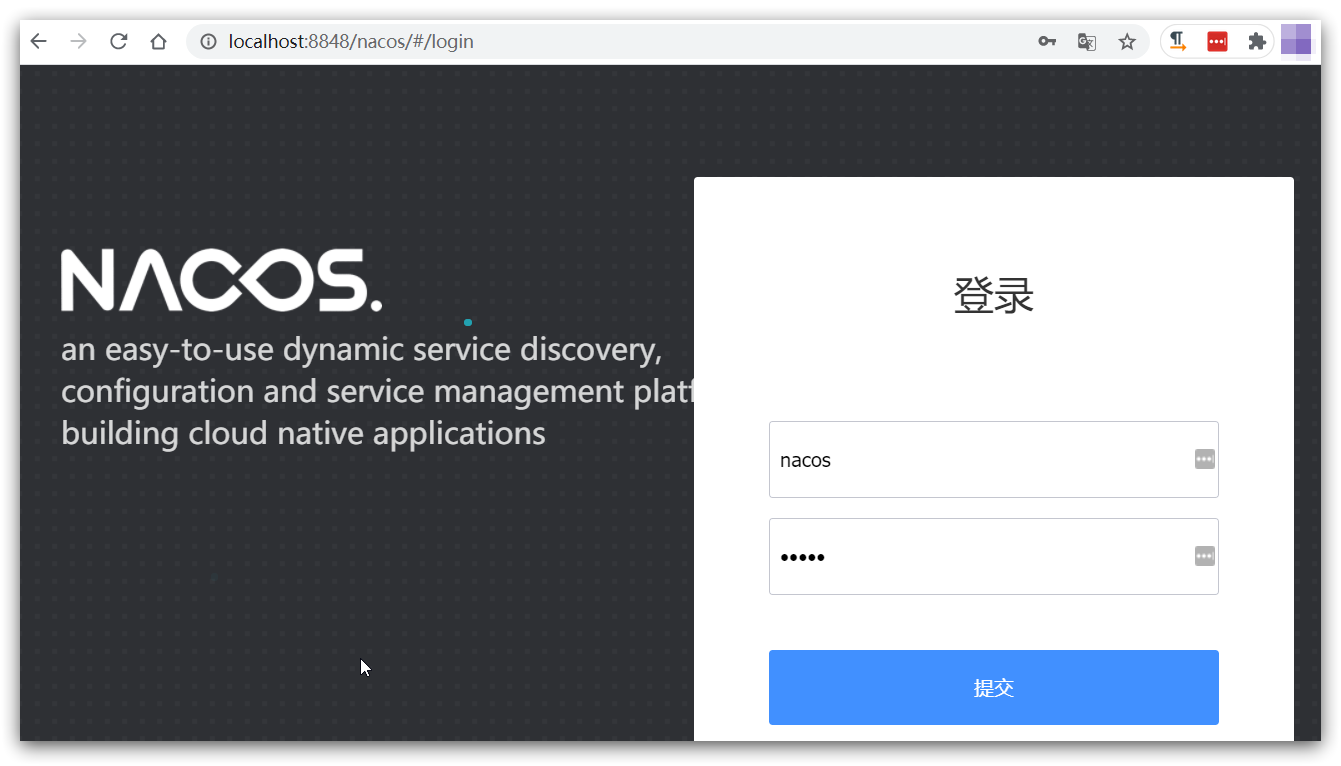
The default account and password are both nacos, just enter.
Note that all configuration files in application.yml should be changed from cluster settings to local configurations.

Start the service

. After the startup is successful, visit the gateway, Order and User, and find that they are all correct.
http://localhost:8081/user/1
http://localhost:8080/order/101
http://localhost:10010/user/1?authorization=admin
http://localhost:10010/order/101?authorization=admin
We integrate sentinel in order-service and connect to sentinel console, the steps are as follows:
1) Introduce sentinel dependency
<!--sentinel-->
<dependency>
    <groupId>com.alibaba.cloud</groupId>
    <artifactId>spring-cloud-starter-alibaba-sentinel</artifactId>
</dependency>
2) Configure the console
Modify the application.yaml file and add the following content:
server:
  port: 8080
spring:
  cloud:
    sentinel:
      transport:
        dashboard: localhost:8099

After configuration, restart order-service
3) Access any endpoint of order-service
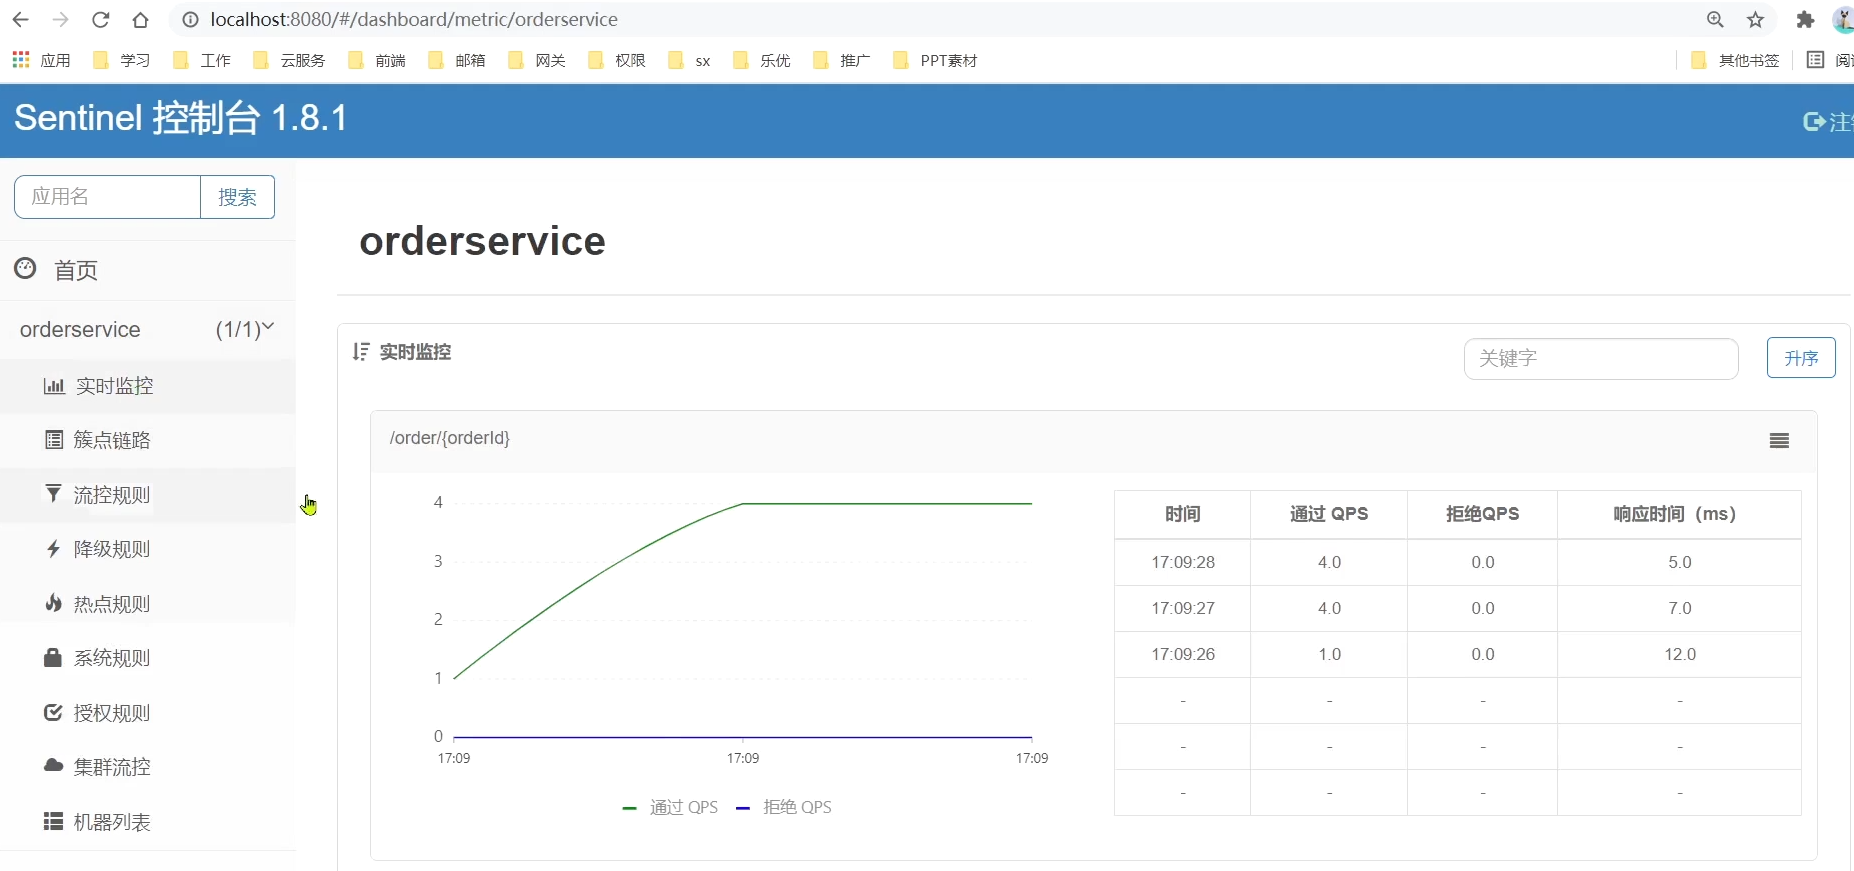
Open the browser and visit http://localhost:8080/order/101, so as to trigger the monitoring of sentinel.
Then visit the sentinel console to see the effect:
2. Flow control
Although there are four solutions to the avalanche problem, current limiting is to avoid service failure due to sudden traffic, and it is to prevent the avalanche problem of microservices. Let's learn this pattern first.
2.1. Cluster link
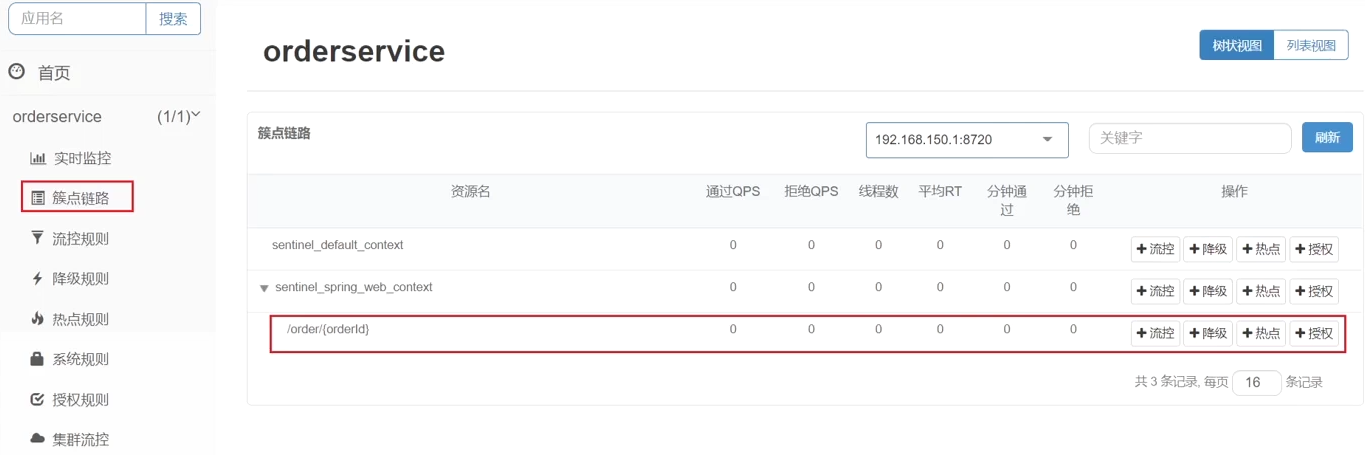
When a request enters a microservice, it first accesses the DispatcherServlet, and then enters the Controller, Service, and Mapper. Such a call chain is called a cluster point link . Each interface monitored in the cluster link is a resource .
By default, sentinel will monitor each endpoint (Endpoint, which is the method in the controller) of SpringMVC, so each endpoint (Endpoint) of SpringMVC is a resource in the call link.
For example, the endpoints in the OrderController in the order-service we just visited: /order/{orderId}

flow control, fuse, etc. are all set for the resources in the cluster point link, so we can click the button behind the corresponding resource to set the rules:
- flow control: flow control
- Downgrade: downgrade fuse
- Hotspot: hotspot parameter current limit, which is a kind of current limit
- Authorization: request permission control
2.1. Quick Start
2.1.1. Examples
Click the flow control button behind resource/order/{orderId} to pop up the form.
You can fill in the current limiting rules in the form, as follows:
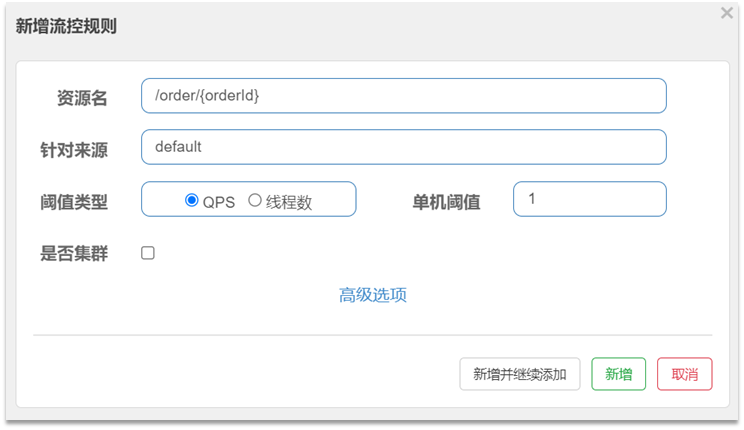
the meaning is to limit the stand-alone QPS of the resource /order/{orderId} to 1, that is, only 1 request is allowed per second, and excess requests will be intercepted and an error will be reported.
2.1.2. Practice:
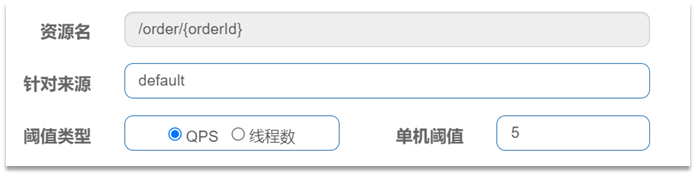
Requirement: Set flow control rules for the resource /order/{orderId}, QPS cannot exceed 5, and then test.
1) First add current limiting rules in the sentinel console
2) Use jmeter to test
If you have not used jmeter, you can refer to the document "Jmeter quick start
.

The pre-class materials provide a well-written Jmeter test sample:
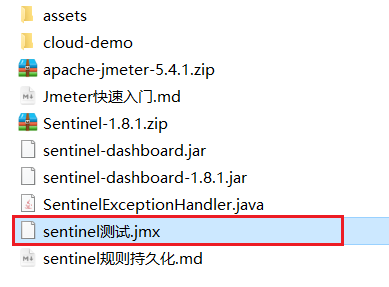
open jmeter, import the test sample provided by the pre-class materials:
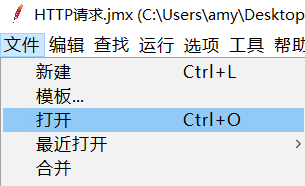
select:
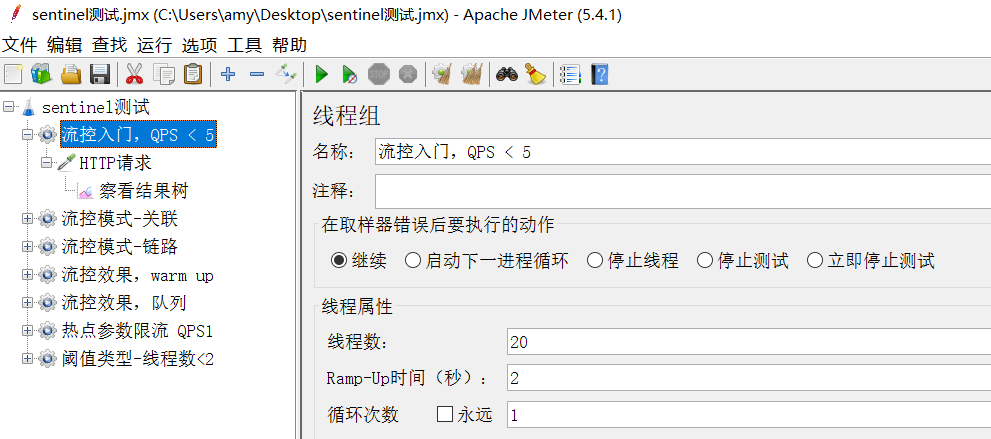
20 users, run within 2 seconds, QPS is 10, more than 5.
Select 流控入门,QPS<5the right button to run:
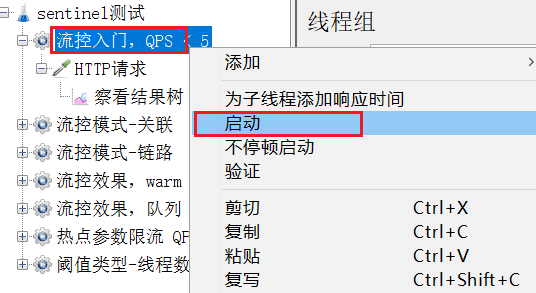
Note, do not click the execute button in the menu to run.
Here change the port to port 8080 of order-service

Result:
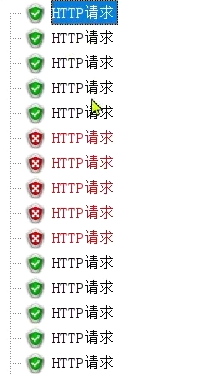
You can see that there are only 5 successful requests at a time.
Reason for failure:

Then go to sentinel to check the call status

2.2. Flow control mode
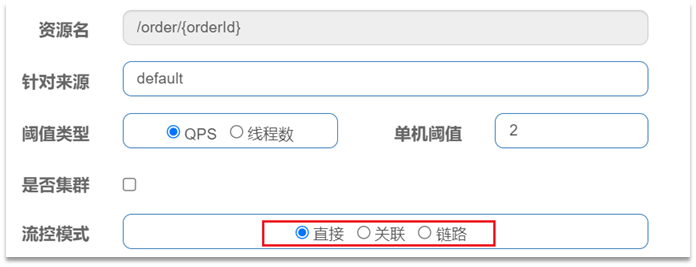
When adding a flow-limiting rule, click Advanced Options to choose from three flow-control modes :
- Direct: Statistical requests for current resources, and directly limit the flow of current resources when the threshold is triggered, which is also the default mode
- Association: count another resource related to the current resource, and limit the flow of the current resource when the threshold is triggered
- Link: Count the requests to access this resource from the specified link, and limit the flow of the specified link when the threshold is triggered
The quickstart test is the direct mode.
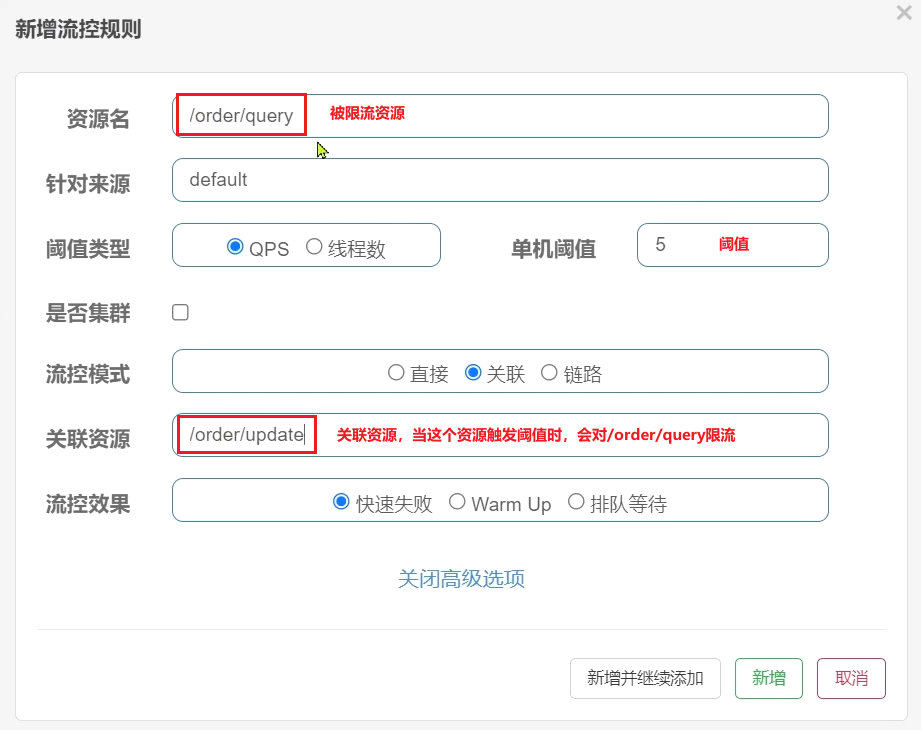
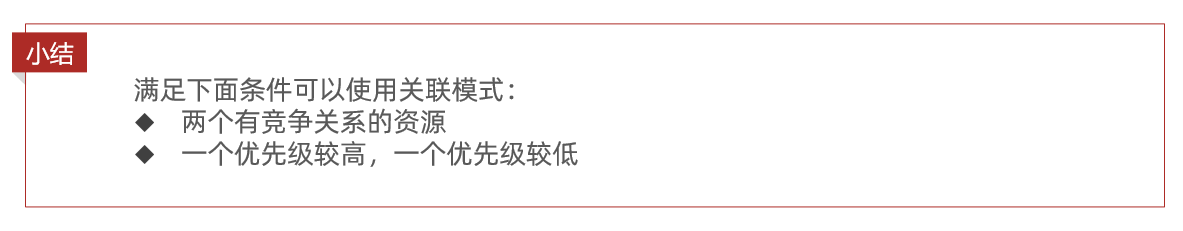
2.2.1. Association mode
Association mode : count another resource related to the current resource, and when the threshold is triggered, limit the flow of the current resource.
Configuration rules :

Syntax description : When the access volume of the /write resource triggers the threshold, the flow of the /read resource will be limited to avoid affecting / write resource.
Usage scenario : For example, the user needs to modify the order status when paying, and the user wants to query the order at the same time. Query and modification operations compete for database locks, creating contention. The business requirement is to give priority to the business of paying and updating orders. Therefore, when modifying the trigger threshold of the order business, it is necessary to limit the flow of the query order business.
Description of requirements :
-
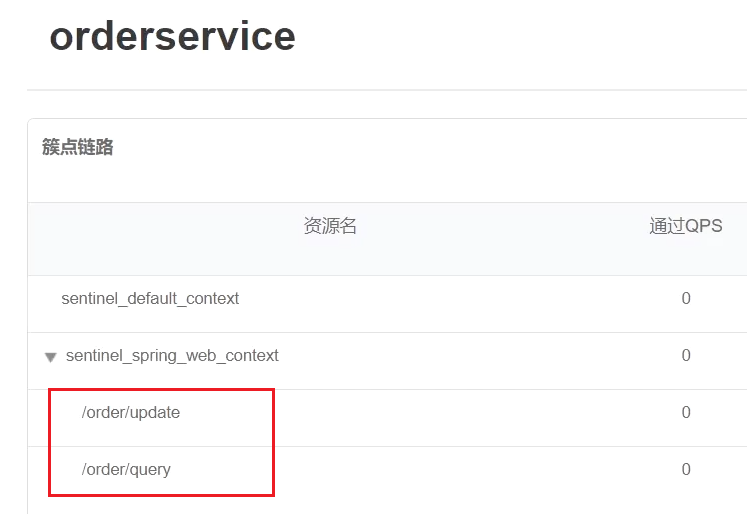
Create two endpoints in OrderController: /order/query and /order/update, no need to implement business
-
Configure flow control rules, when the QPS accessed by the /order/ update resource exceeds 5, limit the flow of /order/query requests
1) Define the /order/query endpoint to simulate order query
@GetMapping("/query")
public String queryOrder() {


    return "查询订单成功";
}
2) Define the /order/update endpoint to simulate order updates
@GetMapping("/update")
public String updateOrder() {


    return "更新订单成功";
}
Restart the service to access the newly added address
http://localhost:8080/order/query
http://localhost:8080/order/update
View the cluster point link of the sentinel console:
3) Configure flow control rules
== To limit the current of which endpoint, click the button behind that endpoint. ==We are restricting the order query/order/query, so click the button behind it:

fill in the flow control rules in the form:
4) Test in Jmeter
Select "Flow Control Mode-Association": Similarly, if the port number is changed to 8080

, 1000 users can be seen for 100 seconds, so the QPS is 10, which exceeds the threshold we set: 5
Look at the http request:
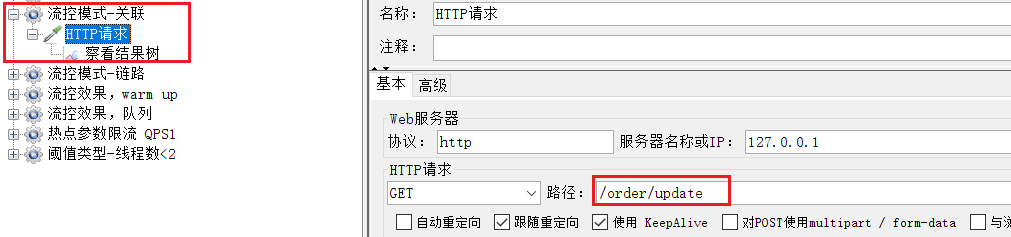
the target of the request is /order/update, so this breakpoint triggers the threshold.
But the target of the current limit is /order/query, we visit it in the browser, we can find that the
current is indeed limited.
5) Summary
2.2.2. Link mode
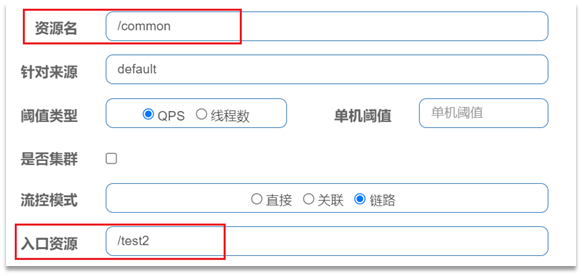
Link mode : Only make statistics on the requests to access this resource from the specified link, and judge whether it exceeds the threshold.
Configuration example :
For example, there are two request links:
- /test1 --> /common
- /test2 --> /common
If you only want to count requests from /test2 to /common, you can configure it like this:
actual combat case
Requirements: There are order query and order creation services, both of which need to query commodities. For the statistics of requests from querying orders to querying products, and setting a current limit.
step:
- Add a queryGoods method in OrderService without implementing business
- In OrderController, modify the /order/query endpoint and call the queryGoods method in OrderService
- Add an /order/save endpoint to OrderController and call the queryGoods method of OrderService
- Set the current limit rule for queryGoods, the QPS limit of the method of entering queryGoods from /order/query must be less than 2
accomplish:
1) Add a query product method
In the order-service service, add a queryGoods method to the OrderService class:
public void queryGoods(){


    System.err.println("查询商品");
}
2) When inquiring about an order, inquire about the product
In the OrderController of order-service, modify the business logic of the /order/query endpoint:
@GetMapping("/query")
public String queryOrder() {


    // 查询商品
    orderService.queryGoods();
    // 查询订单
    System.out.println("查询订单");
    return "查询订单成功";
}
3) Add new orders and query products
In the OrderController of order-service, modify the /order/save endpoint to simulate a new order:
@GetMapping("/save")
public String saveOrder() {


    // 查询商品
    orderService.queryGoods();
    // 查询订单
    System.err.println("新增订单");
    return "新增订单成功";
}
4) Add a resource tag to the query product
By default, the methods in OrderService are not monitored by Sentinel, and we need to mark the methods to be monitored through annotations.
Add the **@SentinelResource** annotation to the queryGoods method of OrderService:
@SentinelResource("goods")
public void queryGoods(){


    System.err.println("查询商品");
}
In link mode, two links from different sources are monitored. However, sentinel will set the same root resource for all requests entering SpringMVC by default, which will cause the link mode to fail.
We need to turn off this resource aggregation for SpringMVC and modify the application.yml file of the order-service service:
spring:
  cloud:
    sentinel:
      web-context-unify: false # 关闭context整合
Restart the service, visit /order/query and /order/save,

You can see that new resources have appeared in sentinel's cluster point link rules:

5) Add flow control rules
Click the flow control button behind the goods resource, and fill in the following information in the pop-up form:
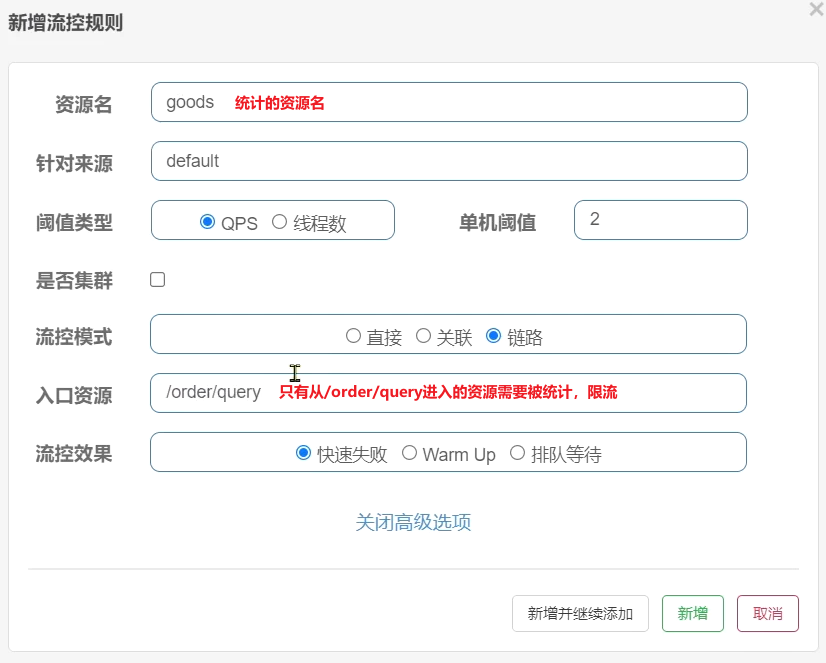
only count the resources that enter /goods from /order/query, and the QPS threshold is 2. If it exceeds the limit, the flow will be limited.
6) Jmeter test
Select "Flow Control Mode-Link":
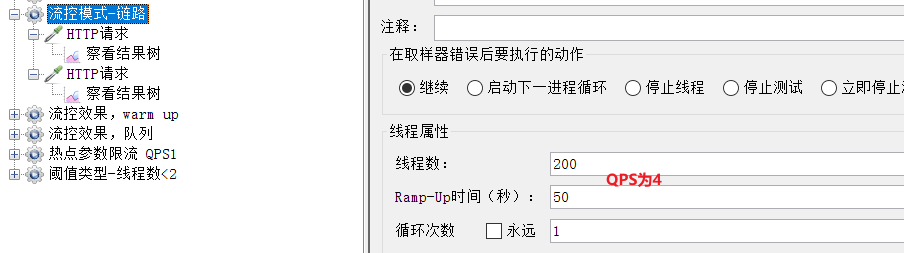
You can see that there are 200 users here, and the sending is completed within 50 seconds, and the QPS is 4, which exceeds the threshold we set. An
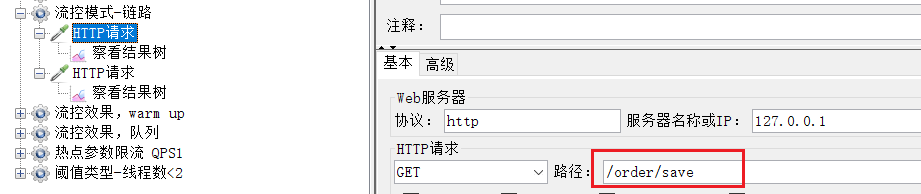
http request is to access /order/save:
the result of the operation:
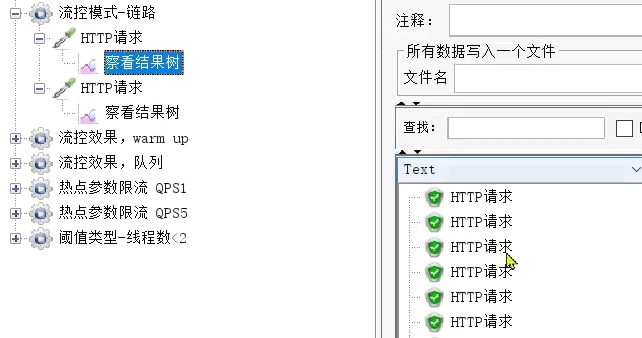
Not affected at all.
The other is to access /order/query:
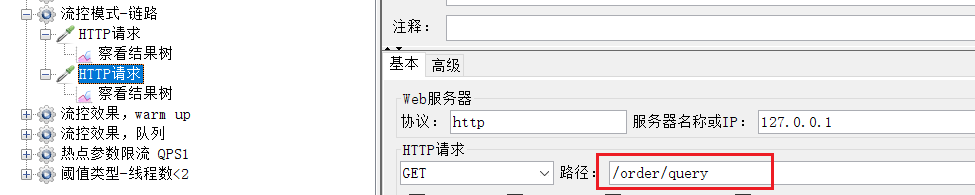
run results:
only 2 passes each time.
2.2.3. Summary
What are the flow control modes?
• Direct: limit current resources
• Association: High-priority resources trigger thresholds, and low-priority resources are limited.
• Link: When counting thresholds, only the requests entering the current resource from the specified resource are counted, which is the current limit to the source of the request
2.3. Flow control effect
In the advanced options of flow control, there is also a flow control effect option:
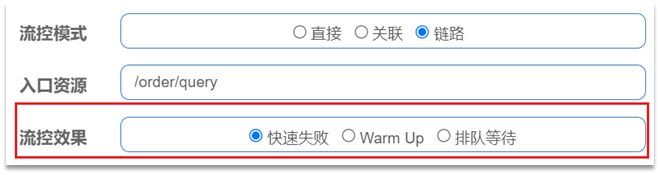
flow control effect refers to the measures that should be taken when the request reaches the flow control threshold, including three types:
-
Fail fast: Once the threshold is reached, new requests are rejected immediately and a FlowException is thrown. is the default processing method.
-
warm up: warm up mode, requests exceeding the threshold are also rejected and an exception is thrown. But this mode threshold will change dynamically, gradually increasing from a small value to a maximum threshold.
-
Waiting in queue: Let all requests be executed in a queue in order, and the interval between two requests cannot be less than the specified time
2.3.1.warm up
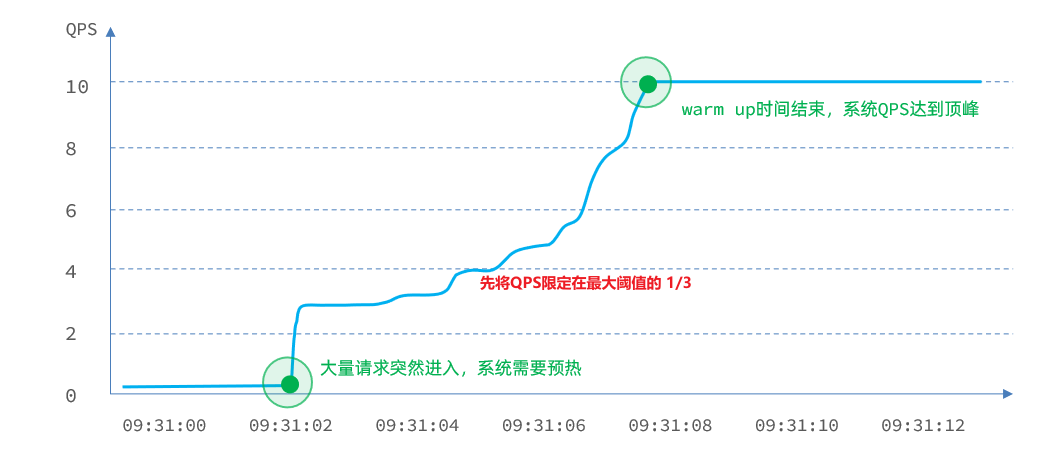
The threshold is generally the maximum QPS that a microservice can undertake. However, when a service is just started, all resources have not been initialized ( cold start ). If the QPS is directly run to the maximum value, it may cause the service to go down instantly.
Warm up is also called warm-up mode , which is a solution to cold start of services. The initial value of the request threshold is maxThreshold / coldFactor, and after a specified duration, it will gradually increase to the maxThreshold value. The default value of coldFactor is 3.
For example, if I set the maxThreshold of QPS to 10, and the warm-up time is 5 seconds, then the initial threshold is 10 / 3, which is 3, and then gradually increases to 10 after 5 seconds. Case
first
access
http://localhost:8080/order/101
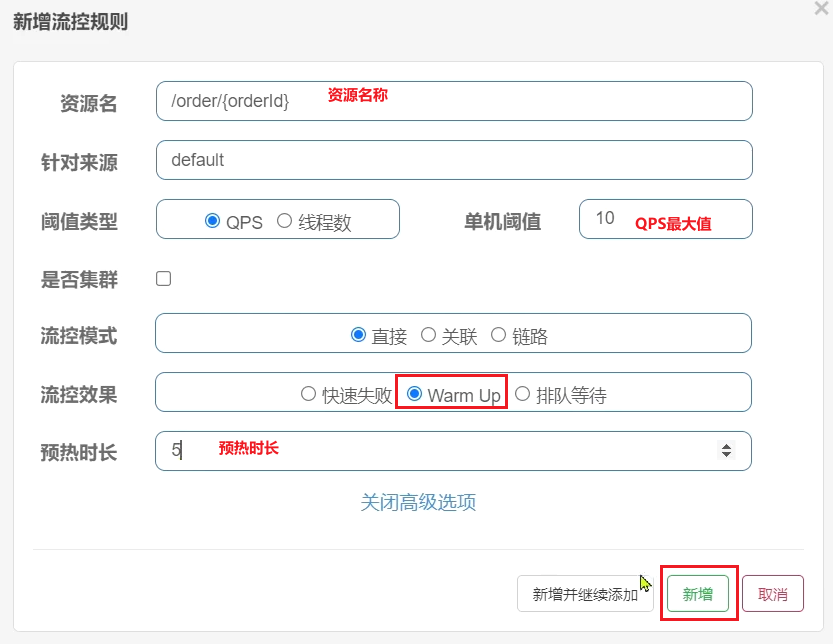
Requirements: Set a current limit for the resource /order/{orderId}, the maximum QPS is 10, use the warm up effect, and the warm-up time is 5 seconds
1) Configure flow control rules:
2) Jmeter test
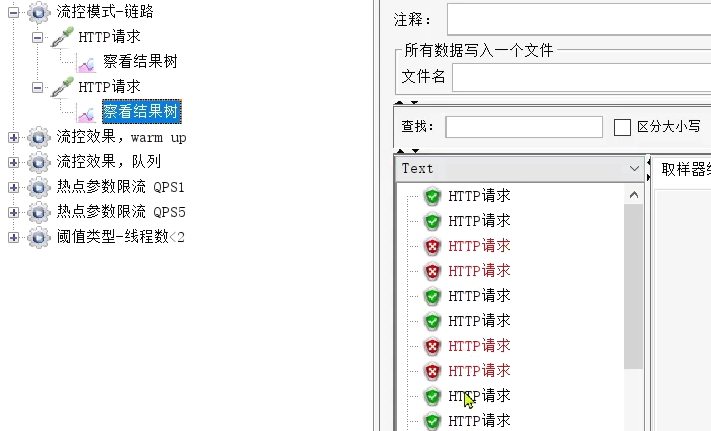
Select "Flow Control Effect, warm up":
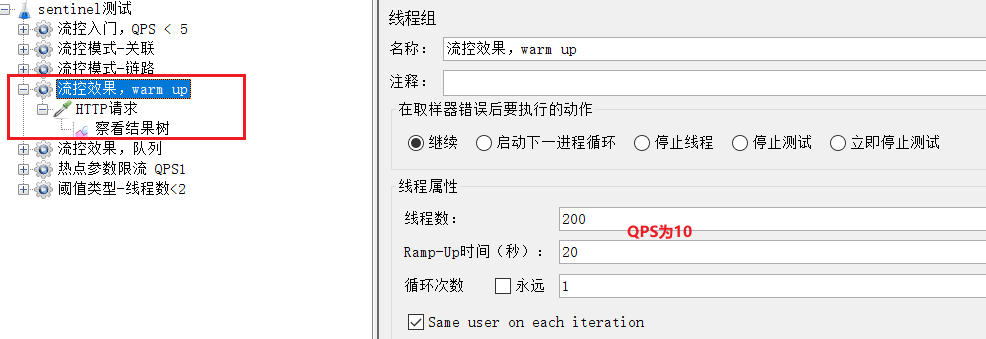
QPS is 10.
When it was just started, most of the requests failed, and only 3 succeeded, indicating that the QPS was limited to 3:
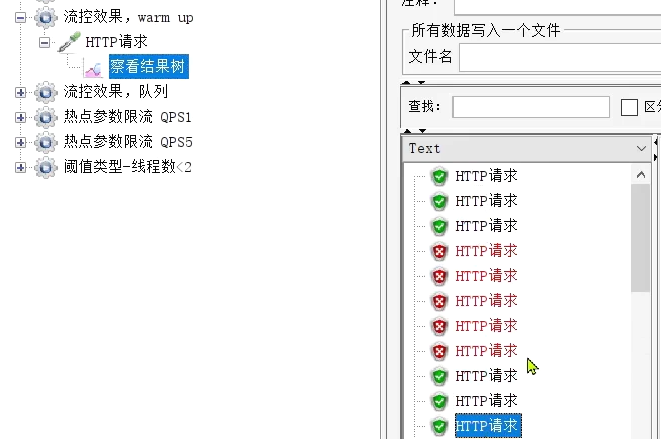
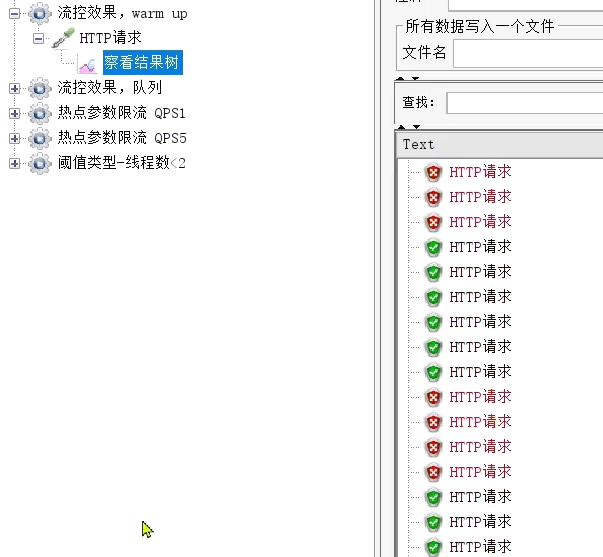
as time went by, the success rate became higher and higher:
check the real-time monitoring on the Sentinel console:
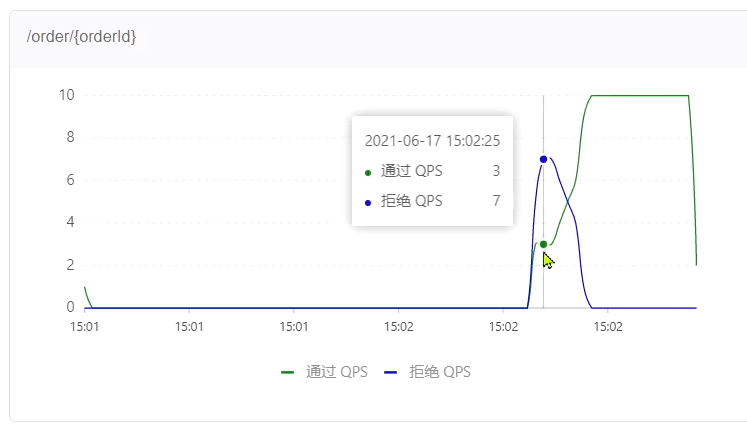
after a period of time:
2.3.2. Waiting in line
Fail fast and warm up reject new requests and throw exceptions when requests exceed the QPS threshold.
Queuing and waiting is to let all requests enter a queue, and then execute them sequentially according to the time interval allowed by the threshold. Subsequent requests must wait for previous executions to complete, and will be rejected if the expected waiting time for the request exceeds the maximum duration.
Working principle
For example: QPS = 5, means that a request in the queue is processed every 200ms; timeout = 2000, means that requests with an expected waiting time of more than 2000ms will be rejected and an exception will be thrown.

So what is the expected waiting time?
For example, 12 requests come at once, because one request is executed every 200ms, then:
- Expected waiting time for the 6th request = 200 * (6 - 1) = 1000ms
- Expected waiting time for the 12th request = 200 * (12-1) = 2200ms
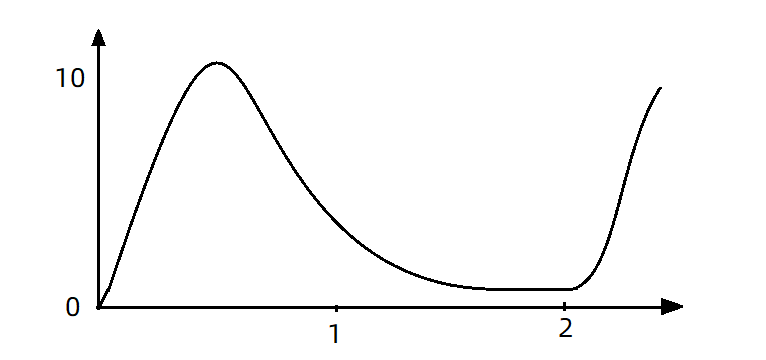
Now, 10 requests are received at the same time in the first second, but only one request is received in the second second. At this time, the QPS curve looks like this:
If you use the queue mode for flow control, all incoming requests must be queued and executed at a fixed interval of 200ms, and the QPS will become very smooth:
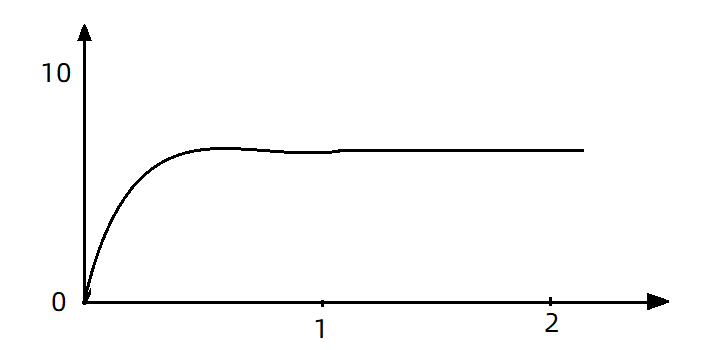
A smooth QPS curve is more friendly to the server.
the case
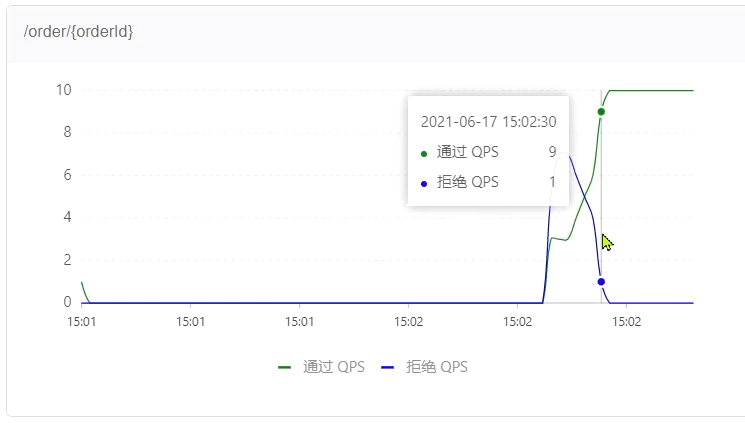
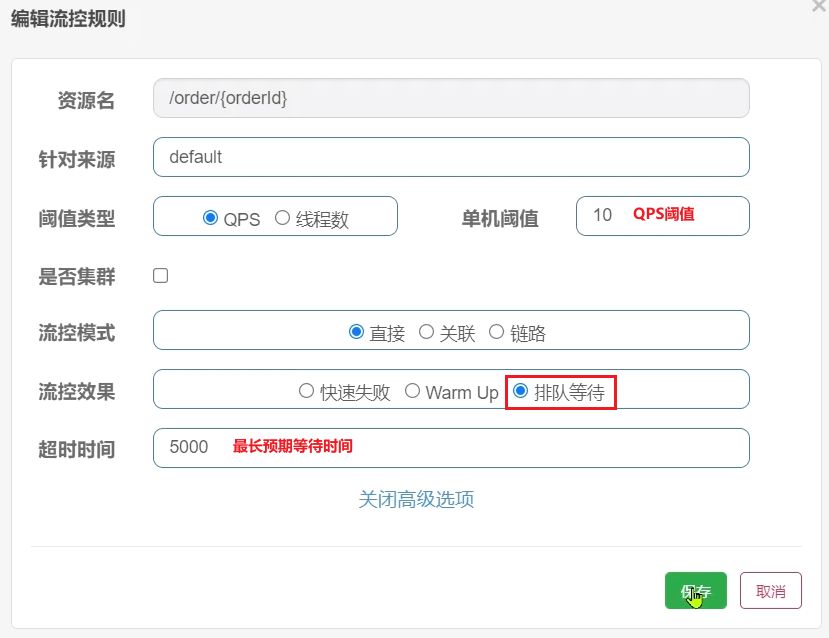
Requirement: Set current limit for the resource /order/{orderId}, the maximum QPS is 10, use the flow control effect of queuing, and set the timeout period to 5s
1) Add flow control rules
2) Jmeter test
Select "Flow Control Effect, Queue":
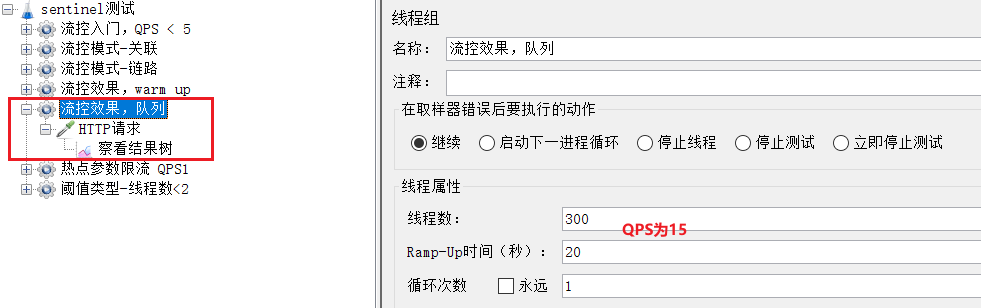
QPS is 15, which has exceeded the 10 we set.
If it is the previous fast failure and warmup mode, the excess requests should directly report an error.
But let's look at the results of the queue mode:
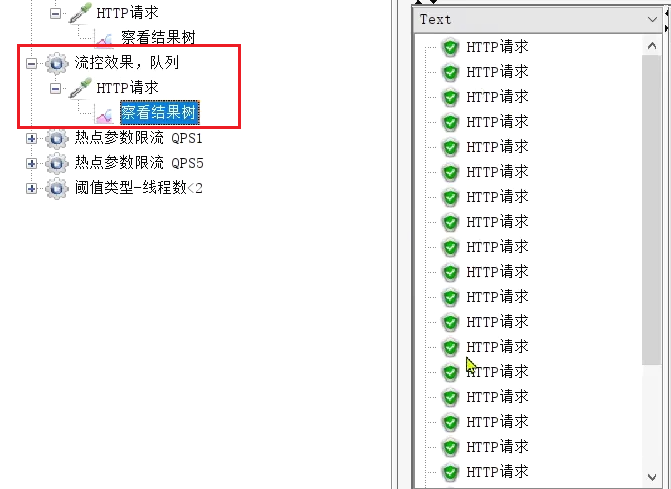
all passed.
Then go to sentinel to view the QPS curve of real-time monitoring:
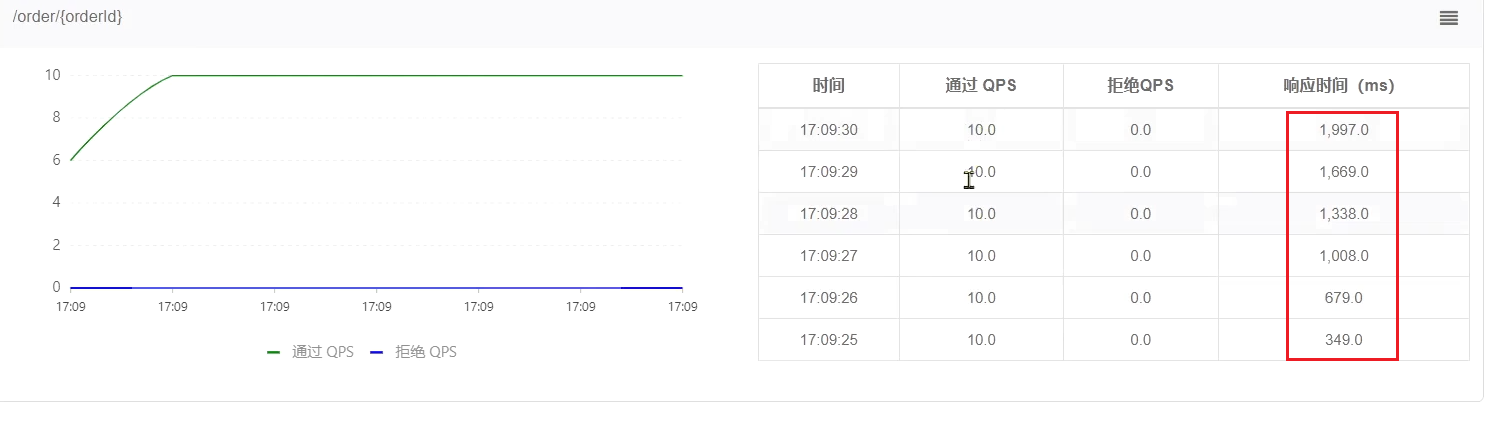
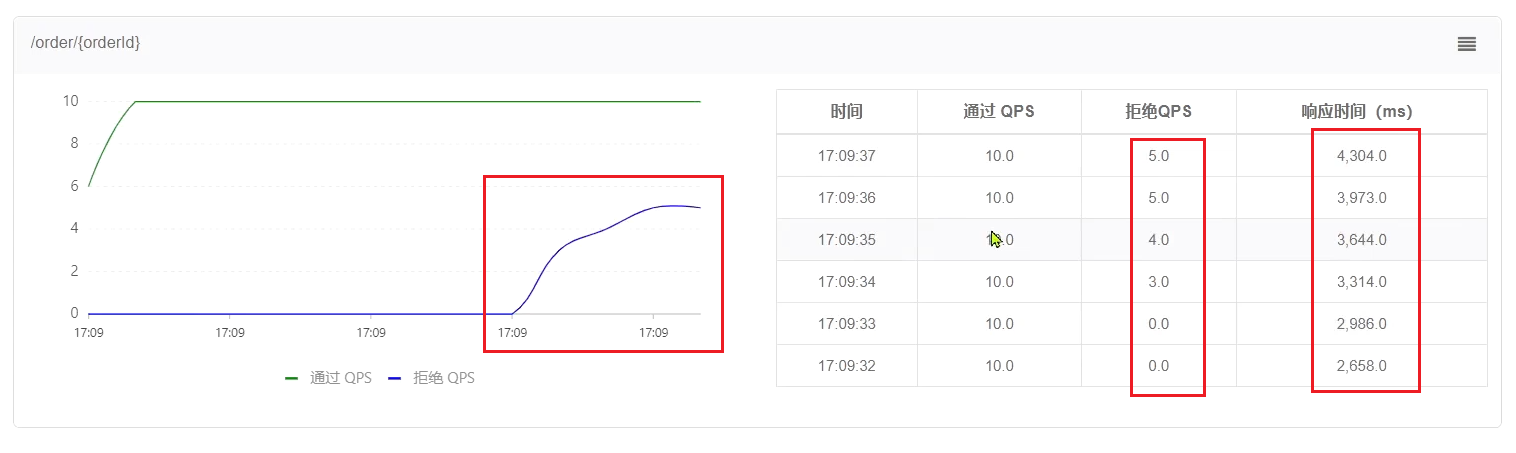
QPS is very smooth and consistently maintained at 10, but the excess requests are not rejected, but put into the queue. So the response time (waiting time) will be longer and longer.
When the queue is full, some requests will fail:
2.3.3. Summary
What are the flow control effects?
- Fail fast: reject new requests when the QPS exceeds the threshold
- warm up: When the QPS exceeds the threshold, new requests are rejected; the QPS threshold is gradually increased, which can avoid service downtime caused by high concurrency during cold start.
- Waiting in queue: the request will enter the queue, and the request will be executed sequentially according to the time interval allowed by the threshold; if the expected waiting time of the request is longer than the timeout time, it will be rejected directly
2.4. Current limit of hotspot parameters
The previous current limiting is to count all the requests to access a certain resource and judge whether it exceeds the QPS threshold. The hotspot parameter current limit is to count requests with the same parameter value separately , and judge whether it exceeds the QPS threshold.
2.4.1. Global parameter current limiting
For example, an interface for querying products based on id:
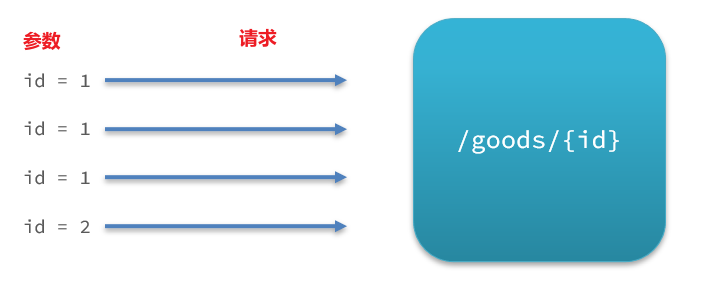
in the request to access /goods/{id}, the value of the id parameter will change, and the current limit of the hotspot parameter will count the QPS respectively according to the parameter value. The statistical result:
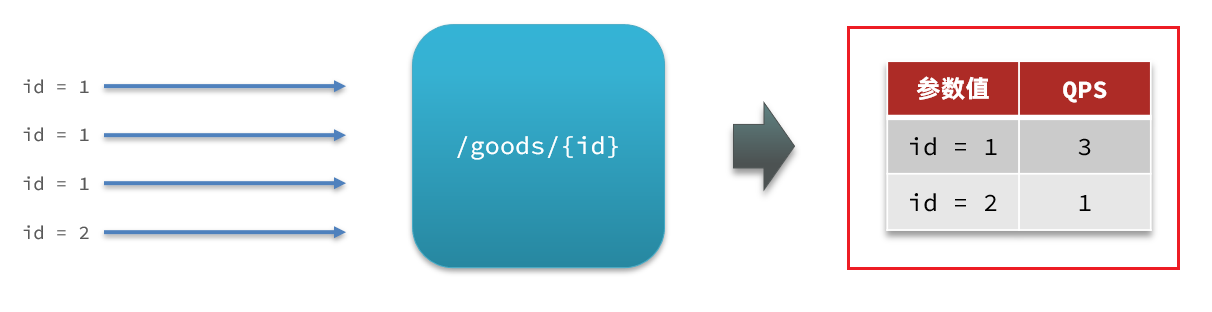
when the request with id=1 is triggered When the threshold is limited, requests with id values other than 1 will not be affected.
Configuration example: The meaning of the representative is: make statistics on parameter 0 (the first parameter) of the hot resource, and the number of requests for the same parameter value
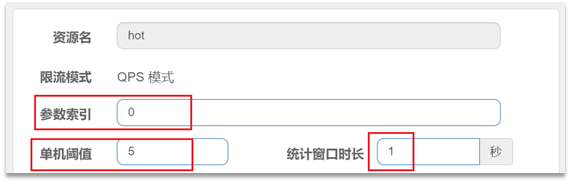
per second cannot exceed 5
2.4.2. Current limit of hotspot parameters
In the configuration just now, all products of the interface for querying products are treated equally, and the QPS is limited to 5.
In actual development, some products may be hot products, such as flash sale products. We hope that the QPS limit of these products is different from other products, and is higher. Then you need to configure the advanced option of hotspot parameter current limit:
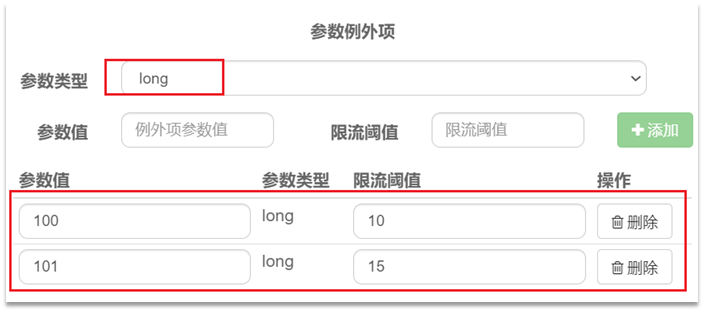
Combined with the previous configuration, the meaning here is to limit the current of the long type parameter of number 0, and the QPS of the same parameter per second cannot exceed 5, with two exceptions:
• If the parameter value is 100, the allowed QPS per 1 second is 10
• If the parameter value is 101, the allowed QPS per 1 second is 15
2.4.4. Case
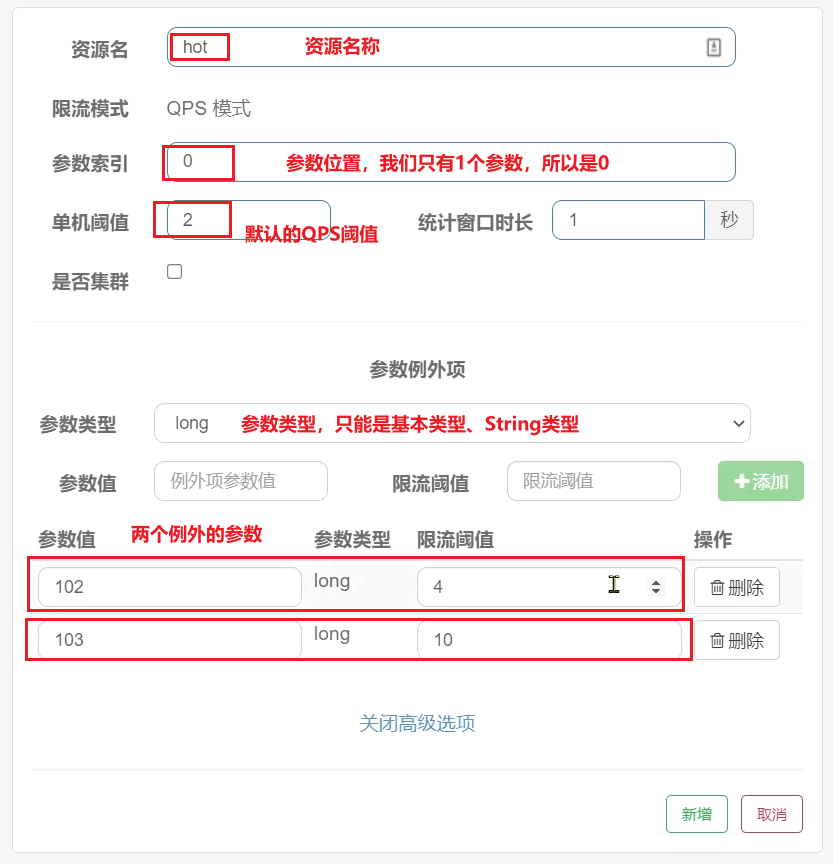
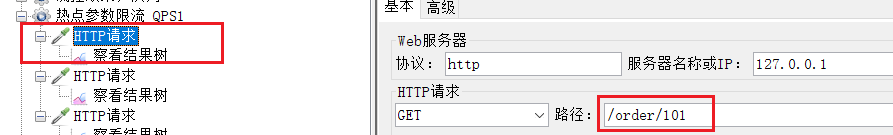
Case requirements : Add a hotspot parameter current limit to the resource /order/{orderId}, the rules are as follows:
• The default hotspot parameter rule is that the number of requests per second does not exceed 2
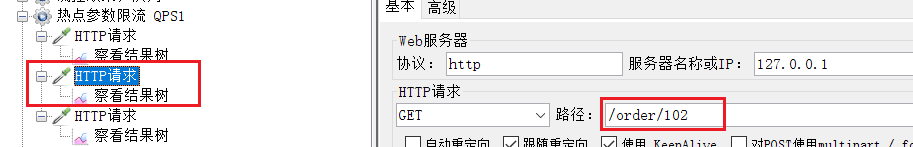
• Set an exception for the parameter 102: the number of requests per second does not exceed 4
• Set an exception for the parameter 103: the number of requests per second does not exceed 10
Note : The hotspot parameter current limit is invalid for the default SpringMVC resource, you need to use the @SentinelResource annotation to mark the resource
1) Tag resources
Add annotations to the /order/{orderId} resource in OrderController in order-service:
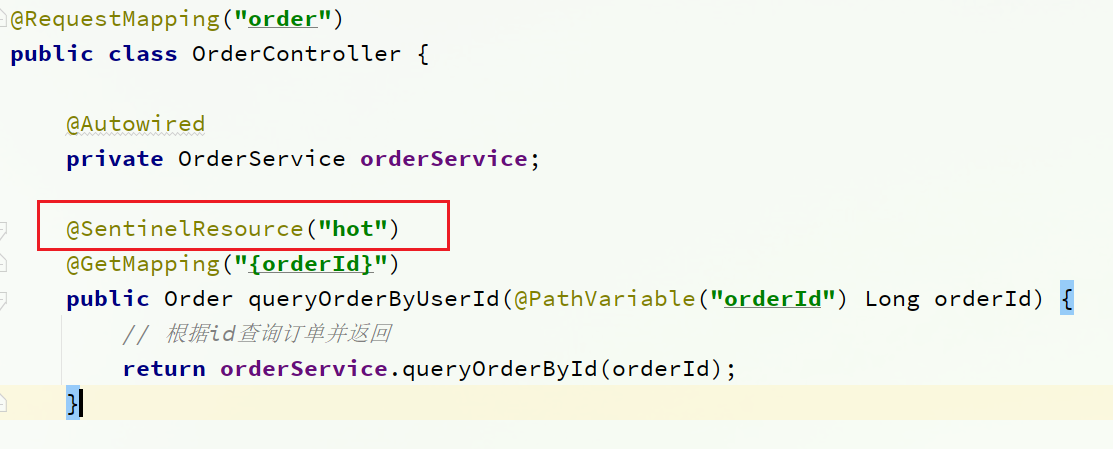
After modification, remember to restart the order-service service
2) Current limiting rules for hotspot parameters
Visit this interface, you can see that the hot resource we marked has appeared:
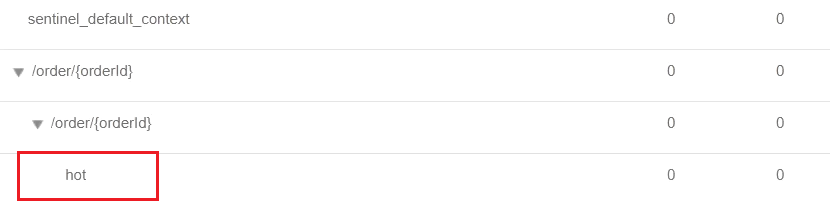
don’t click the button behind hot here, the page has a BUG
Click the Hotspot Rules menu in the left menu:
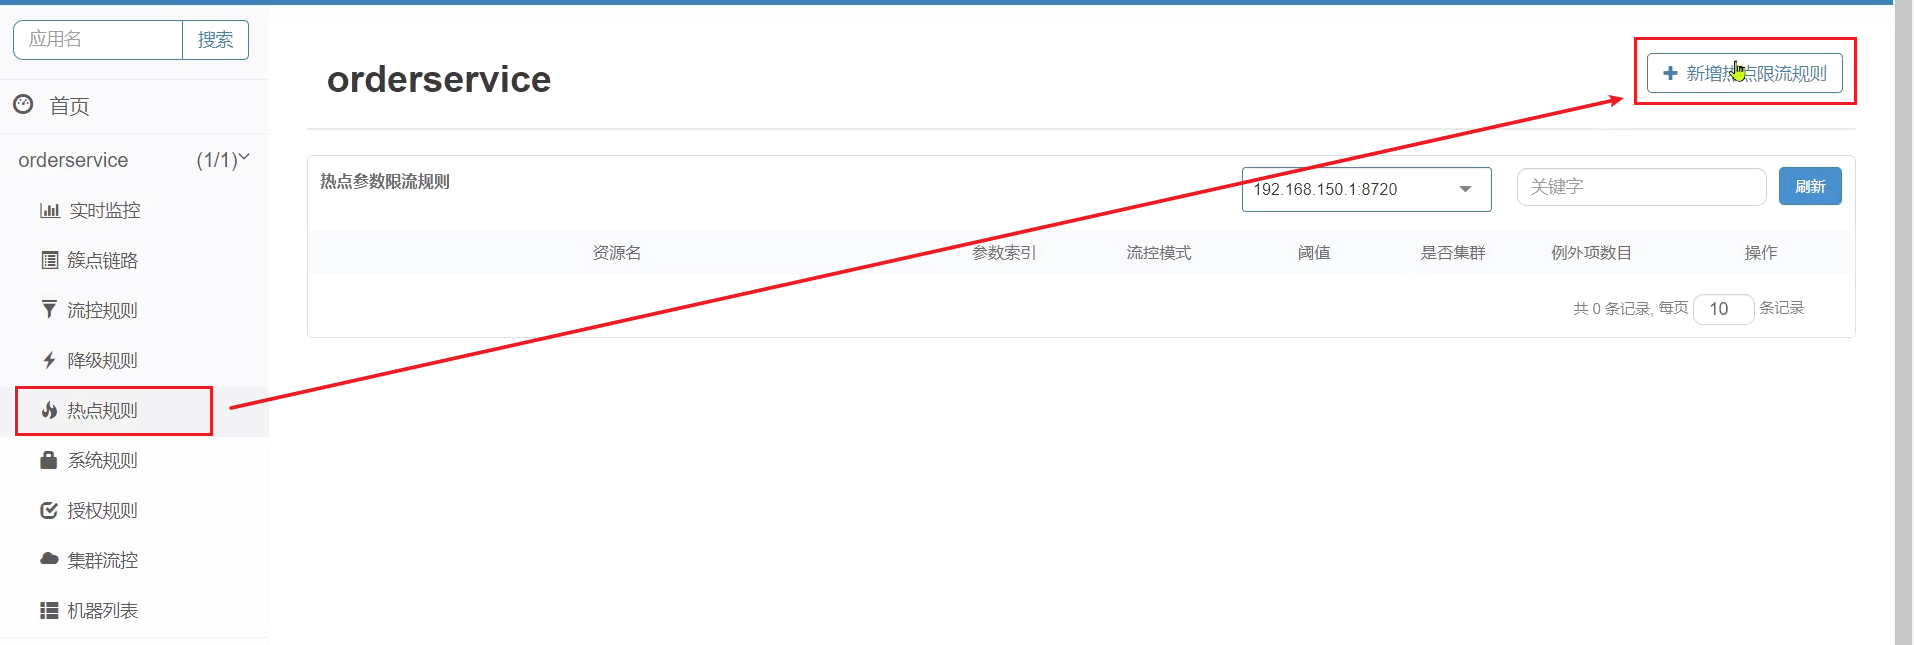
Click Add and fill in the form:
3) Jmeter test
Select "Hotspot parameter current limit QPS1":
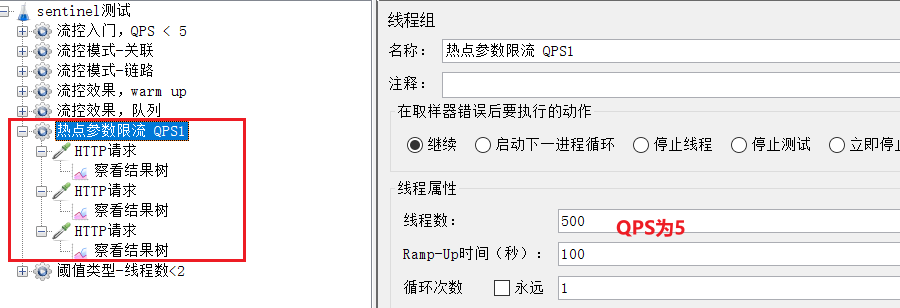
here the QPS of the request is 5.
Contains 3 http requests:
Common parameters, QPS threshold is 2
Running results:
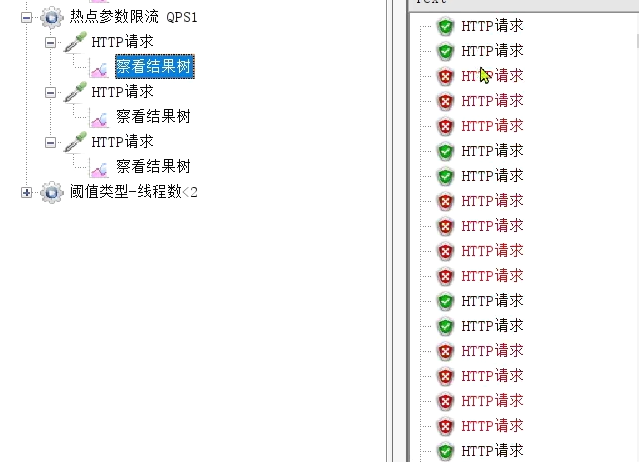
Exception items, QPS threshold is 4
operation result:
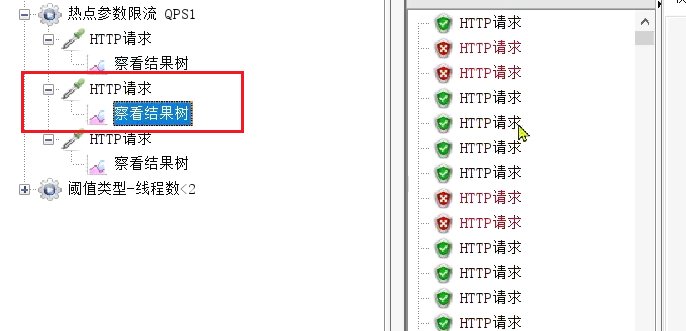
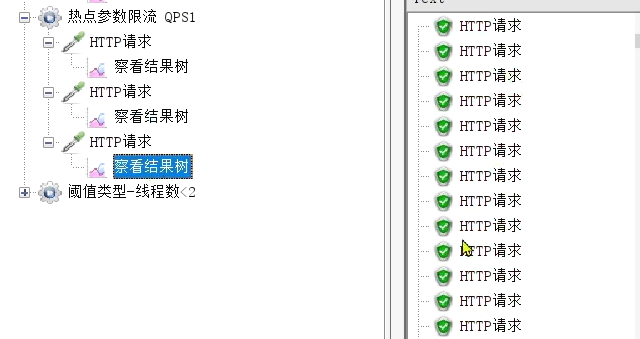
Exceptions, QPS threshold is 10
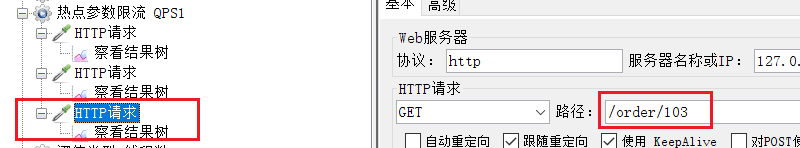
operation result:
3. Isolation and de-escalation
Current limiting is a preventive measure. Although current limiting can try to avoid service failures caused by high concurrency, services may also fail due to other reasons.
To control these faults within a certain range and avoid avalanches, it is necessary to rely on thread isolation (bulkwall mode) and fuse downgrade methods.
Thread isolation has been mentioned before: when the caller calls the service provider, it allocates an independent thread pool for each call request. When a failure occurs, at most the resources in this thread pool are consumed to avoid exhausting all the resources of the caller.
Fuse downgrade : It is to add a circuit breaker on the caller's side to count the calls to the service provider. If the failure rate of the call is too high, the service will be blown and access to the service provider will not be allowed.
It can be seen that whether it is thread isolation or fuse downgrade, it is the protection of the client (caller). It is necessary to perform thread isolation or service fusing when the caller initiates a remote call.
And our microservice remote calls are all based on Feign, so we need to integrate Feign with Sentinel, and implement thread isolation and service fuse in Feign.
3.1.FeignClient integrates Sentinel
In Spring Cloud, microservice calls are all implemented through Feign, so Feign and Sentinel must be integrated for client protection.
3.1.1. Modify the configuration and enable the sentinel function
Modify the application.yml file of OrderService to enable Feign's Sentinel function:
feign:
  sentinel:
    enabled: true # 开启feign对sentinel的支持

3.1.2. Writing failure downgrade logic
After a business failure, an error cannot be reported directly, but a friendly prompt or default result should be returned to the user. This is the failure downgrade logic.
Write downgrade logic for FeignClient after failure
① Method 1: FallbackClass, which cannot handle remote call exceptions
② Method 2: FallbackFactory, which can handle remote call exceptions, we choose this
Here we demonstrate the failure downgrade processing of the second method.
Step 1 : Define classes in the feeding-api project to implement FallbackFactory:
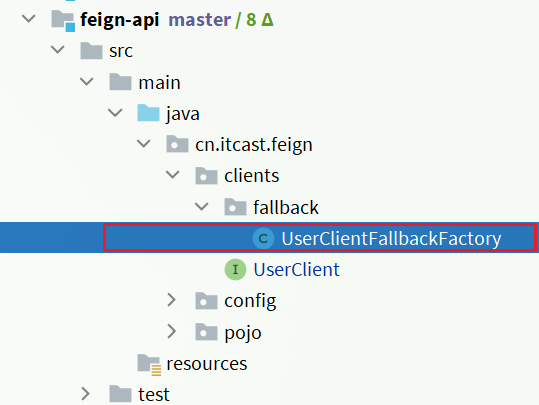
Code:
package cn.itcast.feign.clients.fallback;

import cn.itcast.feign.clients.UserClient;
import cn.itcast.feign.pojo.User;
import feign.hystrix.FallbackFactory;
import lombok.extern.slf4j.Slf4j;

@Slf4j
public class UserClientFallbackFactory implements FallbackFactory<UserClient> {


    @Override
    public UserClient create(Throwable throwable) {


        return new UserClient() {


            @Override
            public User findById(Long id) {


                log.error("查询用户异常", throwable);
                // 根据业务需求返回默认的数据,例如这里返回了空用户
                return new User();
            }
        };
    }
}
Step 2 : Register UserClientFallbackFactory as a Bean in the DefaultFeignConfiguration class in the feeding-api project:
@Bean
public UserClientFallbackFactory userClientFallbackFactory(){


    return new UserClientFallbackFactory();
}
Step 3 : Use UserClientFallbackFactory in the UserClient interface in the feeding-api project:
import cn.itcast.feign.clients.fallback.UserClientFallbackFactory;
import cn.itcast.feign.pojo.User;
import org.springframework.cloud.openfeign.FeignClient;
import org.springframework.web.bind.annotation.GetMapping;
import org.springframework.web.bind.annotation.PathVariable;

@FeignClient(value = "userservice", fallbackFactory = UserClientFallbackFactory.class)
public interface UserClient {


    @GetMapping("/user/{id}")
    User findById(@PathVariable("id") Long id);
}
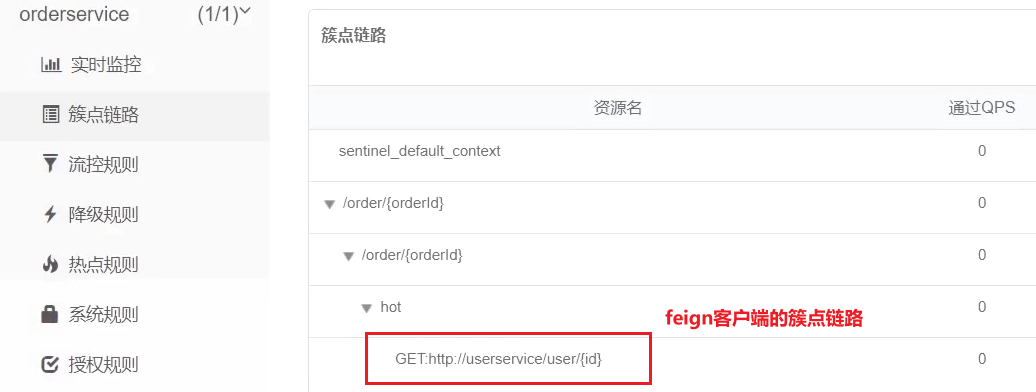
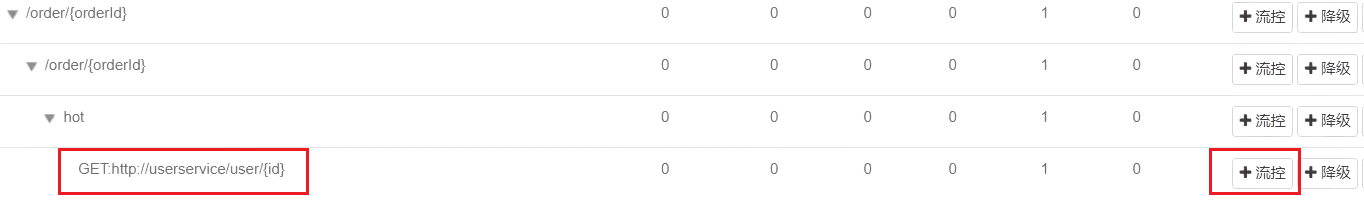
After restarting the service, visit the order query service once, and then check the sentinel console, you can see the new cluster point link:
3.1.3. Summary
Avalanche solutions supported by Sentinel:
- Thread isolation (silo wall mode)
- downgrade circuit breaker
Steps for Feign to integrate Sentinel:
- Configure in application.yml: feign.sentienl.enable=true
- Write a FallbackFactory for FeignClient and register it as a Bean
- Configure FallbackFactory to FeignClient
3.2. Thread isolation (bulkwall mode)
3.2.1. Implementation of thread isolation
Thread isolation can be achieved in two ways:
-
thread pool isolation
-
Semaphore isolation (Sentinel uses it by default)
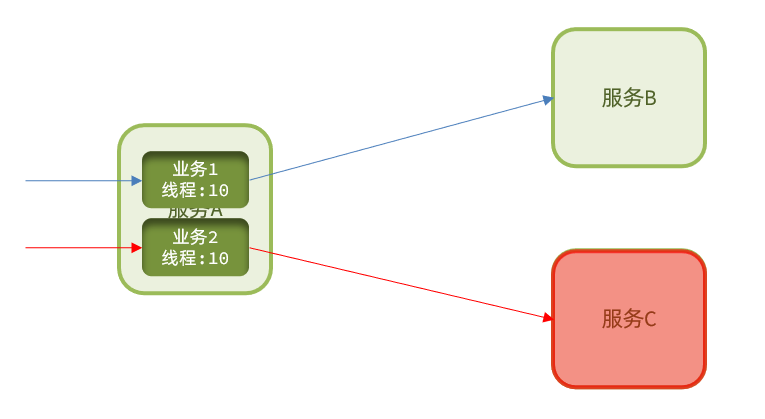
As shown in the figure:

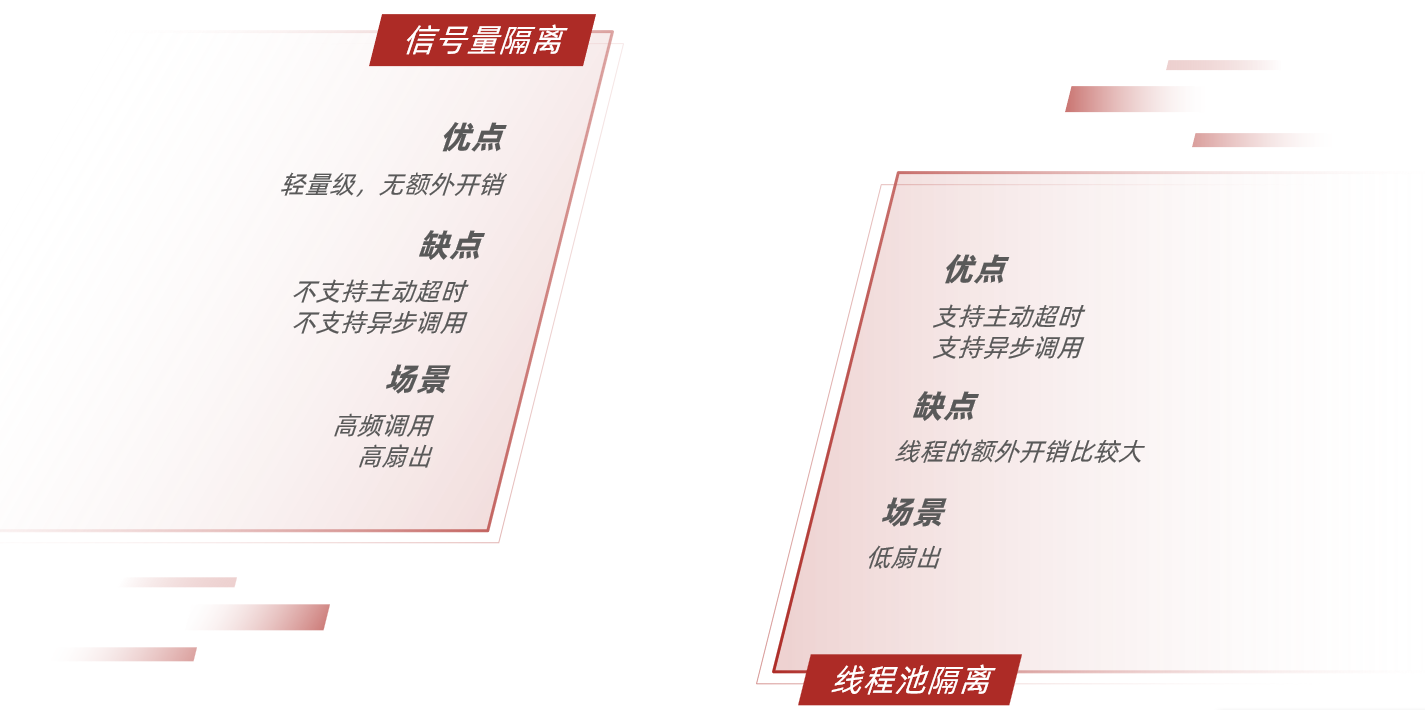
thread pool isolation : assign a thread pool to each service call business, and use the thread pool itself to achieve the isolation effect
Semaphore isolation : Instead of creating a thread pool, it uses a counter mode to record the number of threads used by the business. When the upper limit of the semaphore is reached, new requests are prohibited.
Pros and cons of both:
3.2.2. Thread isolation of sentinel
Instructions for use :
When adding a throttling rule, you can choose two threshold types:
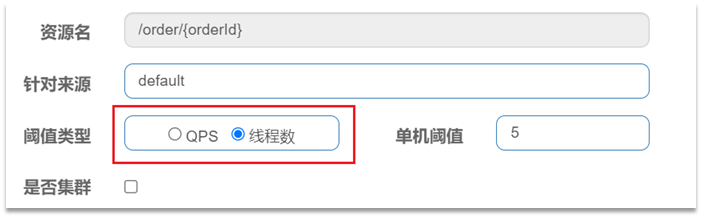
-
QPS: It is the number of requests per second, which has been demonstrated in the quick start
-
Number of threads: It is the maximum number of tomcat threads that can be used by this resource. That is, by limiting the number of threads, thread isolation (bulkwall mode) is achieved.
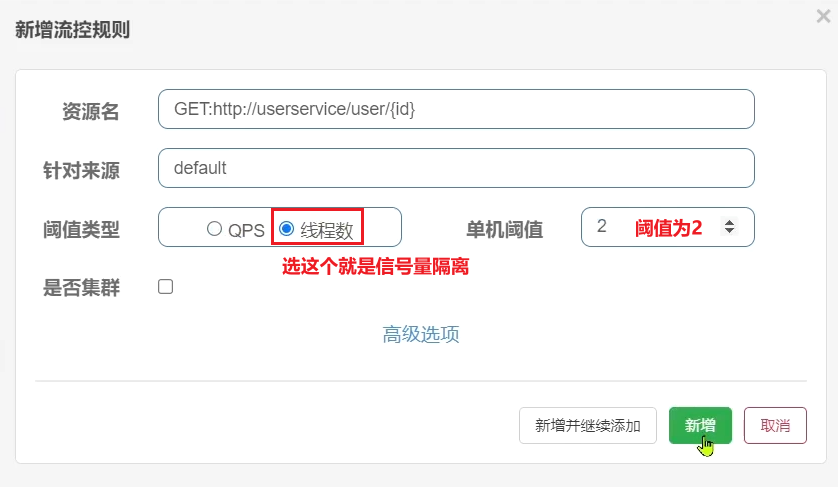
Case requirements : Set flow control rules for the query user interface of UserClient in the order-service service, and the number of threads cannot exceed 2. Then use jemeter to test.
1) Configure isolation rules
Select the flow control button behind the feign interface:
Fill out the form:
2) Jmeter test
Select "Threshold Type - Number of Threads < 2":
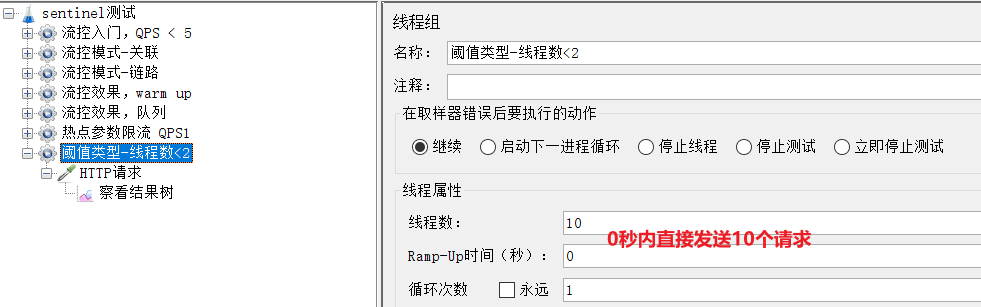
10 requests occur at a time, there is a high probability that the number of concurrent threads exceeds 2, and the excess requests will follow the previously defined failure degradation logic.
Check the running results:
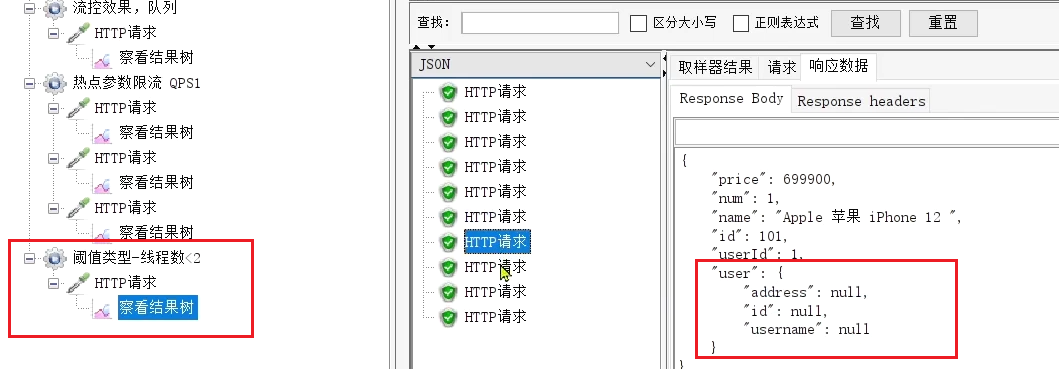
It is found that although the results are all passed, the response to some requests is the null information returned by the downgrade.
3.2.3. Summary
What are the two means of thread isolation?
-
Semaphore isolation
-
thread pool isolation
What are the characteristics of semaphore isolation?
- Based on the counter mode, simple and low overhead
What are the characteristics of thread pool isolation?
- Based on the thread pool mode, there is additional overhead, but the isolation control is stronger
3.3. Fuse downgrade
Fuse downgrade is an important means to solve the avalanche problem. The idea is that the circuit breaker counts the abnormal proportion of service calls and the proportion of slow requests, and if the threshold is exceeded, the service will be broken . That is, all requests to access the service are intercepted; and when the service is restored, the circuit breaker will release the request to access the service.
The control of fusing and release of the circuit breaker is accomplished through a state machine:
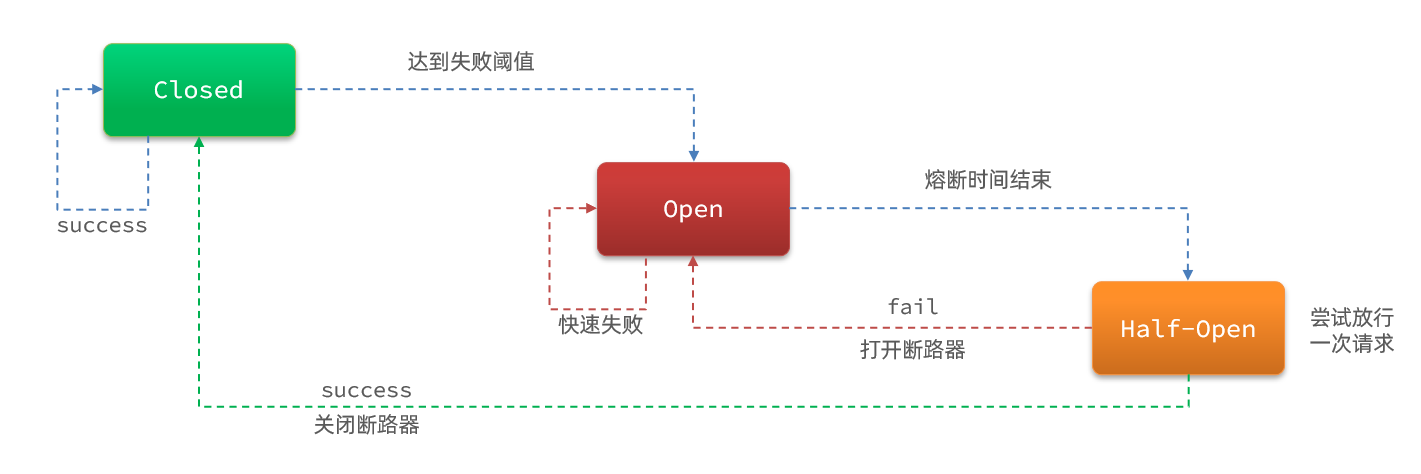
the state machine includes three states:
- closed: closed state, the circuit breaker releases all requests, and starts to count the proportion of exceptions and slow requests. If the threshold is exceeded, switch to the open state
- open: In the open state, the service call is interrupted , and the request to access the interrupted service will be rejected, fail fast, and go directly to the downgrade logic. After 5 seconds in the Open state, it will enter the half-open state
- half-open: In the half-open state, a request is released, and the next operation is judged according to the execution result.
- The request is successful: switch to the closed state
- Request failed: switch to open state
There are three types of circuit breaker fusing strategies: slow call, abnormal ratio, abnormal number
3.3.1. Slow calls
Slow call : A request whose service response time (RT) is longer than the specified time is considered a slow call request. Within the specified time, if the number of requests exceeds the set minimum number and the proportion of slow calls is greater than the set threshold, a circuit breaker will be triggered.
For example:
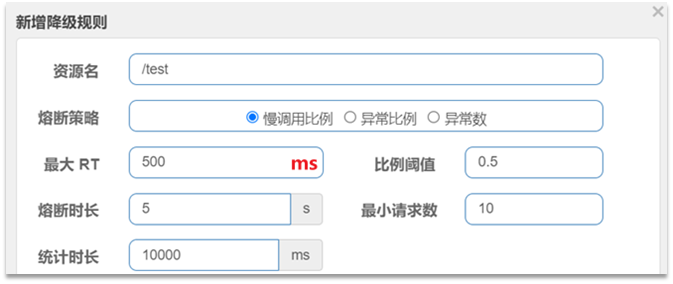
Interpretation: Calls with an RT of more than 500ms are slow calls. Count the requests within the last 10,000ms. If the number of requests exceeds 10 and the proportion of slow calls is not less than 0.5, a circuit breaker will be triggered, and the circuit breaker will last for 5 seconds. Then enter the half-open state and release a request for testing.
Case
Requirements: Set downgrading rules for the query user interface of UserClient, the RT threshold of slow calls is 50ms, the statistics time is 1 second, the minimum number of requests is 5, the failure threshold ratio is 0.4, and the fuse duration is 5
1) Set slow call
Modify the service of the /user/{id} interface in user-service. Simulate a delay time by dormancy:
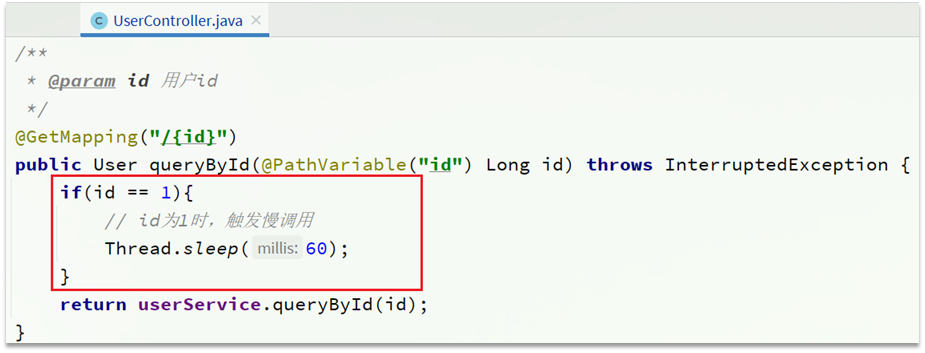
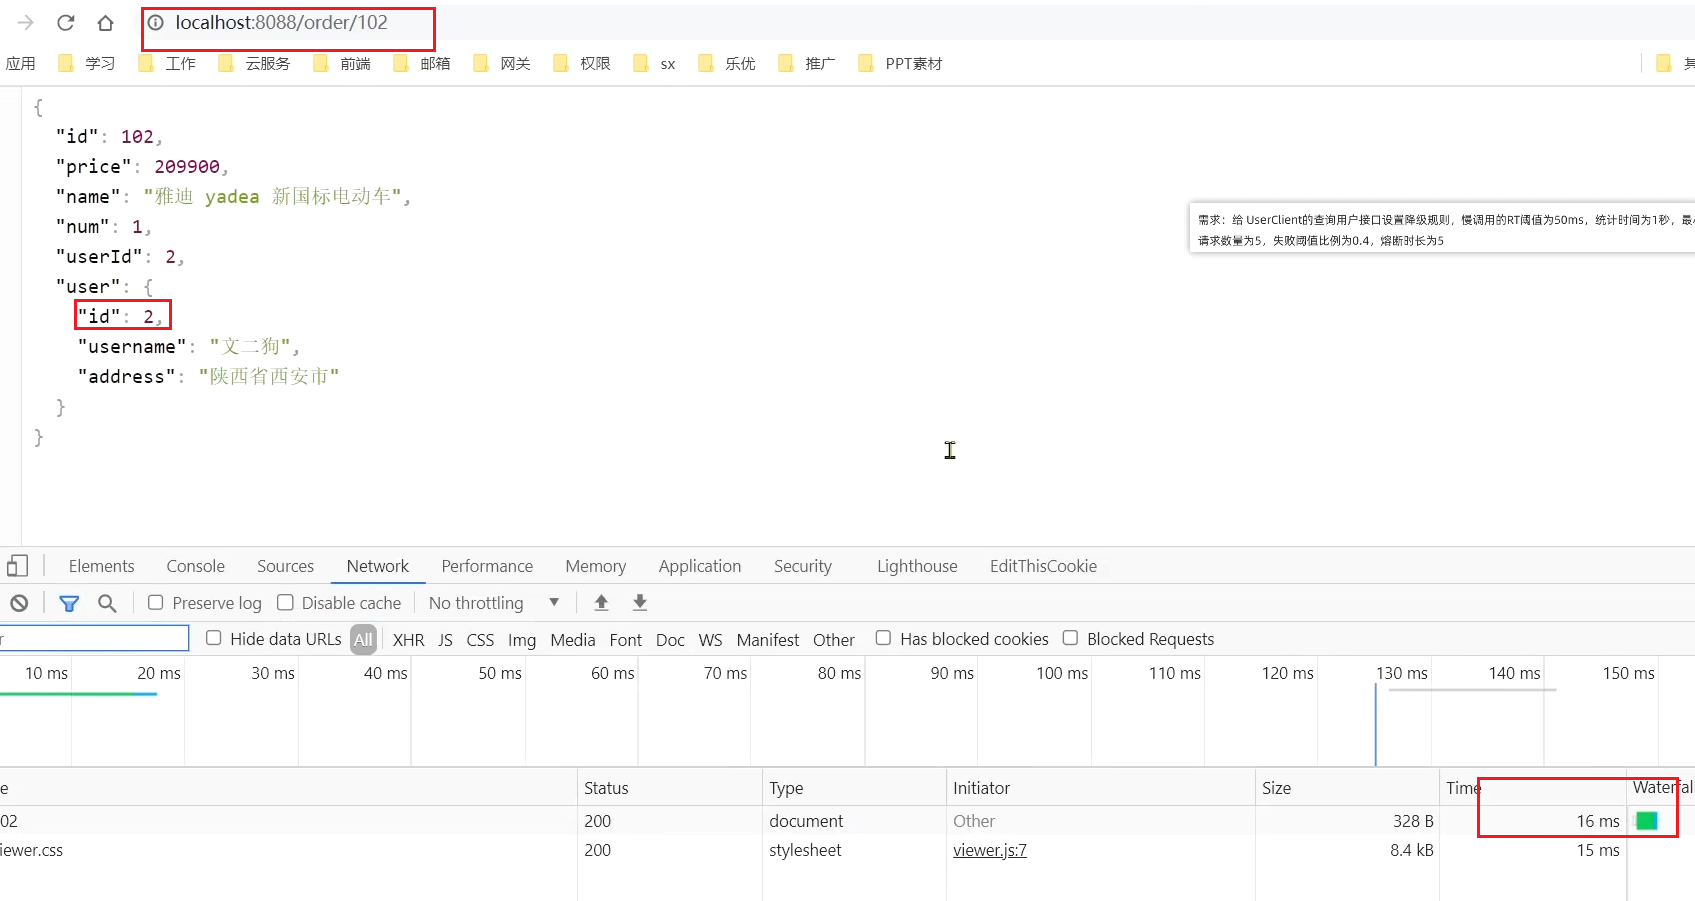
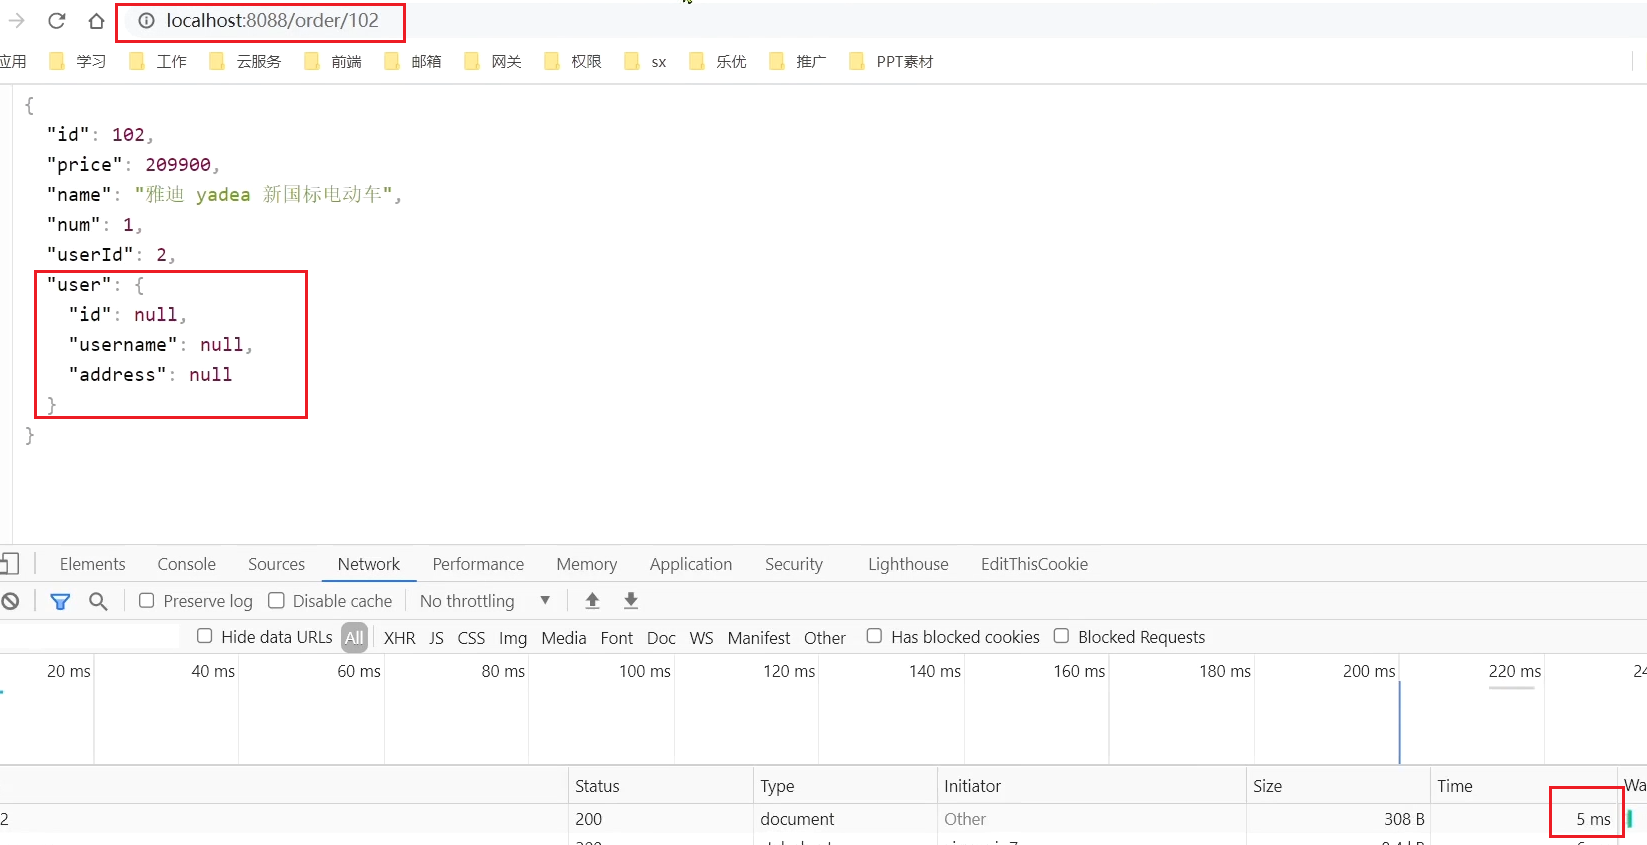
At this time, the order with orderId=101 is associated with the user with id 1, and the calling time is 60ms; the order with
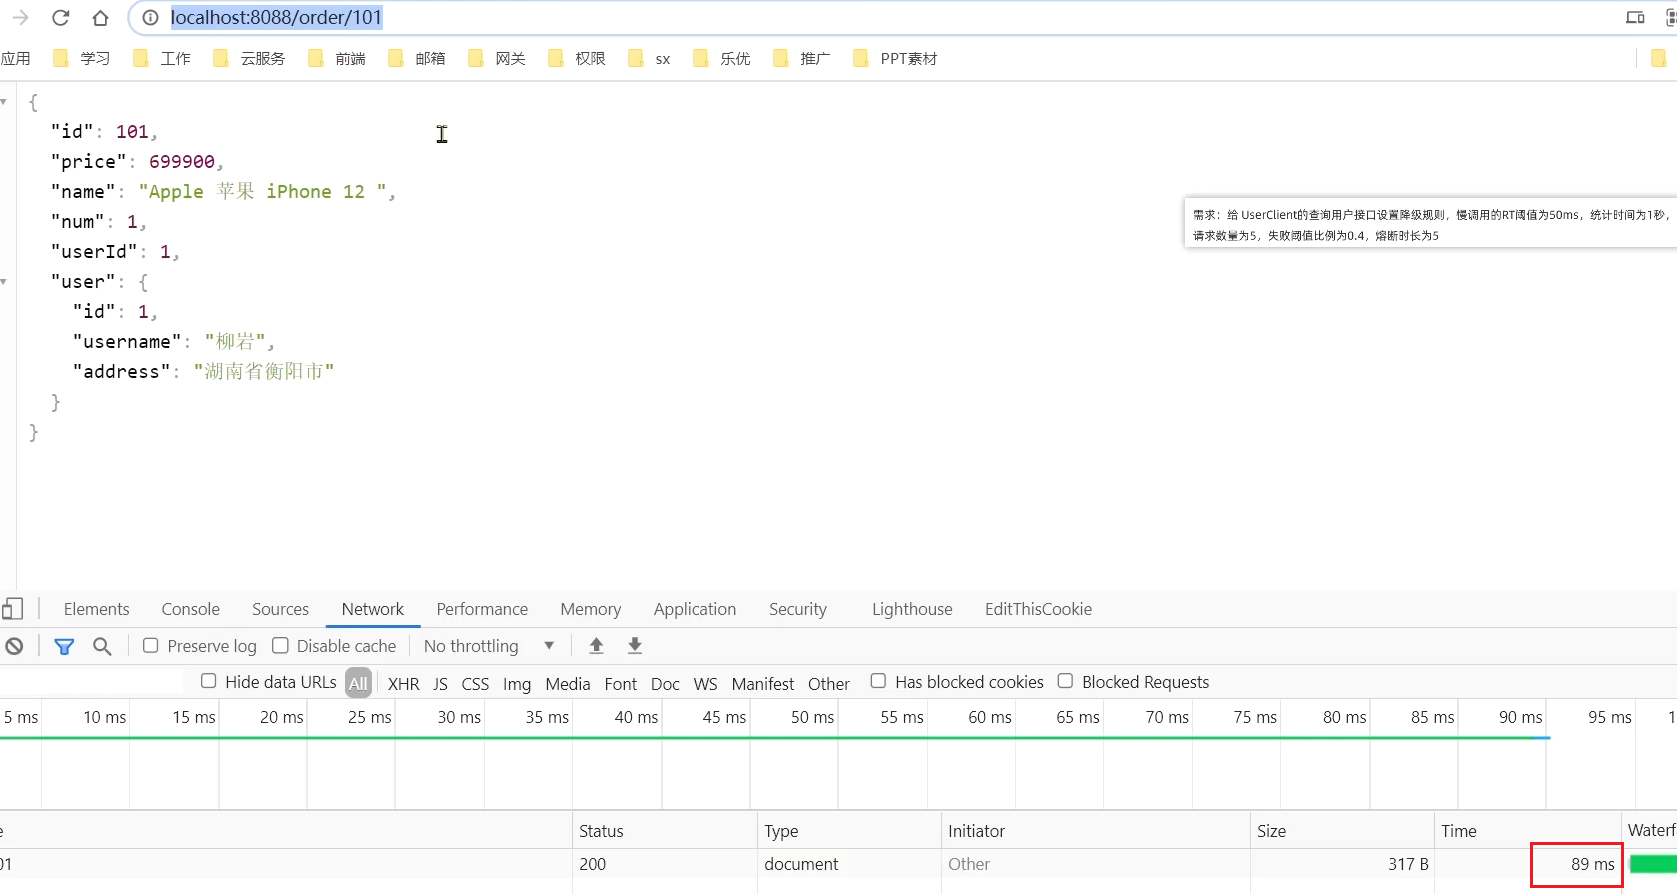
orderId=102 is associated with the user with id 2, and the calling time is very short ;
2) Set fuse rules
First delete the previous flow control rules to prevent any impact.

Next, set the downgrade rules for the feign interface:

Rules:
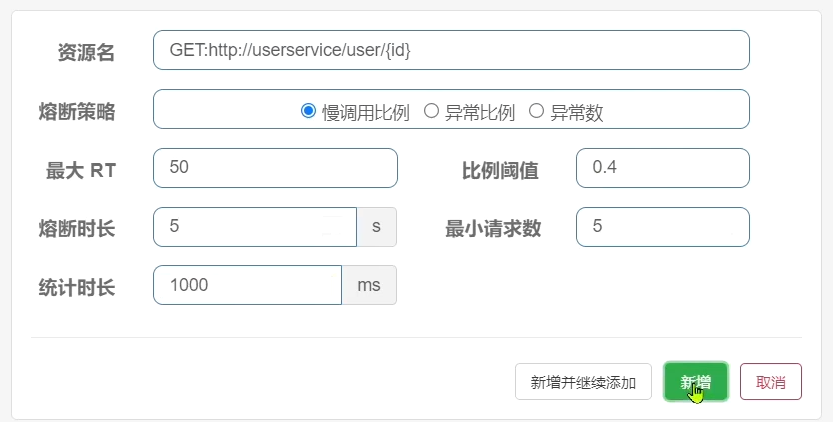
Requests exceeding 50ms will be considered slow requests
3) test
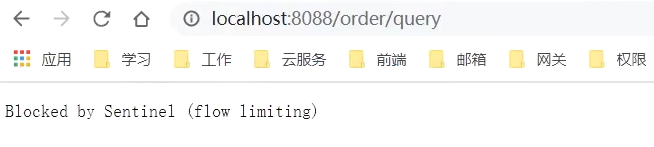
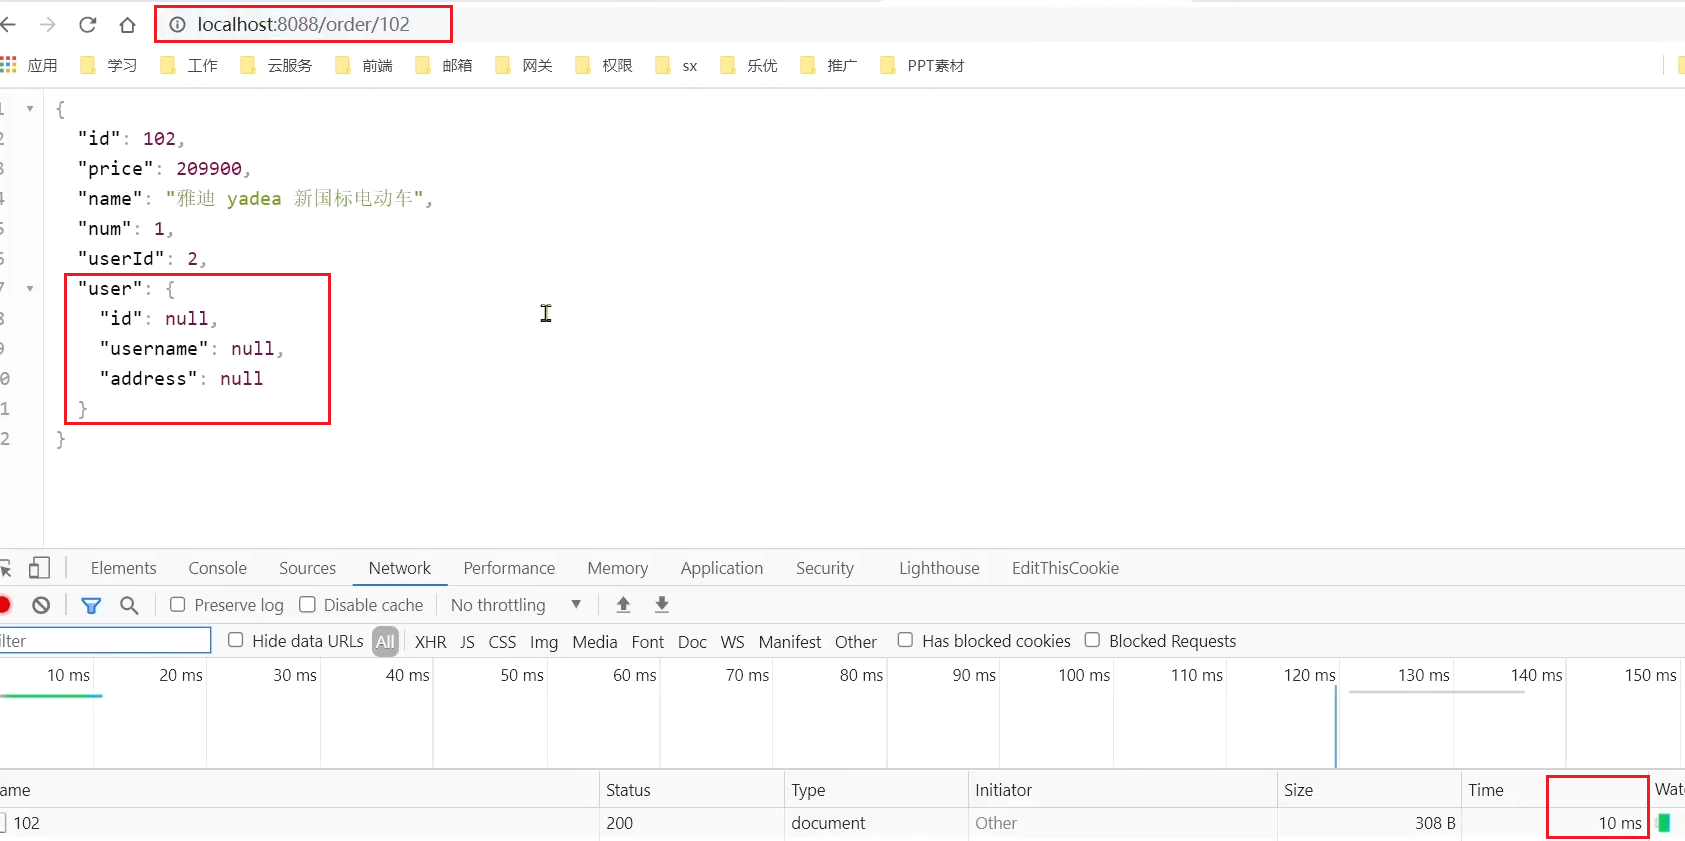
Visit in the browser: http://localhost:8088/order/101, quickly refresh 5 times, you can find: the
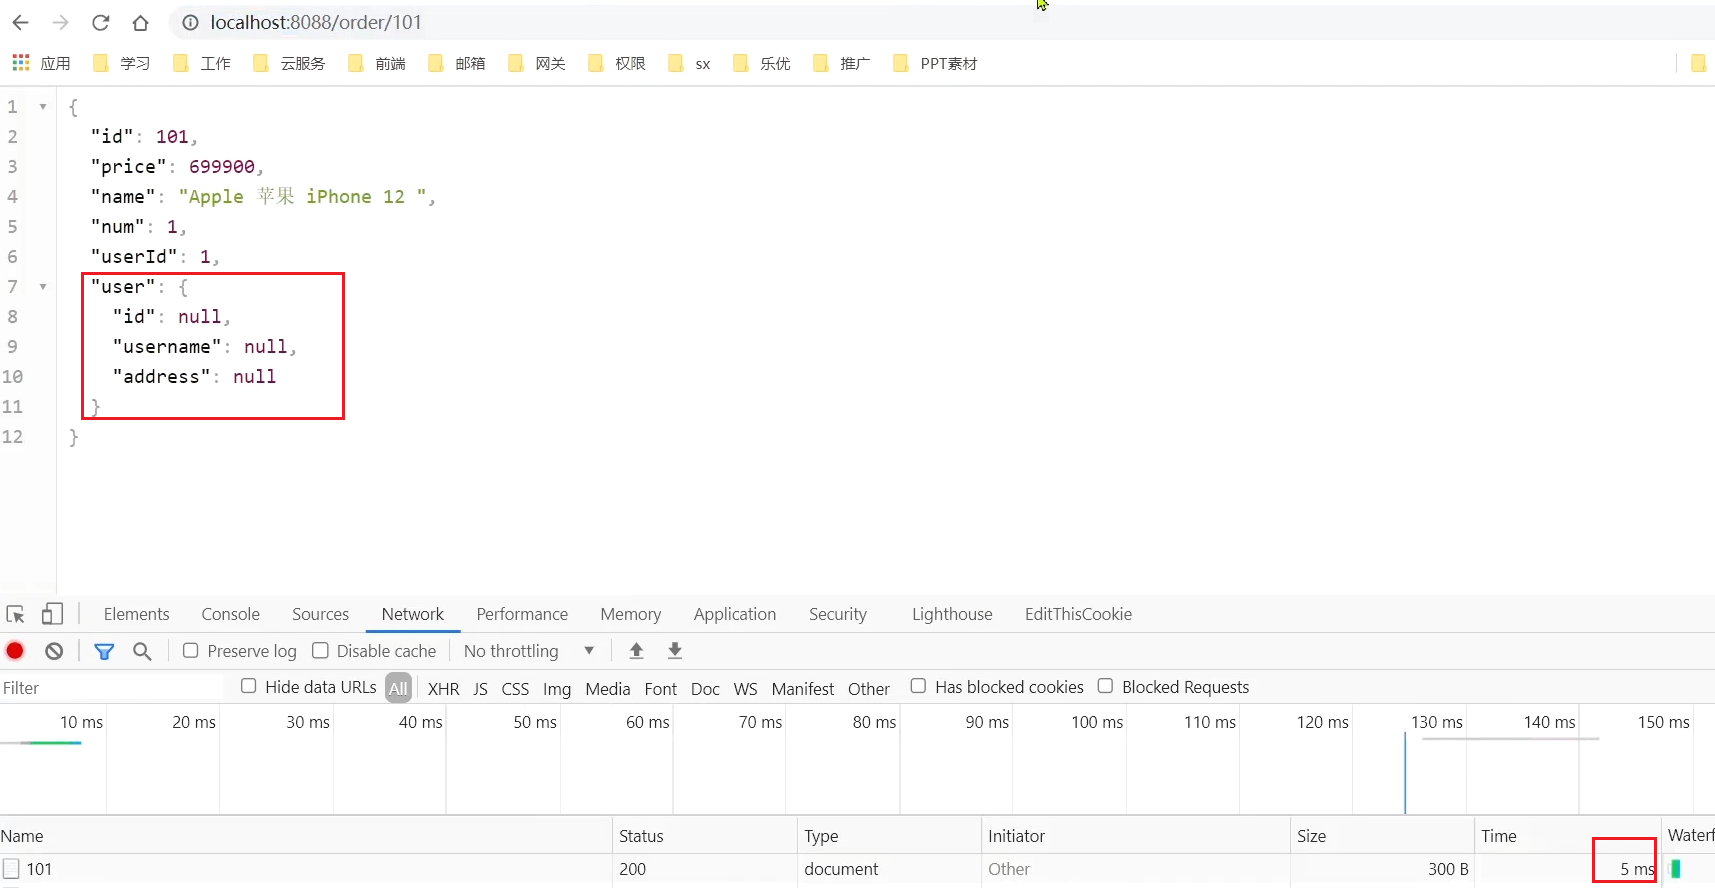
circuit breaker is triggered, the request duration is shortened to 5ms, it fails quickly, and it goes through the degradation logic, returning null
Access in the browser: http://localhost:8088/order/102, it was also blown:
3.3.2. Abnormal ratio, abnormal number
Abnormal ratio or abnormal number : Count calls within a specified time period. If the number of calls exceeds the specified number of requests, and the proportion of abnormalities reaches the set ratio threshold (or exceeds the specified abnormal number), a circuit breaker will be triggered.
For example, an unusual scale setting:
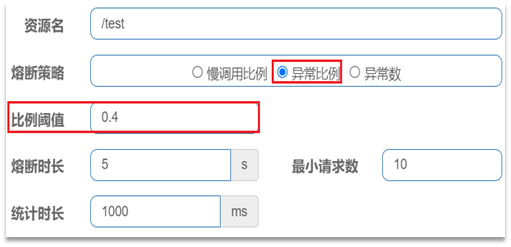
Interpretation: Count the requests within the last 1000ms. If the number of requests exceeds 10 and the abnormality ratio is not less than 0.4, a circuit breaker will be triggered.
An exception number setting:
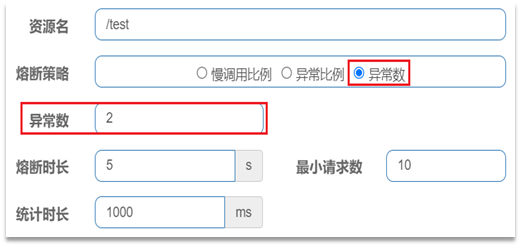
Interpretation: Count the requests within the last 1000ms. If the number of requests exceeds 10 and the proportion of exceptions is not less than 2, a circuit breaker will be triggered.
the case
Requirements: Set downgrade rules for UserClient's query user interface, the statistics time is 1 second, the minimum number of requests is 5, the failure threshold ratio is 0.4, and the fuse duration is 5s
1) Set exception request
First, modify the business of the interface /user/{id} in user-service. Manually throw an exception to trigger the fuse of the abnormal ratio:

that is, when the id is 2, an exception will be triggered
Let's visit
http://localhost:8080/order/102
Throw an exception

2) Set fuse rules
Delete the previous circuit breaker rules

Next, set the downgrading rules for the feign interface:

Rule:
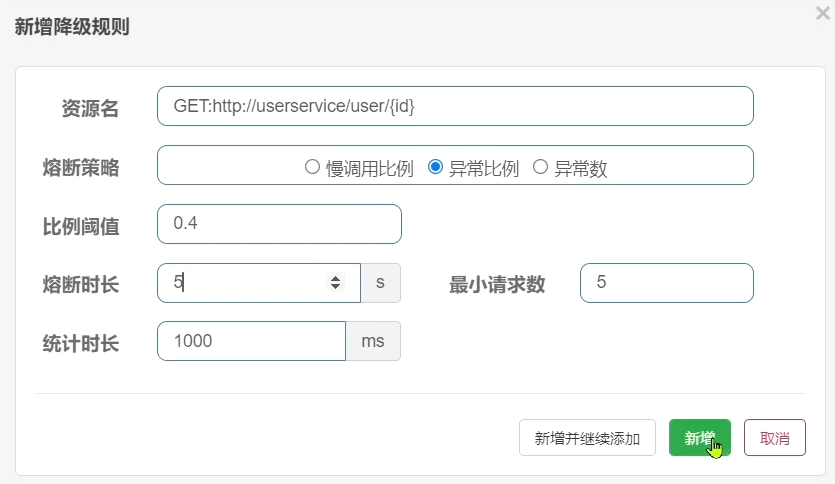
In 5 requests, as long as the exception ratio exceeds 0.4, that is, there are more than 2 exceptions, the circuit breaker will be triggered.
3) test
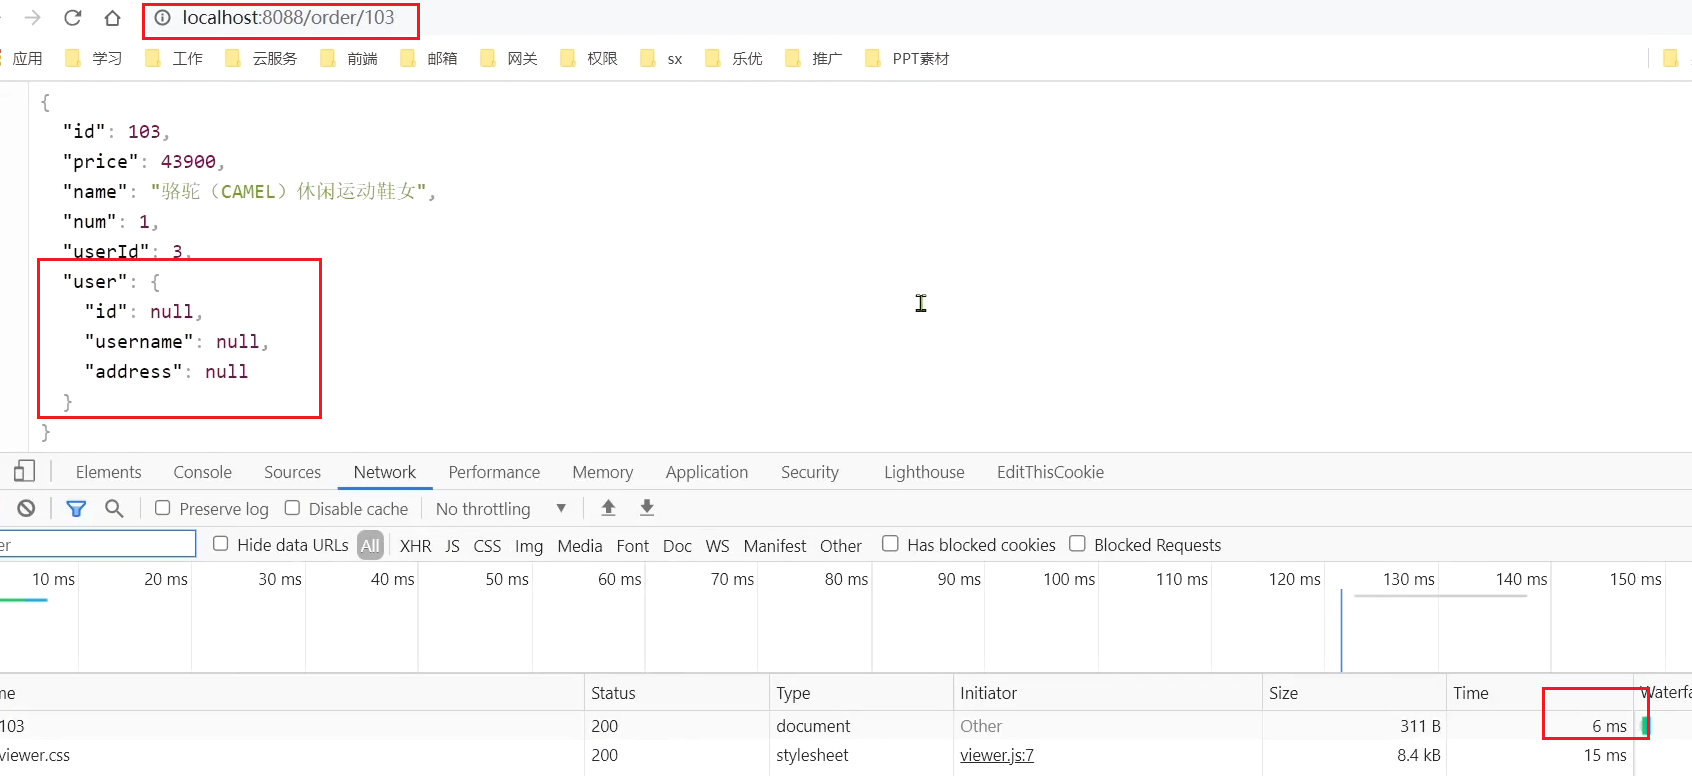
Quickly visit in the browser: http://localhost:8088/order/102, refresh 5 times quickly, and trigger a circuit breaker: At
this point, we go to visit 103, which should have been normal:
Summary:
What are the strategies for Sentinel circuit breaker downgrade?
● Slow Call ratio: Calls exceeding the specified duration are slow calls, and the
proportion of slow
calls within the statistical unit duration will be cut off if it exceeds the threshold. Abnormal ratio: The proportion of abnormal calls within the statistical unit duration will be cut off if it
exceeds the threshold. The number of abnormal calls, if it exceeds the threshold, it will be blown
4. Authorization Rules
Authorization rules can judge and control the source of the requester.
4.1. Authorization Rules
4.1.1. Basic rules
Authorization rules can control the source of the caller, and there are two ways: white list and black list.
-
Whitelist: callers whose origin is in the whitelist are allowed to access
-
Blacklist: Callers whose origin is in the blacklist are not allowed to access
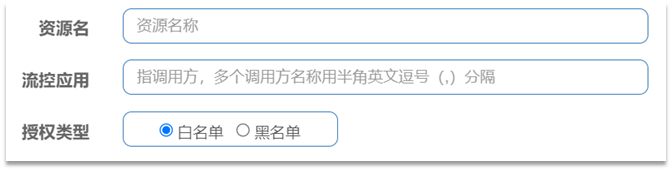
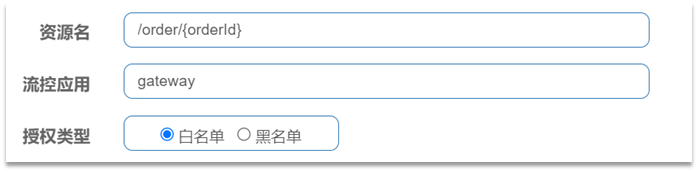
Click Authorization on the left menu to see the authorization rules:
-
Resource name: It is the protected resource, such as /order/{orderId}
-
Flow control application: is the list of sources,
- If the white list is checked, the sources in the list are allowed to access.
- If the blacklist is checked, the sources in the list are prohibited from accessing.
for example:
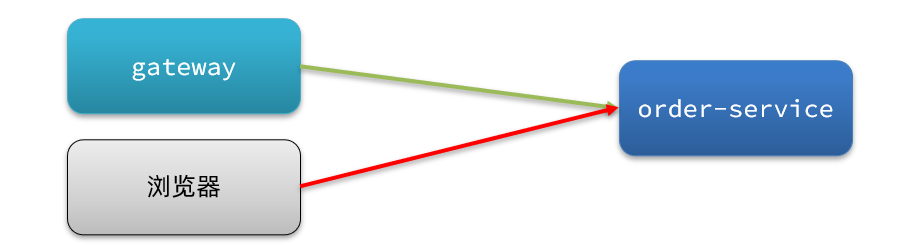
We allow requests from gateway to order-service, and do not allow browsers to access order-service, so the source name (origin) of the gateway must be filled in the white list .
4.1.2. How to get origin
Sentinel obtains the source of the request through the parseOrigin of the RequestOriginParser interface.
public interface RequestOriginParser {


    /**
     * 从请求request对象中获取origin,获取方式自定义
     */
    String parseOrigin(HttpServletRequest request);
}
The function of this method is to get the origin value of the requester from the request object and return it.
By default, no matter where the requester comes from, sentinel will always return the value default, which means that the source of all requests is considered to be the same value default.
Therefore, we need to customize the implementation of this interface so that different requests can return different origins .
For example, in the order-service service, we define an implementation class of RequestOriginParser:
package cn.itcast.order.sentinel;

import com.alibaba.csp.sentinel.adapter.spring.webmvc.callback.RequestOriginParser;
import org.springframework.stereotype.Component;
import org.springframework.util.StringUtils;

import javax.servlet.http.HttpServletRequest;

@Component
public class HeaderOriginParser implements RequestOriginParser {


    @Override
    public String parseOrigin(HttpServletRequest request) {


        // 1.获取请求头
        String origin = request.getHeader("origin");
        // 2.非空判断
        if (StringUtils.isEmpty(origin)) {


            origin = "blank";
        }
        return origin;
    }
}
We will try to get the origin value from the request-header.
4.1.3. Add a request header to the gateway
Since the way to get the origin of the request is to get the origin value from the requests-header, we must make all requests routed from the gateway to the microservice have the origin header .
This needs to be realized by using a GatewayFilter learned before, AddRequestHeaderGatewayFilter.
Modify application.yml in the gateway service and add a defaultFilter:
spring:
  cloud:
    gateway:
      default-filters:
        - AddRequestHeader=origin,gateway
      routes:
       # ...略

In this way, all requests routed from the gateway will carry the origin header with the value gateway. Requests arriving at the microservice from elsewhere do not have this header.
After configuration, we restart Gateway and OrderService
access
http://localhost:8080/order/103
4.1.4. Configure authorization rules
Next, we add an authorization rule to allow requests whose origin value is gateway.

The configuration is as follows:
Now, we directly skip the gateway and access the order-service service:
access through the gateway:
we visit
http://localhost:8080/order/102
It was found that an error was reported directly

, and we accessed the gateway
http://localhost:10010/order/101?authorization=admin
Found that the access is correct

4.2. Custom exception results
By default, when current limiting, downgrading, or authorization interception occurs, an exception will be thrown to the caller. Abnormal results are flow limiting (current limiting). This is not friendly enough, and it is impossible to know whether it is current limiting, downgrading or authorized interception.
4.2.1. Exception types
And if you want to customize the return result when an exception occurs, you need to implement the BlockExceptionHandler interface:
public interface BlockExceptionHandler {


    /**
     * 处理请求被限流、降级、授权拦截时抛出的异常:BlockException
     */
    void handle(HttpServletRequest request, HttpServletResponse response, BlockException e) throws Exception;
}
This method has three parameters:
- HttpServletRequest request:request对象
- HttpServletResponse response:response对象
- BlockException e: the exception thrown when intercepted by sentinel
BlockException here contains several different subclasses:
| abnormal | illustrate |
|---|---|
| FlowException | Current limit exception |
| ParamFlowException | Abnormal hotspot parameter current limit |
| DegradeException | downgrade exception |
| AuthorityException | Authorization rule exception |
| SystemBlockException | System rule exception |
4.2.2. Custom exception handling
Next, we define a custom exception handling class in order-service:
package cn.itcast.order.sentinel;

import com.alibaba.csp.sentinel.adapter.spring.webmvc.callback.BlockExceptionHandler;
import com.alibaba.csp.sentinel.slots.block.BlockException;
import com.alibaba.csp.sentinel.slots.block.authority.AuthorityException;
import com.alibaba.csp.sentinel.slots.block.degrade.DegradeException;
import com.alibaba.csp.sentinel.slots.block.flow.FlowException;
import com.alibaba.csp.sentinel.slots.block.flow.param.ParamFlowException;
import org.springframework.stereotype.Component;

import javax.servlet.http.HttpServletRequest;
import javax.servlet.http.HttpServletResponse;

@Component
public class SentinelExceptionHandler implements BlockExceptionHandler {


    @Override
    public void handle(HttpServletRequest request, HttpServletResponse response, BlockException e) throws Exception {


        String msg = "未知异常";
        int status = 429;

        if (e instanceof FlowException) {


            msg = "请求被限流了";
        } else if (e instanceof ParamFlowException) {


            msg = "请求被热点参数限流";
        } else if (e instanceof DegradeException) {


            msg = "请求被降级了";
        } else if (e instanceof AuthorityException) {


            msg = "没有权限访问";
            status = 401;
        }

        response.setContentType("application/json;charset=utf-8");
        response.setStatus(status);
        response.getWriter().println("{\"msg\": " + msg + ", \"status\": " + status + "}");
    }
}
Restart the test. In different scenarios, different exception messages will be returned.
First add flow control rules, set QPS = 1

and restart idea to clear the cache
. Visit
http://localhost:8080/order/103
Limiting:

Remember to delete the above rules after testing, and then configure the authorization rules

When authorization is intercepted:
visit here again
http://localhost:8080/order/103

5. Rule persistence
Now, all rules of sentinel are stored in memory, and all rules will be lost after restarting. In a production environment, we must ensure the persistence of these rules to avoid loss.
5.1. Rule management mode
Whether the rules can be persisted depends on the rule management mode. Sentinel supports three rule management modes:
- Original mode: The default mode of Sentinel, the rules are saved in memory, and the service will be lost after restarting the service.
- pull mode
- push mode
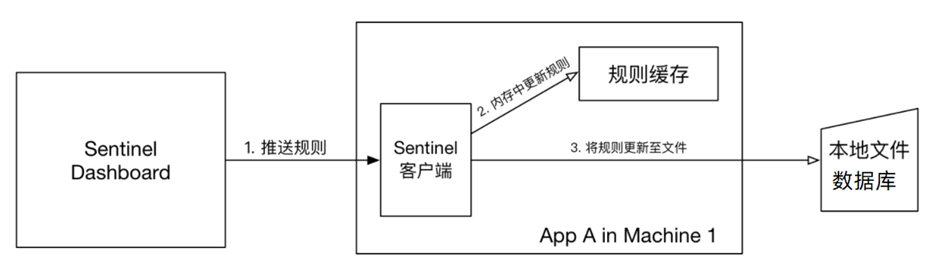
5.1.1. pull mode
Pull mode: The console pushes the configured rules to the Sentinel client, and the client saves the configured rules in a local file or database. In the future, we will regularly query local files or databases to update local rules.
Disadvantages: There are timeliness issues and data inconsistencies
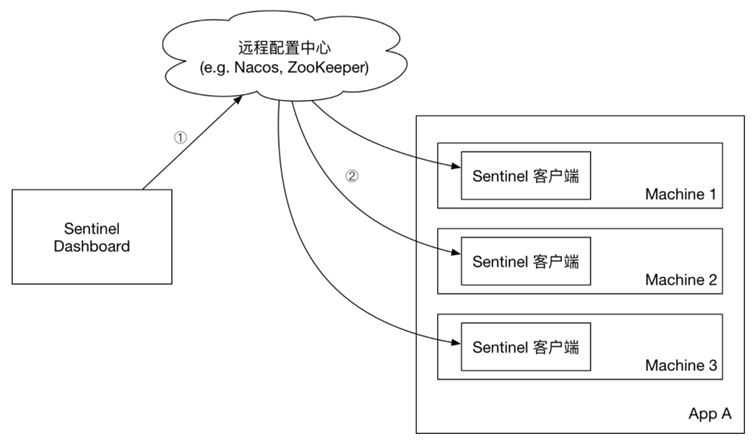
5.1.2. push mode
Push mode: The console pushes configuration rules to a remote configuration center, such as Nacos. The Sentinel client monitors Nacos, obtains push messages of configuration changes, and completes local configuration updates.
5.2. Realize the push mode
For detailed steps, please refer to "Persistence of Sentinel Rules" in the pre-class materials:
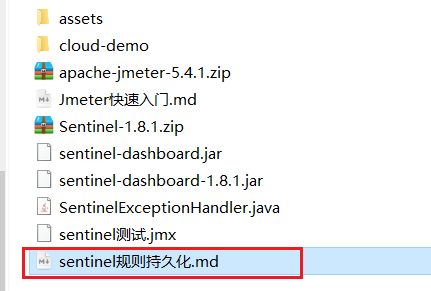
Sentinel rule persistence
1. Modify the order-service service
Modify OrderService to listen to the sentinel rule configuration in Nacos.
Specific steps are as follows:
1. Introduce dependencies
Introduce sentinel to monitor nacos dependencies in order-service:
<dependency>
    <groupId>com.alibaba.csp</groupId>
    <artifactId>sentinel-datasource-nacos</artifactId>
</dependency>
2. Configure nacos address
Configure the nacos address and monitor configuration information in the application.yml file in order-service:
spring:
  cloud:
    sentinel:
      datasource:
        flow:
          nacos:
            server-addr: localhost:8848 # nacos地址
            dataId: orderservice-flow-rules
            groupId: SENTINEL_GROUP
            rule-type: flow # 还可以是:degrade、authority、param-flow
Restart the order-service project after modification
2. Modify the source code of sentinel-dashboard
SentinelDashboard does not support nacos persistence by default, and the source code needs to be modified.
1. Unzip
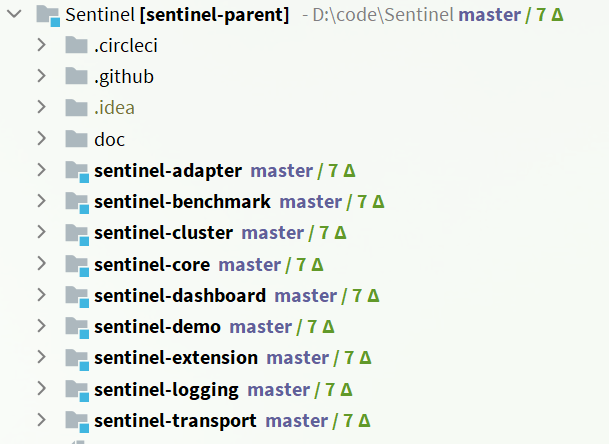
Unzip the sentinel source package in the pre-class materials:
Then open this project with IDEA, the structure is as follows:
2. Modify nacos dependencies
In the pom file of the sentinel-dashboard source code, nacos depends on the default scope of test, which can only be used during testing. Here it needs to be removed: remove the
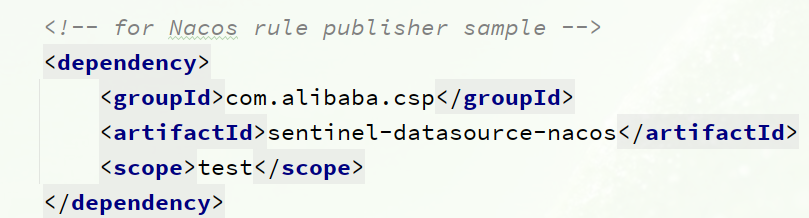
scope of sentinel-datasource-nacos dependency:
<dependency>
    <groupId>com.alibaba.csp</groupId>
    <artifactId>sentinel-datasource-nacos</artifactId>
</dependency>
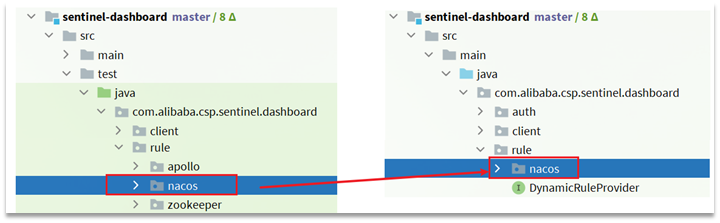
3. Add nacos support
Under the test package of sentinel-dashboard, support for nacos has been written, and we need to copy it to main.
4. Modify nacos address
Then, you also need to modify the NacosConfig class in the test code:
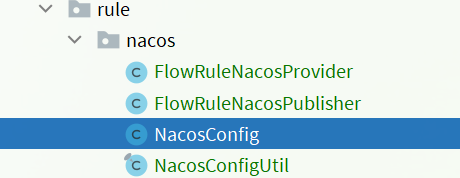
Modify the nacos address and let it read the configuration in application.properties:
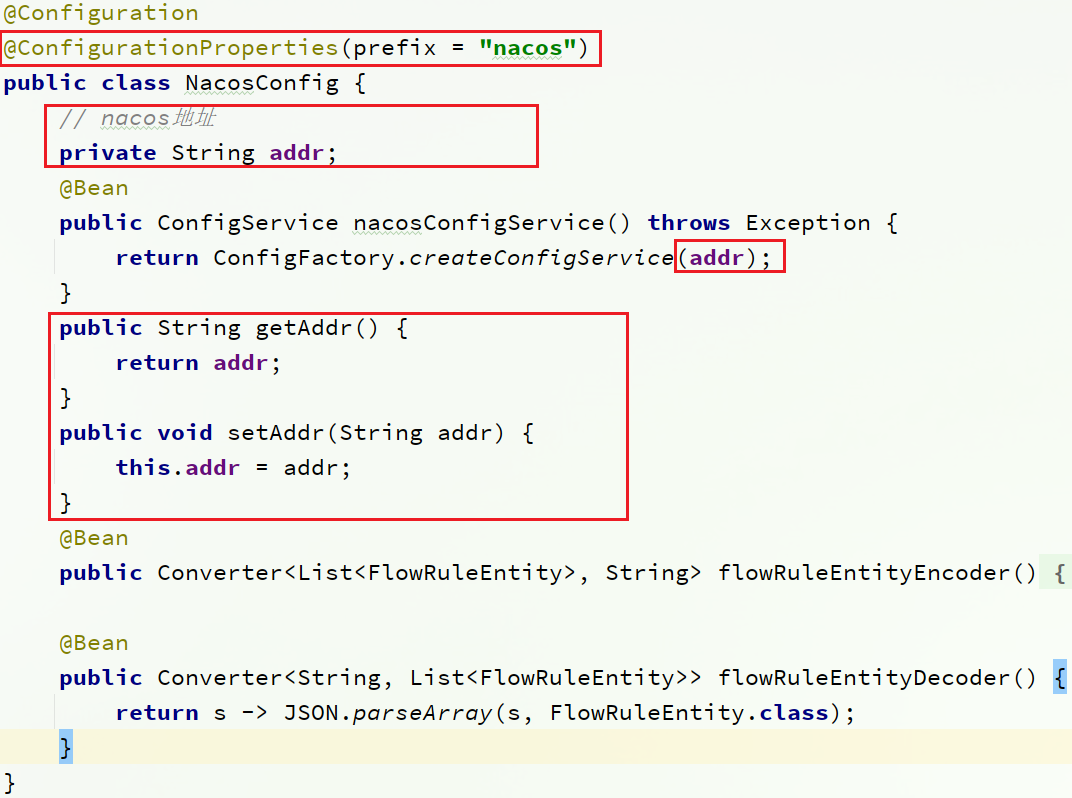
add the nacos address configuration in the application.properties of sentinel-dashboard:
nacos.addr=localhost:8848
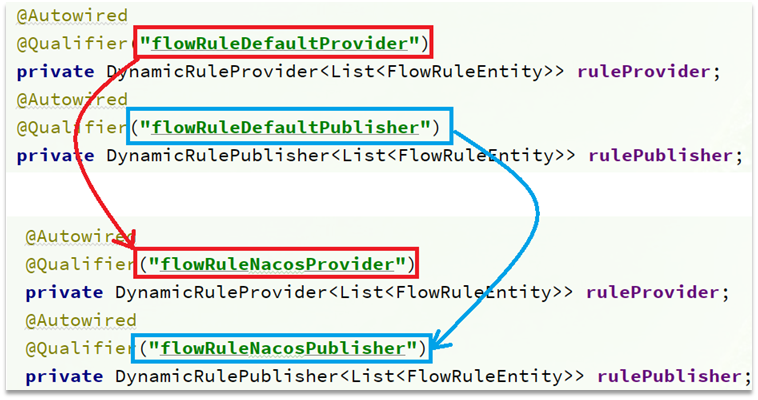
5. Configure nacos data source
In addition, it is also necessary to modify the FlowControllerV2 class under the com.alibaba.csp.sentinel.dashboard.controller.v2 package:
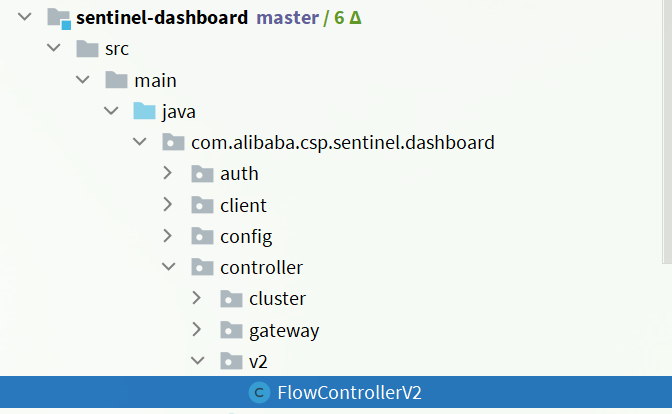
let the Nacos data source we added take effect:
6. Modify the front-end page
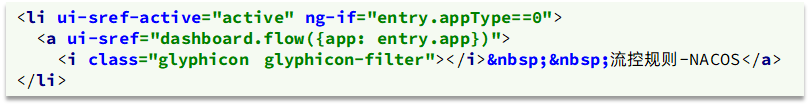
Next, modify the front-end page and add a menu that supports nacos.
Modify the sidebar.html file in the src/main/webapp/resources/app/scripts/directives/sidebar/ directory:

Turn on this part of the comment:
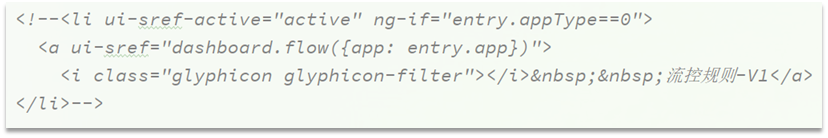
Modify the text in it:
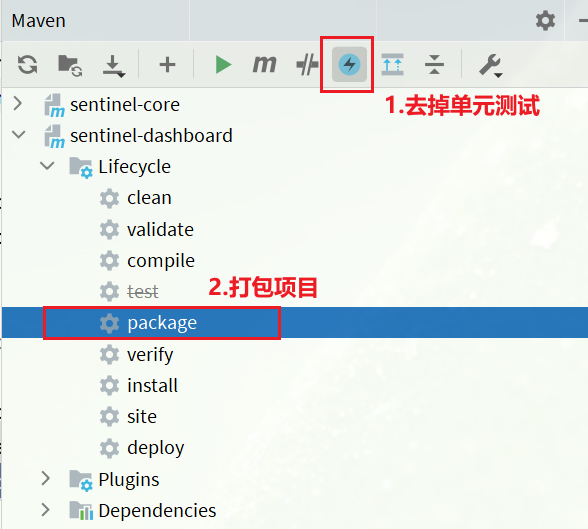
7. Recompile and package the project
Run the maven plug-in in IDEA, compile and package the modified Sentinel-Dashboard:
8. start
The startup method is the same as the official one:
java -jar sentinel-dashboard.jar
If you want to modify the nacos address, you need to add parameters:
Here we use the port packaged by the teacher in the project information

to change the port of the order-service configuration file, because the teacher’s jar package is port 8080

Then start the jar package
java -jar -Dnacos.addr=localhost:8848 sentinel-dashboard.jar
Open a browser to log in to sentinel
http://localhost:8080/#/login

Visit first, load the cluster point link
http://localhost:8088/order/103
Refresh sentinel (here you can restart IDEA)
access
http://localhost:8080/#/dashboard

Log in to sentinel again after clearing it, and find that there are more flow control rules

Click to add flow control rules

resource name
/order/{orderId}

access
http://localhost:8848/nacos/
I found that there is an extra configuration list, which is our current limiting rule

Visit 2 times
http://localhost:8088/order/101

Let's restart IDEA and see if the current limiting rule disappears

and visit again
http://localhost:8088/order/101
It is found that the current limiting rule has not disappeared, and the persistence has been realized
