Many times you will encounter such a problem: some articles report the experimental results in the chart, but do not mark the specific experimental values; if Xiaoyao obtains specific values, you have to use a ruler to measure them. . .
Here is a website recommended that can help you estimate the horizontal and vertical coordinates corresponding to each data point in a chart; it is useful in some cases (at least without a ruler and naked eyes to estimate).
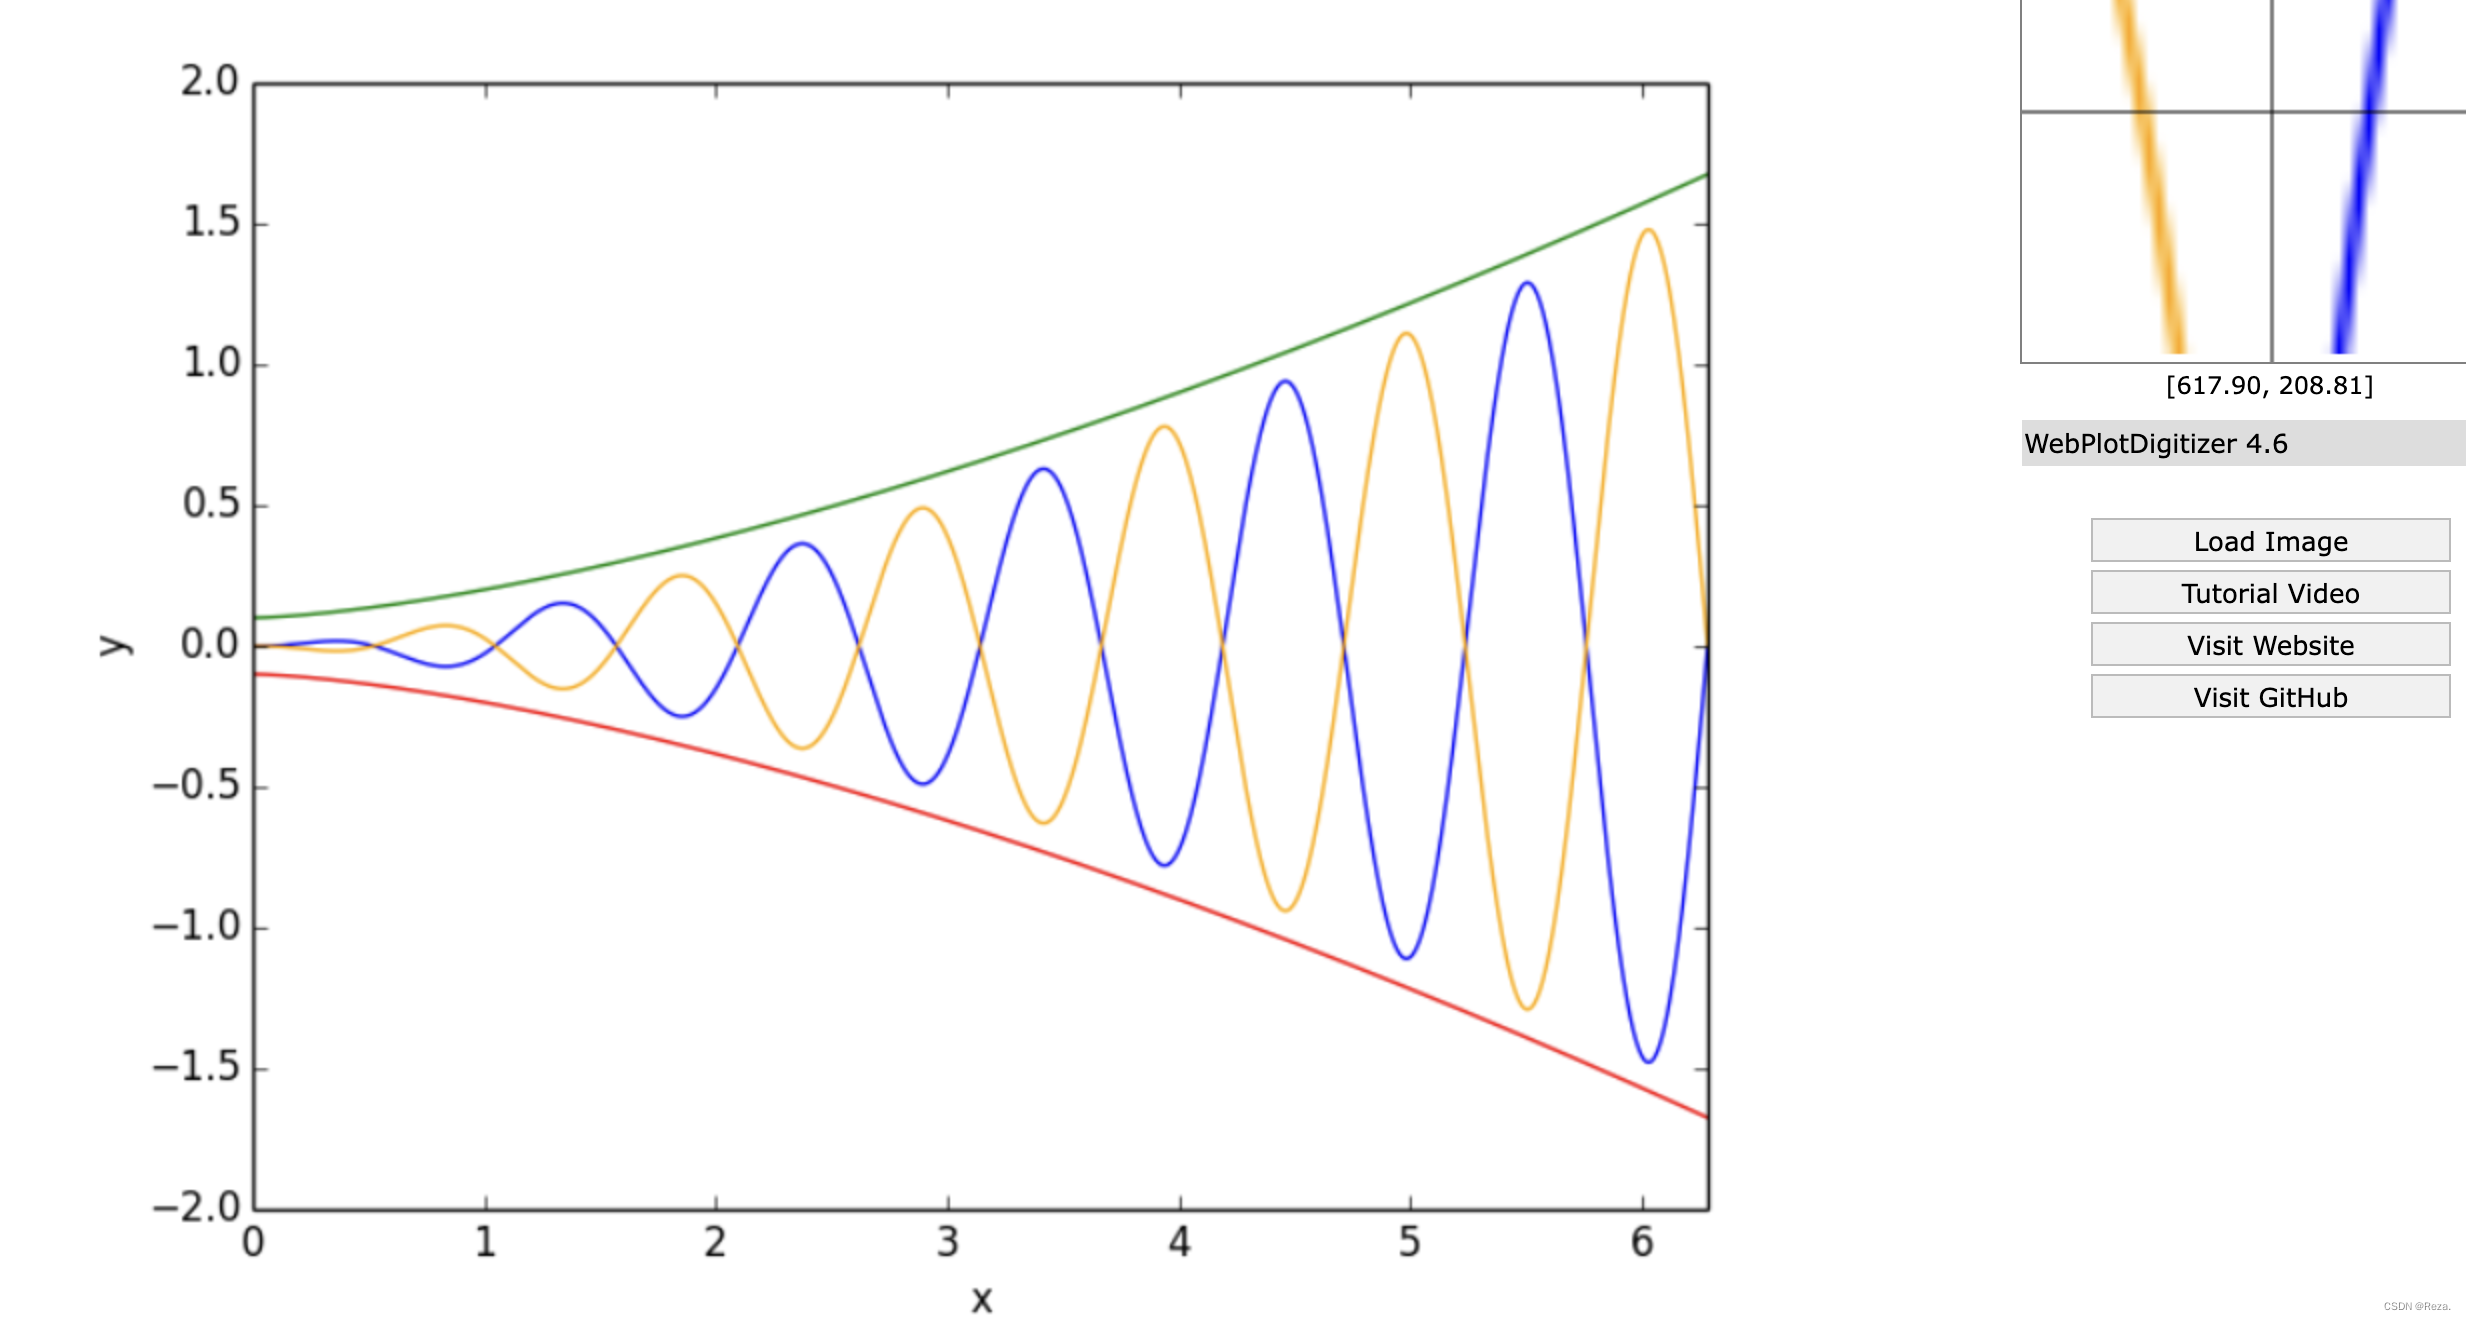
- Website: https://apps.automeris.io/wpd/
- YouTube Tutorial: https://www.youtube.com/watch?v=LY3uNaij9Tg