Question B Urban rail transit train timetable optimization
The first impression of urban rail transit train timetable optimization makes me think of the most classic probability problem in probability theory. Two people, A and B, arrive at a place and one person will only stay for 15 minutes. What is the probability that the two want to meet each other? There will always be a feeling of déjà vu. Back to the topic of the problem,
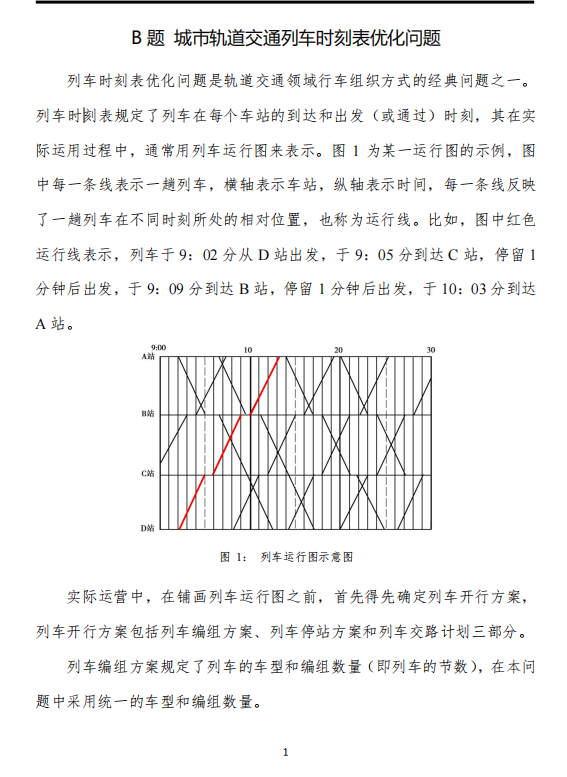
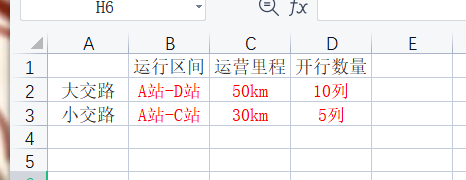
A schematic diagram of the train operation diagram is given. You can read through the setting example of the problem, and it is easy to understand. Some difficulties that may not be seen at present, you can discuss them. The background of the question is introduced. If we need to choose question B, we need to study it word by word. In this kind of relatively large competition, there will be no nonsense in the question. Therefore, once you choose a certain topic, there will be no harm in studying it sentence by sentence. Among them, the title also clearly gives the objective function given by =, which includes two parts, and the cost includes two parts.
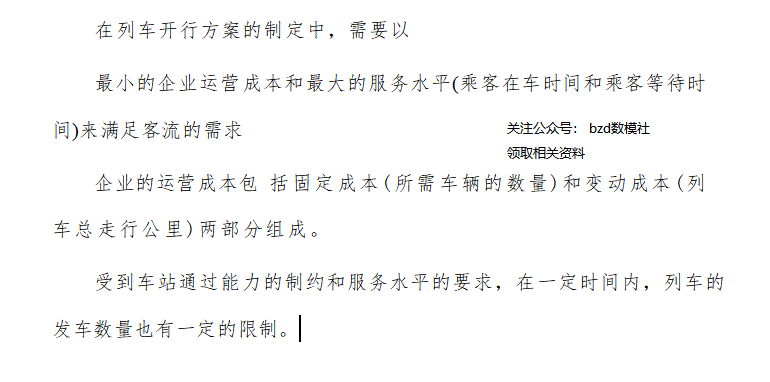
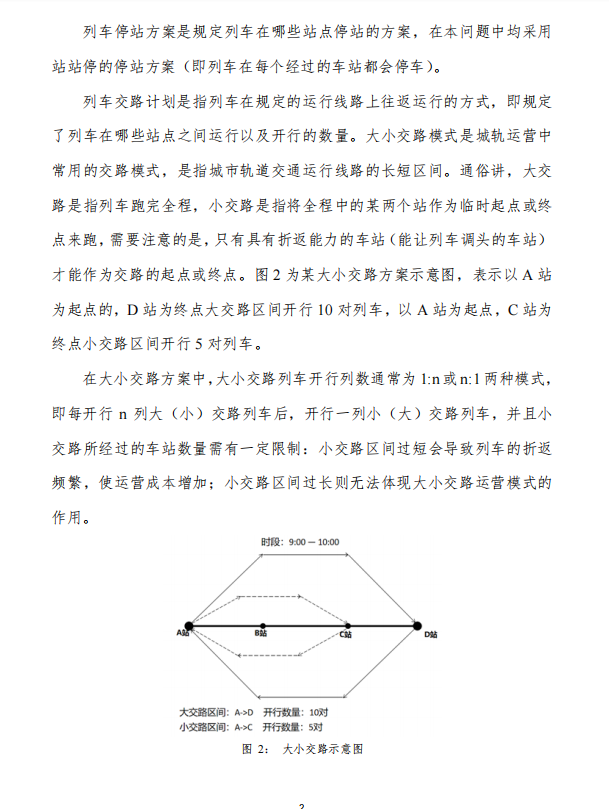
Question 1 : Under the condition of satisfying the demand of passenger flow, and aiming at minimizing the operating cost of the enterprise and maximizing the service level, formulate a train operation plan. That is to determine the running number of trains in the section of large crossing roads, the running interval and running number of small crossing roads. (The output format is detailed in Appendix 6)
Question 1. Under the condition of meeting the demand of passenger flow, with the goal of minimizing the operating cost of the enterprise and maximizing the service level, formulate a train operation plan. For the question setting, the constraints are obvious, and I personally think that it is mainly the choice of decision variables. How to choose a better decision variable can specifically and simply express our dual objectives and various constraints. Here, my personal suggestion is to refer to the output example and set the corresponding decision variables. We need to output the operating mileage and the number of lines opened, and we can set the decision variables accordingly.
Question 2 : Under the train operation plan formulated in Question 1, we also aim to minimize the operating cost of the enterprise, maximize the service level and meet the passenger flow demand as much as possible, and formulate a parallel operation diagram with equal intervals. (For details on the output format, please refer to Attachment 7, and upload Attachment 7 to the competition system separately)
Problem 2: Formulate parallel operation diagrams with equal intervals. This requires changing the model established in our problem 1 and solving it with decision variables about operations.
Question 3: What good methods or suggestions does your team have for reducing operating costs and improving service levels? Based on passenger flow and station data, provide corresponding quantitative analysis support.
For the entire problem B, the difficulty lies in the establishment of the model of problem 1, and the model can be established to solve it. The biggest problem is mainly the accuracy of the answer. For this kind of purely open-ended topic, the accuracy of the results is very high, so once our results have a little deviation, our awards will change a lot. Compared with question B, the results of question A are easier to obtain, and there should be more public results for question A on the Internet. I will share some public calculation results on the Internet with you later.