import matplotlib.pyplot as plt
a = np.loadtxt('ex1data2.txt')
print(a.shape)
X=a[:,0:2]
y=a[:,2:3]
m=y.shape[0]
l=X.shape[1]
print(m,l)
X0=np.ones(m)
def featureNormalize(X,l):
X_norm=X
mu=np.mean(X,0)
print(mu)
sigma=np.std(X)
X_norm=(X-mu)/sigma
print(X_norm.shape)
return X_norm
X_norm=featureNormalize(X,l)
X=X_norm
#Merge two arrays into one array and add another array to the right: np.c_[a,b] or np.hstack[a,b]
X=np.c_[X0,X]
n= X.shape[1]
print(y.shape)
print(n)
print(type(X))
#Merge two arrays into one array, merge up and down: np.r_[a,b] or np.vstack[a,b]
theta=np.zeros((n,1))
alpha=1
iterations=8500
def gradientdescentmulti(theta,alpha,iterations,X,y,m):
J_h=np.zeros((iterations,1))
for i in range (0,iterations):
y_hat=np.dot(X,theta)
bb=np.dot(X.transpose(),(y_hat-y))
theta=theta-alpha/m * bbJ=sum((y_hat-y)**2)/(2*m)
J_h[i,:]=J
return theta,J_h
(theta,J_h)=gradientdescentmulti(theta,alpha,iterations,X,y,m)
print(theta)
print(J_h)
x2=np.arange(iterations)
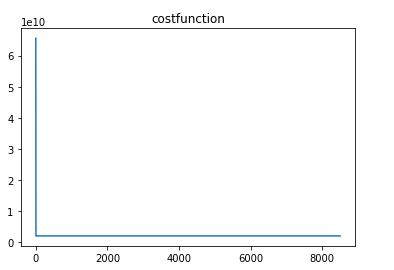
plt.plot(x2,J_h)
plt.title("costfunction")
plt.show()
MATLAB version:
clear ; close all; clc
fprintf('Loading data ...\n');
%% Load Data
data = load('ex1data2.txt');
X = data(:, 1:2);
y = data(:, 3);
m = length(y);
[X mu sigma] = featureNormalize(X); % mean 0, standard deviation 1
% Add intercept term to X
X = [ones(m, 1) X];
alpha = 0.01;
num_iters = 8500;
% Init Theta and Run Gradient Descent
theta = zeros(3, 1);
[theta, J_history] = gradientDescentMulti(X, y, theta, alpha, num_iters);
figure;
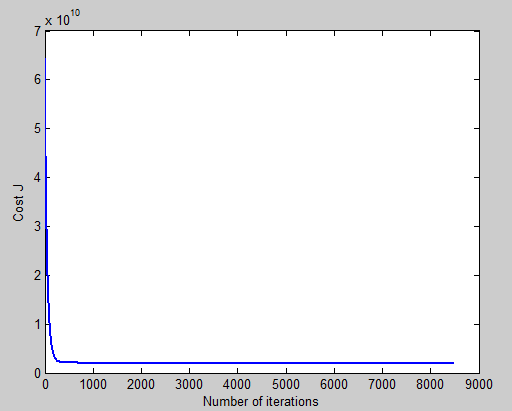
plot(1:numel(J_history), J_history, '-b', 'LineWidth', 2);
xlabel('Number of iterations');
ylabel('Cost J');
function [X_norm, mu, sigma] = featureNormalize(X)
X_norm = X;
mu = zeros(1, size(X, 2)); % mean value 均值 size(X,2) 列数
sigma = zeros(1, size(X, 2)); % standard deviation
mu = mean(X,1); % mean value
sigma = std(X); % standard deviation
X_norm = (X - repmat(mu,size(X,1),1)) ./ repmat(sigma,size(X,1),1);
end
function [theta, J_history] = gradientDescentMulti(X, y, theta, alpha, num_iters)
m = length(y); % number of training examples
J_history = zeros(num_iters, 1);
for iter = 1:num_iters
theta = theta - alpha / m * X' * (X * theta - y);
J_history(iter) = computeCostMulti(X, y, theta);
end
end
function J = computeCostMulti(X, y, theta)
m = length(y); % number of training examples
J = 0;
J = sum((X * theta - y).^2) / (2*m);
end