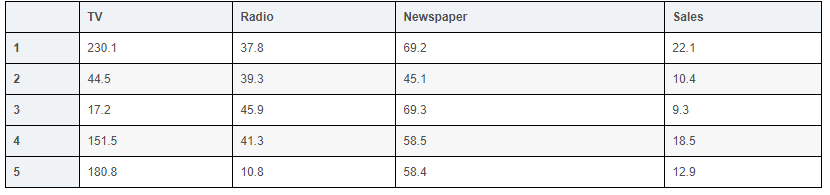
- TV: For a single product in a given market, the cost of advertising on TV (in thousands)
- Radio: Advertising costs invested in broadcast media
- Newspaper: advertising costs for newspaper media
- Sales: the sales volume of the corresponding product
In this case, we used different advertising inputs to predict product sales. Because the response variable is a continuous value, this problem is a regression problem. The data set has a total of 200 rows (200 observations), and each observation corresponds to the sales of a market.
#(网上搜索Advertising.csv即可找到本文用到的csv文件)
import numpy as np
import matplotlib.pyplot as plt
import pandas as pd
from sklearn.model_selection import train_test_split
from sklearn.linear_model import LinearRegression
from sklearn import metrics
if __name__ == "__main__":
path = 'test.csv'
data = pd.read_csv(path) # TV、Radio、Newspaper、Sales
x = data[['TV', 'Radio', 'Newspaper']]
y = data['Sales']
'''划分训练集'''
x_train, x_test, y_train, y_test = train_test_split(x, y, random_state=1)
print(x_train.shape)#(150, 3) default split is 75% for training and 25% for testing
print(y_train.shape)#(150,)
print(x_test.shape)#(50, 3)
print(y_test.shape)#(50,)
'''Scikit-learn的线性回归'''
linreg = LinearRegression()
model = linreg.fit(x_train, y_train)
print (model)#LinearRegression(copy_X=True, fit_intercept=True, n_jobs=None, normalize=False)
print (linreg.coef_)#各个特征对应的系数[0.04656457 0.17915812 0.00345046]
print (linreg.intercept_)#截距2.8769666223179318
print(zip(['TV', 'Radio', 'Newspaper'], linreg.coef_))
'''
[('TV', 0.046564567874150253),
('Radio', 0.17915812245088836),
('Newspaper', 0.0034504647111804482)]
如何解释各个特征对应的系数的意义?
对于给定了Radio和Newspaper的广告投入,如果在TV广告上每多投入1个单位,对应销量将增加0.0466个单位
更明确一点,加入其它两个媒体投入固定,在TV广告上没增加1000美元(因为单位是1000美元),销量将增加46.6(因为单位是1000)
'''
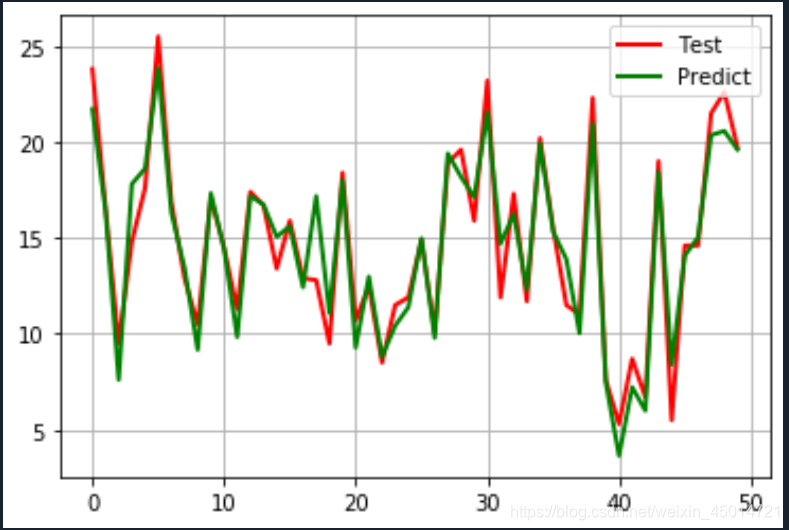
'''回归问题的评价测度'''
y_pred = linreg.predict(x_test)
mse = metrics.mean_squared_error(y_test, y_pred) #计算均方误差MSE
rmse = np.sqrt(mse) #计算均方根误差RMSE
print (mse, rmse) #1.9730456202283357 1.4046514230328946
t = np.arange(len(x_test))
plt.plot(t, y_test, 'r-', linewidth=2, label='Test')
plt.plot(t, y_pred, 'g-', linewidth=2, label='Predict')
plt.legend(loc='upper right')
plt.grid()
plt.show()
#在之前展示的数据中,我们看到Newspaper和销量之间的线性关系比较弱,现在我们移除这个特征,看看线性回归预测的结果的RMSE如何?
feature_cols = ['TV', 'Radio']

X = data[feature_cols]
y = data.Sales

X_train, X_test, y_train, y_test = train_test_split(X, y, random_state=1)

linreg.fit(X_train, y_train)

y_pred = linreg.predict(X_test)

print (np.sqrt(metrics.mean_squared_error(y_test, y_pred)))

#结果:1.38790346994
#我们将Newspaper这个特征移除之后,得到RMSE变小了,说明Newspaper特征不适合作为预测销量的特征,于是,我们得到了新的模型。我们还可以通过不同的特征组合得到新的模型,看看最终的误差是如何的。