https://v.qq.com/x/page/v0536ufbtlk.html
APP crashes
When many ordinary users experience APP crashes, they are often unable to accurately describe the problems of the APP. At most, they can only tell us the model or user account, so that we can learn very little information.
Troubleshooting
The most important information we need to know is the time when the user crashed, the specific page of the crash, and the reason for the crash. However, users generally cannot provide this information, so at this time we can only query logs in various systems, pull fault handling groups, and "guess" the cause of the fault.
Role change
Because in the business process, the entire work team has undergone great changes. At first, a few people can basically solve the problem after a few people discuss it; as the business grows larger, a single team is divided into multiple teams; later, the emergence of different development methods leads to everyone’s responsibilities and understanding of the APP. It's very one-sided, so everyone can't know at a glance where the problem is.
The page does not come out
Regarding the problem that the page cannot be displayed, our latest approach is to monitor the user's process.
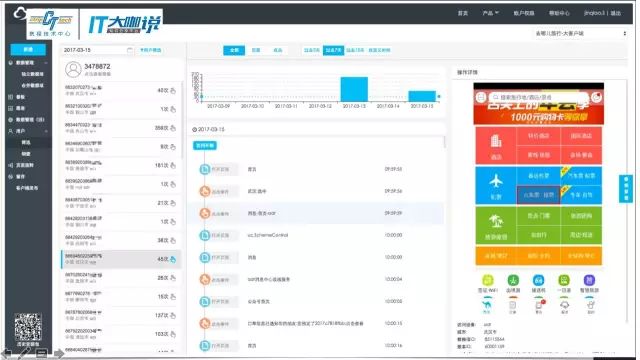
From the figure, you can see what the user did and what was done at what time.
We call it "user scrutiny".
Each page can also open its specific request status, see the request time, timeline, and even open each request to see which links the background system requested by the interface has gone through.
Now users can check and analyze which link the problem occurs in. The problem can be solved by calling the relevant persons in charge of the corresponding link together. It will not be as time-consuming as the traditional method and consume a lot of manpower.
The technical details involved here are as follows:
How to know the user's interactive behavior and rendering changes;
How to know the user's network request and timeline;
How to restore the user's scene;
How can we not affect the development of business code.
The system involved-"Somersault Cloud"
QAV is interactive statistics, QACR is abnormal monitoring, and QTrace is used to monitor the entire flow of network requests.
Interactive behavior and rendering changes
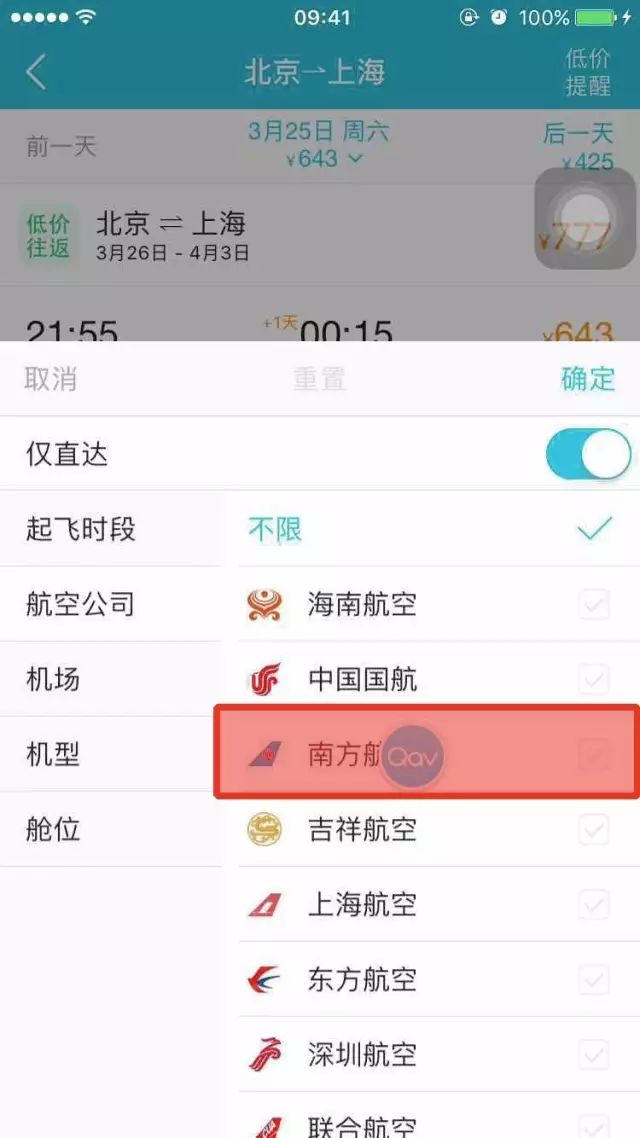
Let's start with the interaction behavior, first of all, we must look at the type of event to be monitored. There are three types of events: APP life cycle events, page switching events, and interaction events.
In the early years, the positioning control was done by view-id, but this method was very unreliable, so in that era, manual burying methods were often used for operation.
后来有了坐标的方式,其实也没有比view-id好很多,尤其是在Andriod上,会因为各种机型不同、屏幕尺寸不一样而不准确。
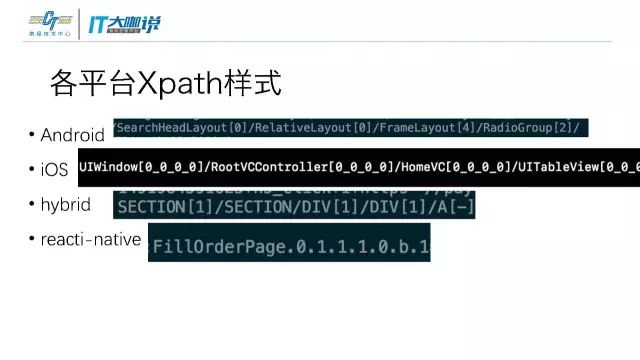
在用了xpath一段时间后发现,它在Andriod上不够稳定。体现在不同系统ROM里,它会对整个view数自行做一些厂商里定制的内容,甚至还有一些会自动增删内容。
所以我们在xpath基础上做了一些改进,对xpath基础的页面和布局的定义采用了自定义格式去做。
无论采取哪种方式,数据都会有变化,所以我们需要一个合并数据项。
各个平台xpath的样式是不同的。
在业务的开发过程中不能让它手动埋点,所以要采取Hook的方式。
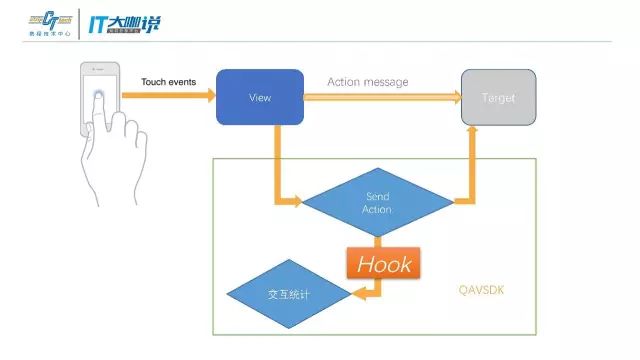
Hook在不同平台上有不同的方式。在IOS上可以用Runtime去做,而在Andriod上则要采用不一样的方式。
Andriod上其实也能用Runtime的方式做,但不是很好。因为它不是真正的运行期的Hook,它需要预插桩,对运行的效率会有影响。
所以运行期Hook使用的是InstantRun,在构建期Hook使用的是JavaAgent。
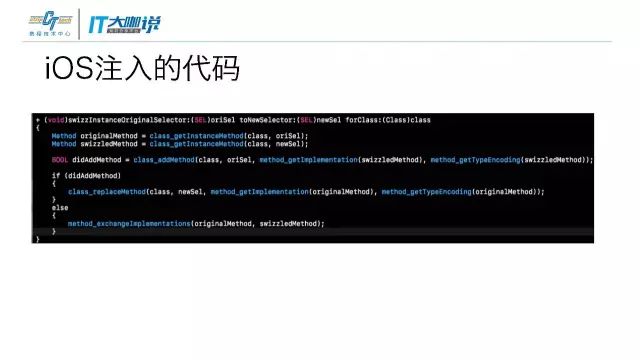
在IOS上注入代码很简单,在Andriod上就比较复杂了。
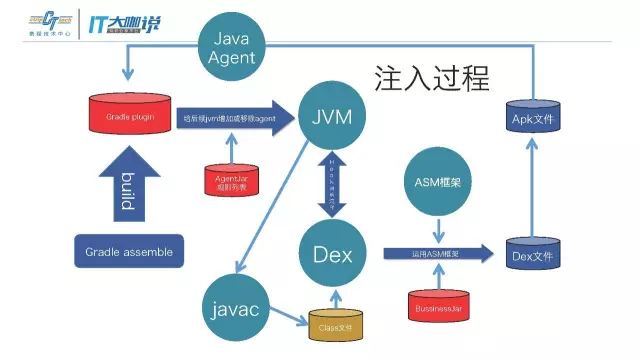
在构建过程中,Hook出构建的脚本,把所有预埋点加入Dex再打包,打完包的时候代码已经在真正输出的代码Dex里了。
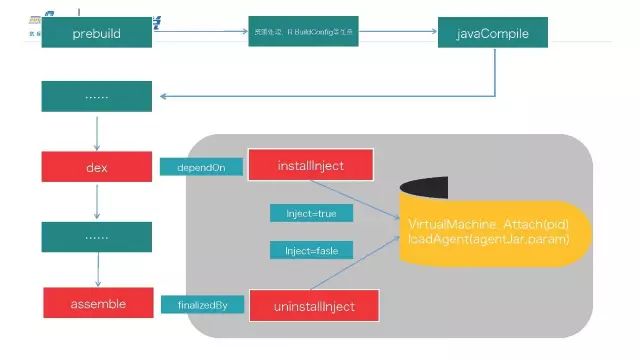
这里分为三部分,一部分是Agent,一个是Gradle插件,以及真正要修改插入内容的部分。
插入内容部分就是网络部分的监控以及用户行为上的监控,这些相对于Hook来说是业务层,所以我们把它叫做Dex。
Agent本身是用来做Hook。
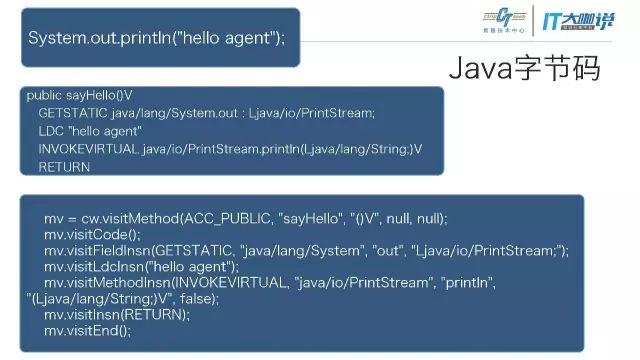
再来看一下我们都Hook了哪些内容。最基础的网络部分就是请求的时间、状态,以及当前网络是Wifi还是4G。
注入几个数据。
网络会根据不同的使用去注入不同的类型。因为一些历史遗留问题或第三方问题,必须要采用到不同网络请求的框架。
在react-native里,会直接在react-native的框架层注入Hook的方案。
将各项数据聚合
如何并发串联数据
We will have an id that binds user behavior to network requests. Each user's interactive behavior will generate an id, which will be brought up the next time there is network data, so that which interactive behavior triggers the user's request can be associated with them.
Uuid is used to connect the call stack of the interface. Each layer will add its own logo, so that the entire network call stack can be traced.
The corrected time sorting is used to put all the previous behaviors together in a correct order.
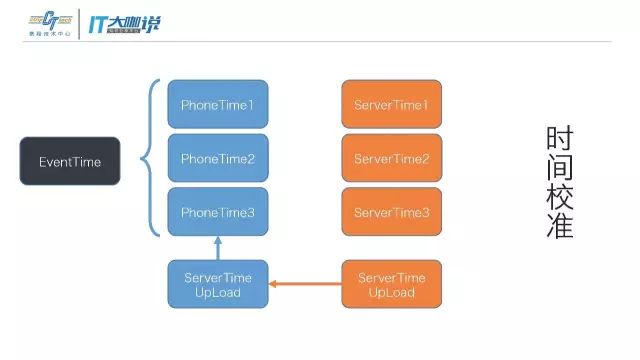
All user logs are sorted by the time of the client.
Log upload
We will compress and package the interaction log and network request log before uploading.
Real-time upload of abnormal logs such as crashes or freezes.
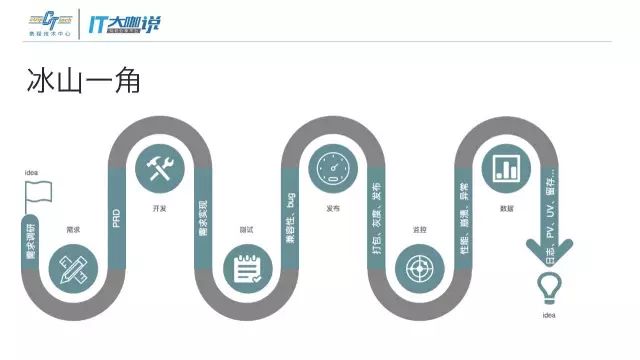
This set of systems was developed to meet the complete process of development, testing, release, and monitoring, and to ensure that the most things can be done with the least amount of manpower.
The tip of the iceberg-binding data items
Binding data items is to give the control a more humane name, which can be done by non-workers. After binding, you can see user actions in the log behavior.
This greatly reduces the time spent on statistical requirements during the development process. It also avoids the embarrassment that only programmers can understand the network log, and allows it to operate autonomously.
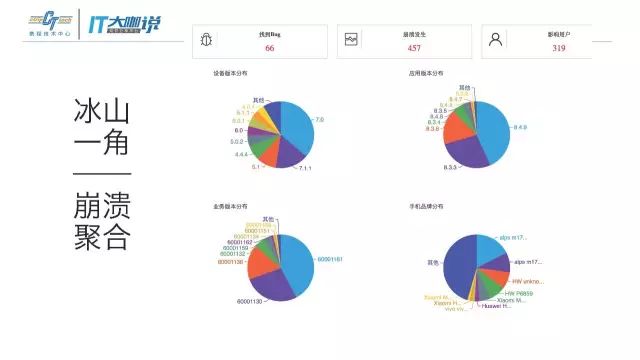
Tip of the iceberg-collapse aggregation
We found that the mainstream collection vendors outside often cannot collect all the necessary errors more completely. We collect them in a whole set of methods.
to sum up
We package everything together from data, testing, release, and monitoring, and provide them to business personnel, and give them a friendly development environment.