问题描述
在测试环境装了K8s(v1.13.5)+Istio(v1.1.7)环境,然后一天时间陆续在Istio集群中发布了30多个服务(前端、后端、网关),配置好了Istio相关路由规则后,信心满满的对服务间路由进行了测试,仅是通过点击前端页面去调用网关,而后网关对其他后端服务进行调用(web界面 -> 网关 -> 后端服务),但是在实际测试的过程中,网关总会报出后端服务503的http响应码,时不时的网关自己也会报出503的错误码,而且貌似报错的时机没有什么规律,搞得我一头雾水......
相关Issue
首先想到的就是去github-> istio中查找相关issue,具体issue可参见如下链接:
503 "upstream connect error or disconnect/reset before headers" in 1.1 with low traffic
Almost every app gets UC errors, 0.012% of all requests in 24h period
在issue中关于503的讨论非常多,Istio中引入了sidecar(envoy)的概念,sidecar简单的理解就是服务网格中的每个具体应用前面挂着的本地网络代理(对应K8s中一个Pod中可以有多个容器:istio-proxy, app,二者可以通过localhost进行通信),在Istio中sidecar是通过扩展Envoy实现的,sidecar为我们带来了便利(路由、熔断、连接池配置等),但同时也带来了服务间调用的复杂性,原本简单的Application1->Application2的调用在Istio中变为Application1->Envoy1->Envoy2->Application2的调用,如下图:
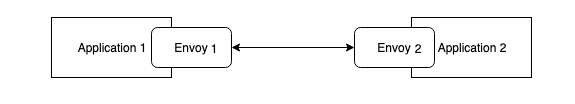
基本上,Envoy2到Application2的通信过程中的任何问题都会被包裹成 503,发送回Enovy1,进而最终返回给Application1,
通过对Issue反复研读,发现Issue中普遍提到的503问题都是由于Envoy2中的连接池缓存了Applicaiton2中已经失效的连接,Envoy2通过已经失效的连接对Application2进行调用,导致连接被重置,进而由Envoy2封装成503返回给下游调用方,
此种503的典型特征可通过相关应用的istio-proxy日志即可查看,调整istio-proxy日志level命令如下:
curl -X POST localhost:15000/logging?level=trace
典型503日志如下:
[2019-06-28 13:02:36.790][37][debug][pool] [external/envoy/source/common/http/http1/conn_pool.cc:97] [C26] using existing connection
[2019-06-28 13:02:36.790][37][debug][router] [external/envoy/source/common/router/router.cc:1210] [C21][S3699665653477458718] pool ready
[2019-06-28 13:02:36.790][37][debug][connection] [external/envoy/source/common/network/connection_impl.cc:518] [C26] remote close
[2019-06-28 13:02:36.790][37][debug][connection] [external/envoy/source/common/network/connection_impl.cc:188] [C26] closing socket: 0
[2019-06-28 13:02:36.791][37][debug][client] [external/envoy/source/common/http/codec_client.cc:82] [C26] disconnect. resetting 1 pending requests
[2019-06-28 13:02:36.791][37][debug][client] [external/envoy/source/common/http/codec_client.cc:105] [C26] request reset
[2019-06-28 13:02:36.791][37][debug][router] [external/envoy/source/common/router/router.cc:671] [C21][S3699665653477458718] upstream reset: reset reason connection termination
[2019-06-28 13:02:36.791][37][debug][http] [external/envoy/source/common/http/conn_manager_impl.cc:1137] [C21][S3699665653477458718] Sending local reply with details upstream_reset_before_response_started{connection termination}
[2019-06-28 13:02:36.791][37][debug][filter] [src/envoy/http/mixer/filter.cc:141] Called Mixer::Filter : encodeHeaders 2
[2019-06-28 13:02:36.791][37][debug][http] [external/envoy/source/common/http/conn_manager_impl.cc:1329] [C21][S3699665653477458718] encoding headers via codec (end_stream=false):
':status', '503'
'content-length', '95'
'content-type', 'text/plain'
'date', 'Fri, 28 Jun 2019 13:02:36 GMT'
'server', 'istio-envoy'
上述日志中upstream reset: reset reason connection termination即表示envoy连接池中的连接已被终止;
基本解决方法
针对上述问题基本上可通过如下4中方式进行优化:
(1)修改VirtualService中HTTPRetry(attempts, perTryTimeout,retryOn),设置错误重试策略
(注:在envoy中需要同时设置timeout(Envoy参考),即重试的总时间要小于timeout,
在Istio中需同时设置HttpRoute.timeout即可);
(2)修改DestinationRule中HTTPSettings.idleTimeout,设置envoy连接池中连接的空闲缓存时间;
(3)修改DestinationRule中HTTPSettings.maxRequestsPerConnection为1(关闭Keeplive,连接不重用,性能下降);
(4)修改tomcat connectionTimeout(Springboot配置server.connectionTimeout),增加web容器空闲连接超时时间;
同时关于Istio中503的问题排查方法可以参考如下文章:
【英文版】Istio: 503's with UC's and TCP Fun Times
总的来说排查分为4种基本方法:
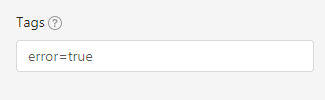
(1)查看JagerUI追踪记录(设置tags error=true);
(2)查看指标Metrics(Istio、Envoy);
(3)查看istio-proxy debug日志;
(4)网络抓包;
我在实际排查问题过程中仅使用了方法(1)(3)(4),
JaggerUI
在使用方法(1)Jagger进行问题排查时(可暂将PILOT_TRACE_SAMPLING设置为100,即追踪全部),需要注意以下几点:
(1)查询条件设置Tags error=true,以便快速定位错误追踪信息;
(2)关注追踪详情中的response_flags信息,该字段表明了响应失败的类型,可快速定位失败原因;

关于response_flags说明可参考Envoy文档:

istio-proxy日志
在使用方法(3)设置istio-proxy日志级别为debug(trace),重点关注日志中如下内容:
(1)http响应码,例如'503';
(2)查找该http响应码(例如503)上方相关日志:upstream reset: reset reason connection termination,定位失败原因;
(3)再往上方继续寻找连接方式:using existing connection | creating a new connection(已有连接 OR 新建连接);
通常已有连接出现问题就是最开始说的enovy连接池中缓存的连接失效的问题,而新建连接出现问题就需要查找其他原因了,下文会对我实际中遇到的新建连接问题进行说明;
网络抓包
可使用kubectl的插件ksniff进行,但是我在实际使用过程中并没有成功(问题出在wireshark-gtk启动失败),故采用了原始的tcpdump命令,基本步骤如下:
(1)进入应用容器的运行环境:kubectl exec -it xxx -c app -n tsp /bin/bash;
(2)执行tcpdump命令并将结果输出到文件:sudo tcpdump -ni lo port 8080 -vv -w my-packets.pcap;
-i指定网卡为lo(loopback),仅观察本地Envoy和应用之间的流量(Envoy和应用在同一主机上,通过localhost进行通信)
-n显示ip(转换domain为Ip)
port指定仅监听8080端口(应用暴露通信端口)
-vv显示详细信息
-w指定结果输出到文件my-packet.pcap
(3)进入到pod的运行节点上,通过docker cp将步骤(2)中的结果文件my-packets.pcap拷贝到节点主机上;
(4)获取节点主机上的my-packets.pcap并通过wireshark进行查看;
注:istio-proxy容器为只读文件系统,无法写文件,所以选择在具体应用容器中app进行tcpdump;
我的问题根源
经过上述的折腾,我对我的VirtualService、DestionationRule一顿修改,但是最终还是没有消除503的问题,中间还考虑过是否是因为宿主机对连接有限制、网络设置问题(ulimit、tcp_tw_recycle等),还对Istio版本进行了升级(由1.1.7升级到1.1.11,1.1.7之后的版本有对503bug的修复),但再怎么折腾还是没有消除503;
而且比较奇怪的是在github上大家说的都是using existing connection出现的问题,而我却是creating a new connection出现的问题,我的完整日志如下:
[2019-07-16 08:59:23.853][31][debug][pool] [external/envoy/source/common/http/http1/conn_pool.cc:92] creating a new connection
[2019-07-16 08:59:23.853][31][debug][client] [external/envoy/source/common/http/codec_client.cc:26] [C297] connecting
[2019-07-16 08:59:23.853][31][debug][connection] [external/envoy/source/common/network/connection_impl.cc:644] [C297] connecting to 127.0.0.1:8080
[2019-07-16 08:59:23.853][31][debug][connection] [external/envoy/source/common/network/connection_impl.cc:653] [C297] connection in progress
[2019-07-16 08:59:23.853][31][debug][pool] [external/envoy/source/common/http/conn_pool_base.cc:20] queueing request due to no available connections
[2019-07-16 08:59:23.853][31][debug][filter] [src/envoy/http/mixer/filter.cc:94] Called Mixer::Filter : decodeData (84, false)
[2019-07-16 08:59:23.853][31][debug][http] [external/envoy/source/common/http/conn_manager_impl.cc:1040] [C93][S18065063288515590867] request end stream
[2019-07-16 08:59:23.853][31][debug][filter] [src/envoy/http/mixer/filter.cc:94] Called Mixer::Filter : decodeData (0, true)
[2019-07-16 08:59:23.853][31][debug][connection] [external/envoy/source/common/network/connection_impl.cc:526] [C297] delayed connection error: 111
[2019-07-16 08:59:23.853][31][debug][connection] [external/envoy/source/common/network/connection_impl.cc:183] [C297] closing socket: 0
[2019-07-16 08:59:23.853][31][debug][client] [external/envoy/source/common/http/codec_client.cc:82] [C297] disconnect. resetting 0 pending requests
[2019-07-16 08:59:23.853][31][debug][pool] [external/envoy/source/common/http/http1/conn_pool.cc:133] [C297] client disconnected, failure reason:
[2019-07-16 08:59:23.853][31][debug][pool] [external/envoy/source/common/http/http1/conn_pool.cc:173] [C297] purge pending, failure reason:
[2019-07-16 08:59:23.853][31][debug][router] [external/envoy/source/common/router/router.cc:644] [C93][S18065063288515590867] upstream reset: reset reason connection failure
[2019-07-16 08:59:23.853][31][debug][filter] [src/envoy/http/mixer/filter.cc:133] Called Mixer::Filter : encodeHeaders 2
[2019-07-16 08:59:23.853][31][trace][http] [external/envoy/source/common/http/conn_manager_impl.cc:1200] [C93][S18065063288515590867] encode headers called: filter=0x5c79f40 status=0
[2019-07-16 08:59:23.853][31][debug][http] [external/envoy/source/common/http/conn_manager_impl.cc:1305] [C93][S18065063288515590867] encoding headers via codec (end_stream=false):
':status', '503'
'content-length', '91'
'content-type', 'text/plain'
'date', 'Tue, 16 Jul 2019 08:59:23 GMT'
'server', 'istio-envoy'
通过日志发现我的问题是出现在Enovy连接本地应用127.0.0.1:8080端口时出现的connection failure,而且在JaggerUI中response_flags为UF(上游服务连接失败),并且这个失败还是间歇性的,有时成功有时失败的;

就在某个天气还算可以的周五上午(已经快折腾了一个礼拜后>_<|||),我注意到了如下现象:
通过docker ps|grep app查看我的应用容器,怎么所有的app容器都才up了6、7分钟的样子;
貌似发现了问题所在,这么多容器普遍都运行了6、7分钟,也就是说app容器被不断重启,导致app容器重启的原因就是K8s的健康检查没有通过,我马上去看了一下K8s的健康检查配置:

容器暴露的端口containPort=8080,而livenessProbe中设置的tcpSocket.port为80,二者根本对不上,又由于健康检查的配置:
延迟检测300s(5分钟)+ 第一次检测失败 + 失败重试(3-1)次*重试间隔60s = 5分钟 + 2*1分钟=7分钟多(7至8分钟左右)
导致应用会在7-8分钟后才被检测出不健康,进而引发了app容器普遍up时间都不超过8分钟,并且不断被重启,而在重启的过程中必然导致envoy连接app时connection failure,也就出现了间歇性503的问题,同时观察前端界面(定时心跳)请求后端服务报503的时间周期也与app容器重启的时间一致,进一步印证了连接失败的原因:
健康检查配置错误导致app容器不断被重启,重启过程中导致connection failure;
之后在对所有Deployment中的livenessProbe进行修改后,之前的503问题消失了......
周末又可以开心出去玩了......
总结
因为自己的粗心导致了健康检查配置错误,进而引发Istio 503问题,还是对相关配置理解不透彻,需要加深学习;
但是在排查503问题的同时对Isito排查问题的途径又加深了理解,以后再出现问题时亦可以快速定位;
不要轻言放弃......
