企业级监控系统——Zabbix——自定义监控项目
1. 添加监控项目
给server2装一个httpd
yum install httpd -y
systemctl start httpd
在监控界面:


这下就可以监控到httpd服务了:

2. 自定义监控项目示例一
step1 给server3安装一个nginx服务
tar zxf nginx-1.16.1.tar.gz
ls
cd nginx-1.16.1/
yum install gcc -y
./configure --prefix=/usr/local/nginx --with-http_stub_status_module
yum install pcre-devel zlib-devel -y
./configure --prefix=/usr/local/nginx --with-http_stub_status_module
make && make install

cd /usr/local/nginx/
ln -s /usr/local/nginx/sbin/nginx /usr/local/sbin/
cd conf/
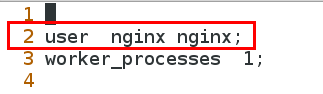
vim nginx.conf
2 user nginx nginx;
47 location /status {
48
49 stub_status on;
50 access_log off; #关闭日志
51 allow 127.0.0.1; #允许本机访问
52 deny all; #拒绝其他主机访问
53
54 }
useradd -u 900 nginx
nginx
netstat -antlpe|grep 80


step2 测试:
curl http://127.0.0.1/status

扫描二维码关注公众号,回复:
9918192 查看本文章

Active connections: 1表示正在处理的活动连接数有多少个
server accepts handled requests
1 1 1
Reading: 0 Writing: 1 Waiting: 0
server表示nginx启动到现在共处理了多少个连接
accepts表示nginx启动到现在共成功创建了多少次握手(备注:请求丢失数=握手数-连接数)
handled requests表示总共处理了多少次请求
Reading为nginx读取到客户端的Header信息数
Writing为nginx返回给客户端的Header信息数
Waiting为nginx已经处理完正在等待下一次请求指令的驻留连接,在开启keep-alive的情况下
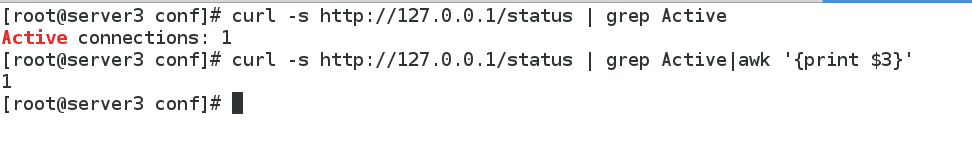
step3 获取活跃连接数:
curl -s http://127.0.0.1/status | grep Active
curl -s http://127.0.0.1/status | grep Active|awk '{print $3}'
cd /etc/zabbix/zabbix_agentd.d/
ls
cp userparameter_mysql.conf userparameter_nginx.conf
vim userparameter_nginx.conf

  9 UserParameter=nginx.active,curl -s http://127.0.0.1/status | grep Active|awk '{print $3}'

systemctl restart zabbix-agent.service


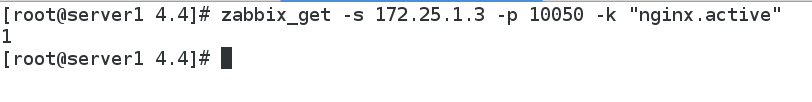
在server1中看能不能获取到数据:
cd 4.4/
yum install zabbix-get-4.4.1-1.el7.x86_64.rpm

zabbix_get -s 172.25.1.3 -p 10050 -k "nginx.active"
step4 在监控界面中配置:


预览效果:

server1中:
cd 4.4/
ls
mv simkai.ttf /usr/share/zabbix/assets/fonts
cd /usr/share/zabbix/assets/fonts/
ls
cd /usr/share/zabbix/include/
vim defines.inc.php

:%s/graphfont/simkai/g


再次刷新监控界面,字体就恢复正常了:

3. 自定义监控项目示例二
step1 在server3中配置:
curl -s http://127.0.0.1/status | awk NR==3						#表示nginx启动到现在共成功创建了多少次握手
curl -s http://127.0.0.1/status | awk NR==3 | awk '{print $1}'	#表示nginx启动到现在共成功创建了多少次握手
vim userparameter_nginx.conf

 10 UserParameter=nginx.accept,curl -s http://127.0.0.1/status | awk NR==3 | awk '{print $1}'

systemctl restart zabbix-agent.service


step2 在server1中测试:
zabbix_get -s 172.25.1.3 -p 10050 -k "nginx.accept"

step3 监控界面配置:

创建监控项:


添加图形:


预览效果:

