USDA食品数据库
!git clone https://github.com/wesm/pydata-book
0 导入相关库
# 基础
import numpy as np # 处理数组
import pandas as pd # 读取数据&&DataFrame
import matplotlib.pyplot as plt # 制图
import seaborn as sns
from matplotlib import rcParams # 定义参数
from matplotlib.cm import rainbow # 配置颜色

%matplotlib inline
import warnings
warnings.filterwarnings('ignore') # 忽略警告信息
np.set_printoptions(precision=4) # 小数点后
pd.options.display.max_rows = 10 # 最大行数
1 读取文本文件(JSON、字典格式)
import json
db = json.load(open('pydata-book/datasets/usda_food/database.json'))
len(db)

db[0]

db[0].keys()

db中的每个条目都是一个含有某种食物全部数据的字典
db[0]['nutrients'][0]
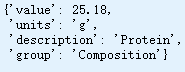
nutrients字段是一个字典 列表,其中的每个字典对应一种营养成分
2 数据预处理
nutrients = pd.DataFrame(db[0]['nutrients'])
nutrients

取出食物的名称、分类、编号以及制造商等信息 ->
DataFrame
info_keys = ['description', 'group', 'id', 'manufacturer']
info = pd.DataFrame(db, columns=info_keys)
info

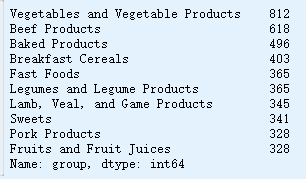
查看
食物类别的分布情况
pd.value_counts
pd.value_counts(info.group)[:10]
- 将各食物的营养成分列表转换为一个DataFrame
- 添加一个表示编号的列
- 将该DataFrame添加到一个列表中
- 通过concat连接
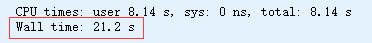
%%time
nutrients = []
for rec in db:
    fnuts = pd.DataFrame(rec['nutrients'])
    fnuts['id'] = rec['id']
    nutrients.append(fnuts)

nutrients = pd.concat(nutrients, ignore_index=True)
nutrients

重复次数
pd.DataFrame.duplicated
nutrients.duplicated().sum()

去重
pd.DataFrame.drop_duplicates
nutrients = nutrients.drop_duplicates()
nutrients.shape

重命名两个数据框都有的
groupdescription列名
pd.DataFrame.rename
col_mapping = {'description' : 'food',
               'group'       : 'fgroup'}
info = info.rename(columns=col_mapping, copy=False)
info.info()
col_mapping = {'description' : 'nutrient',
               'group' : 'nutgroup'}
nutrients = nutrients.rename(columns=col_mapping, copy=False)
nutrients.info()

合并
info&nutrients
ndata = pd.merge(nutrients, info, on='id', how='outer')
ndata.info()
ndata.iloc[30000]

3 可视化
3.1 根据食物分类和营养类型画Zinc, Zn中位值图
pd.DataFrame.quantile
type(ndata.groupby(['nutrient', 'fgroup'])['value'])

fig = plt.figure()
result = ndata.groupby(['nutrient', 'fgroup'])['value'].quantile(0.5)
result['Zinc, Zn'].sort_values().plot(kind='barh')

3.2 查看各营养成分最为丰富的食物
by_nutrient = ndata.groupby(['nutgroup', 'nutrient'])

get_maximum = lambda x: x.loc[x.value.idxmax()]
get_minimum = lambda x: x.loc[x.value.idxmin()]

max_foods = by_nutrient.apply(get_maximum)[['value', 'food']]

max_foods.food = max_foods.food.str[:50] # 切片

max_foods

max_foods.info()
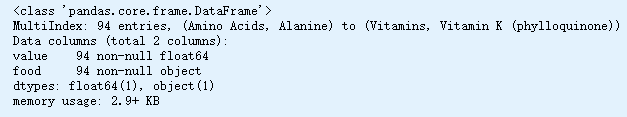
max_foods.index

max_foods.columns

3.3 'Amino Acids’营养成分 & top5所占比例
max_foods.loc['Amino Acids']

max_foods.loc['Amino Acids'].sort_values(by='value').plot.barh()

max_foods.loc['Amino Acids'].sort_values(by='value', ascending=False, inplace=False)

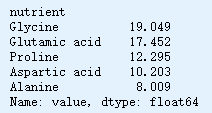
max_foods.loc['Amino Acids'].sort_values(by='value', ascending=False, inplace=False)[:5]

max_foods.loc['Amino Acids'].sort_values(by='value', ascending=False, inplace=False)[:5]['value']
max_foods.loc['Amino Acids'].sort_values(by='value', ascending=False, inplace=False)[:5]['value'].plot.pie(autopct='%.2f', fontsize=16)

3.4 Glycine营养成分哪里食物中含有
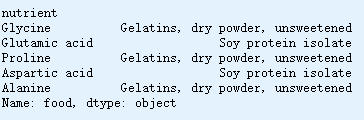
max_foods.loc['Amino Acids'].sort_values(by='value', ascending=False, inplace=False)[:5]['food']
food_ =  max_foods.loc['Amino Acids'].sort_values(by='value', ascending=False, inplace=False)[:5]['food']['Glycine'].split(',')

food_

ndata.loc[np.where(ndata['nutrient'] == 'Glycine')]

