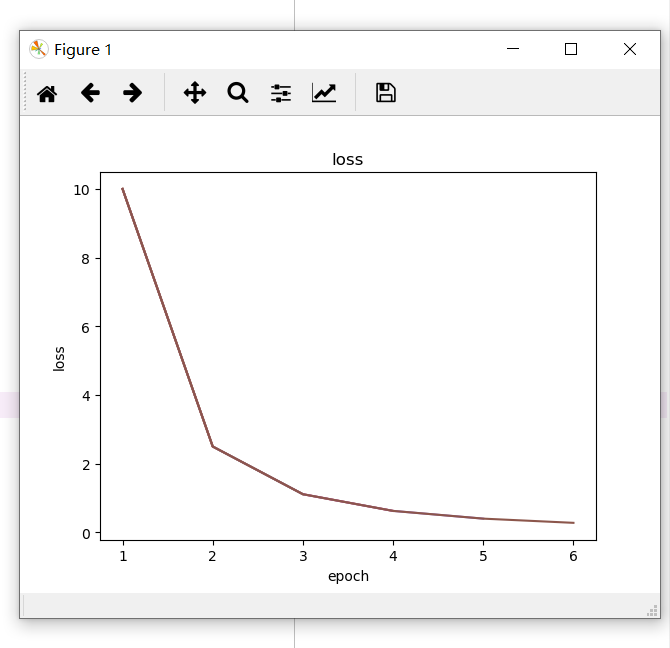
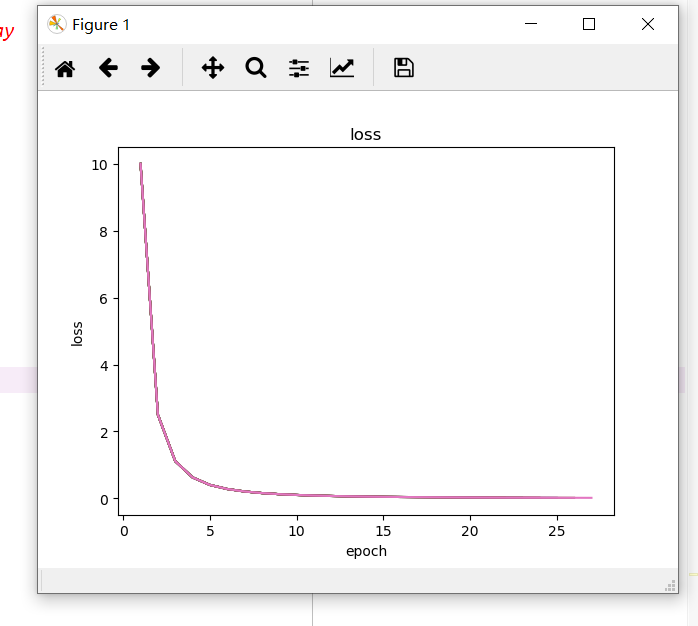
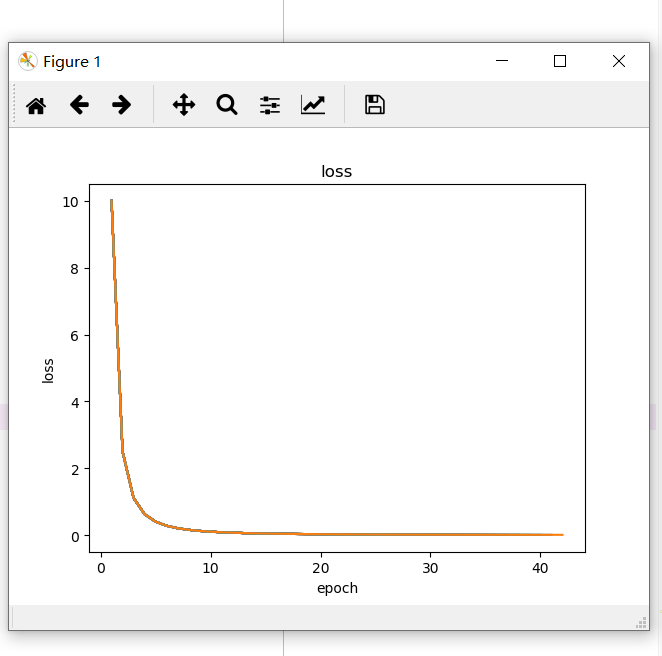
import matplotlib.pyplot as plt

x = list(range(1, 100))  # epoch array
loss = [10 / (i**2) for i in x]  # loss values array

plt.ion()

for i in range(1, len(x)):
    ix = x[:i]
    iy = loss[:i]
    plt.title("loss")
    plt.plot(ix, iy)

    plt.xlabel("epoch")
    plt.ylabel("loss")

    # plt.xlim(0,len(x)) #固定x轴
    if i == 1:
        plt.pause(1)  # 启动时间,方便截屏
    plt.pause(0.5)

plt.ioff()
plt.show()
在keras训练模型时,model.fit返回得有训练评价信息,可以依此动态可视化。
可参考keras中的History对象 。
以及读取tensorboard日志数据。