1.html页面引入需要的文件
<!-- ChartJS -->
<script th:src="@{/bower_components/chart.js/Chart.js}"></script>
<!-- AdminLTE dashboard demo (This is only for demo purposes) -->
<script th:src="@{/bower_components/dist/js/pages/dashboard2.js}"></script>
<script src="./js/echarts.min.js"></script>
2.页面使用canvas
1 <div class="chart">
2    <!-- Sales Chart Canvas -->
3    <canvas id="salesChart" style="height: 180px;"></canvas>
4 </div>
3.重写dashboard.js代码
1 $(function () {
2 /* ChartJS
3 * -------
4 * Here we will create a few charts using ChartJS
5 */
6
7 // -----------------------
8 // - MONTHLY SALES CHART -
9 // -----------------------
10
11 // Get context with jQuery - using jQuery's .get() method.
12 var salesChartCanvas = $('#salesChart').get(0).getContext('2d');
13 // This will get the first returned node in the jQuery collection.
14 var salesChart = new Chart(salesChartCanvas);
15
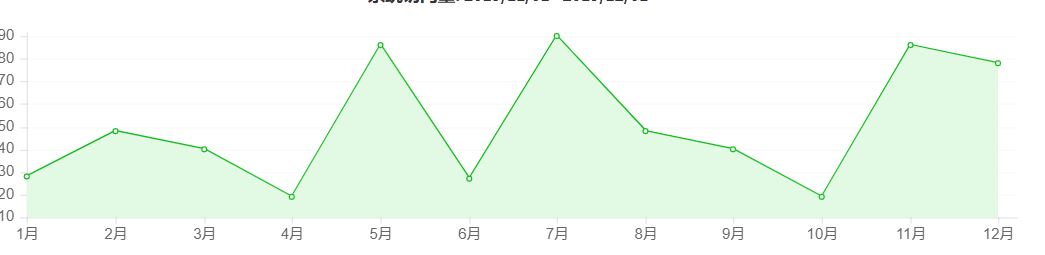
16 var salesChartData = {
17 labels : ['1月', '2月', '3月', '4月', '5月', '6月', '7月', '8月', '9月', '10月', '11月', '12月'],
18 datasets: [
19 {
20 label : 'Digital Goods',
21 fillColor : '#e2f9e3',
22 strokeColor : '#12BA1D',
23 pointColor : '#fff',
24 pointStrokeColor : '#12BA1D',
25 pointHighlightFill : '#fff',
26 pointHighlightStroke: '#12BA1D',
27 data : [28, 48, 40, 19, 86, 27, 90, 48, 40, 19, 86, 78]
28 }
29 ]
30 };
31 var salesChartOptions = {
32 // Boolean - If we should show the scale at all
33 showScale : true,
34 // Boolean - Whether grid lines are shown across the chart
35 scaleShowGridLines : true,
36 // String - Colour of the grid lines 每行x轴的线
37 scaleGridLineColor : '#fafafa',
38 // Number - Width of the grid lines
39 scaleGridLineWidth : 1,
40 // Boolean - Whether to show horizontal lines (except X axis)
41 scaleShowHorizontalLines: true,
42 // Boolean - Whether to show vertical lines (except Y axis)
43 scaleShowVerticalLines : false,
44 // 取消曲线 用折线
45 bezierCurve : false,
46 // Number - Tension of the bezier curve between points
47 bezierCurveTension : 0.3,
48 // Boolean - Whether to show a dot for each point
49 pointDot : true,
50 // Number - Radius of each point dot in pixels
51 pointDotRadius : 2,
52 // Number - Pixel width of point dot stroke
53 pointDotStrokeWidth :1,
54 // Number - amount extra to add to the radius to cater for hit detection outside the drawn point
55 pointHitDetectionRadius : 20,
56 // Boolean - Whether to show a stroke for datasets
57 datasetStroke : true,
58 // Number - Pixel width of dataset stroke
59 datasetStrokeWidth : 2,
60 // Boolean - Whether to fill the dataset with a color
61 datasetFill : true,
62 // String - A legend template
63 legendTemplate : '<ul class=\'<%=name.toLowerCase()%>-legend\'><% for (var i=0; i<datasets.length; i++){%><li><span style=\'background-color:<%=datasets[i].lineColor%>\'></span><%=datasets[i].label%></li><%}%></ul>',
64 // Boolean - whether to maintain the starting aspect ratio or not when responsive, if set to false, will take up entire container
65 maintainAspectRatio : true,
66 // Boolean - whether to make the chart responsive to window resizing
67 responsive : true
68 };
69
70 // Create the line chart
71 salesChart.Line(salesChartData, salesChartOptions);