vue:echarts菜鸟初学
小谷最近学习的项目中涉及到echarts,然后百度,查询了一些关于echarts的资料。
首先我们的项目是用vue中编写的(使用的工具是visual.studio)
1.首先是安装:
npm install echarts --save
2.安装完成就是引入使用(类似于我们在vue-router路由跳转)
main.js
import echarts from 'echarts'

Vue.prototype.$echarts = echarts
3.App.vue
<template>
<!-- 所有的内容要被根节点包含起来-->
<div id="news">
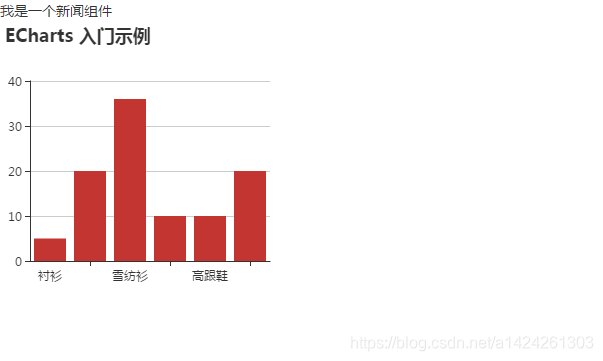
我是一个新闻组件
<div id="myChart" :style="{width: '300px', height: '300px'}"></div>
<br>
</div>
</template>
<script>
// 引入基本模板
let echarts = require('echarts/lib/echarts')
// 引入柱状图组件
require('echarts/lib/chart/bar')
// 引入提示框和title组件
require('echarts/lib/component/tooltip')
require('echarts/lib/component/title')
export default {
name: 'hello',
data() {
return {
msg: 'Welcome to Your Vue.js App'
}
},
mounted() {
this.drawLine();
},
methods: {
drawLine() {
// 基于准备好的dom,初始化echarts实例
let myChart = echarts.init(document.getElementById('myChart'))
// 绘制图表
myChart.setOption({
title: { text: 'ECharts 入门示例' },
tooltip: {//设置鼠标悬停提示框的位置。
// trigger: 'axis',
// position: [20, 20]
// // 等价于
// // position: ['20px', '20px']
},
xAxis: {
data: ["衬衫", "羊毛衫", "雪纺衫", "裤子", "高跟鞋", "袜子"]
},
yAxis: {},
series: [{
name: '销量',
type: 'bar',
data: [5, 20, 36, 10, 10, 20]
}]
});
}
}
}
</script>
4.效果图