-
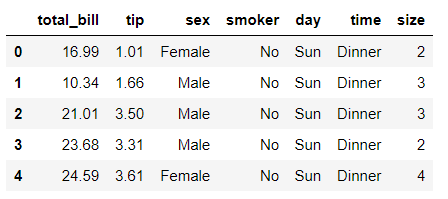
显示使用的数据
%matplotlib inline
import numpy as np
import pandas as pd
import seaborn as sns
from scipy import stats
import matplotlib as mpl
import matplotlib.pyplot as plt

sns.set(style="ticks")
np.random.seed(sum(map(ord, "axis_grids")))
tips = sns.load_dataset("tips")
tips.head()
运行结果:
-
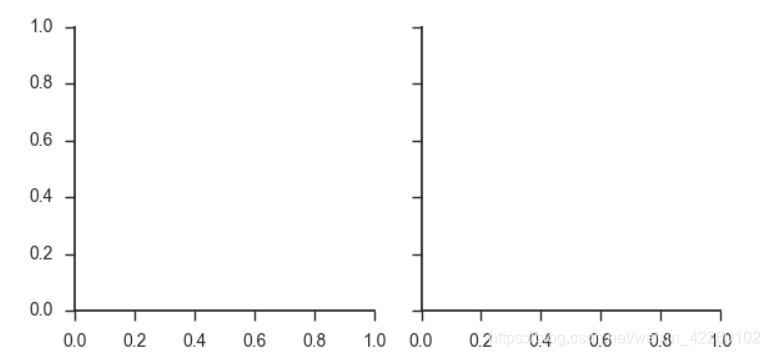
指定展示的信息
g = sns.FacetGrid(tips, col="time")运行结果:
-
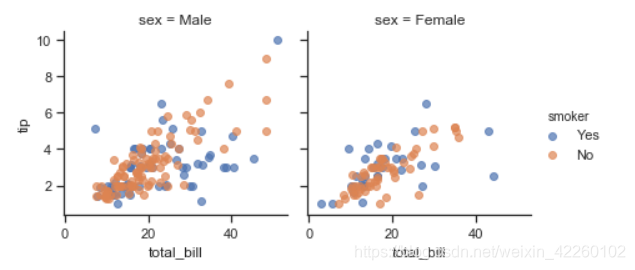
透明度
g = sns.FacetGrid(tips, col="sex", hue="smoker")
g.map(plt.scatter, "total_bill", "tip", alpha=.7)
g.add_legend();
运行结果:
-
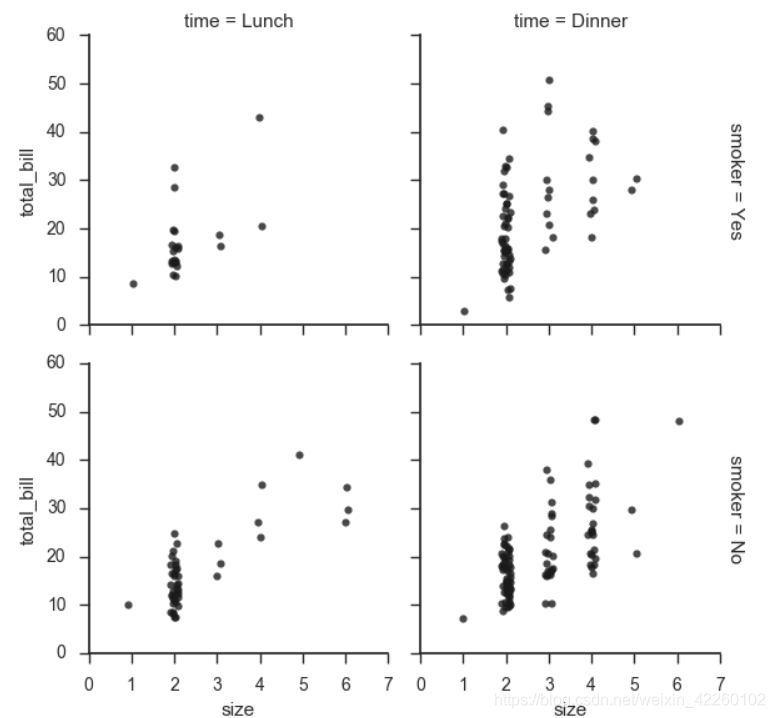
其他应用
g = sns.FacetGrid(tips, row="smoker", col="time", margin_titles=True)
g.map(sns.regplot, "size", "total_bill", color=".1", fit_reg=False, x_jitter=.1);
运行结果:
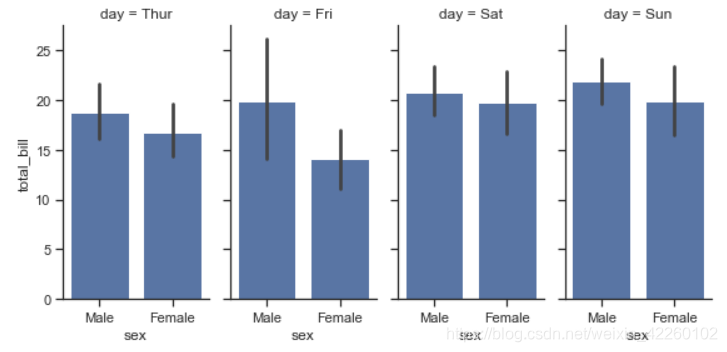
g = sns.FacetGrid(tips, col="day", size=4, aspect=.5)
g.map(sns.barplot, "sex", "total_bill");
运行结果:
-
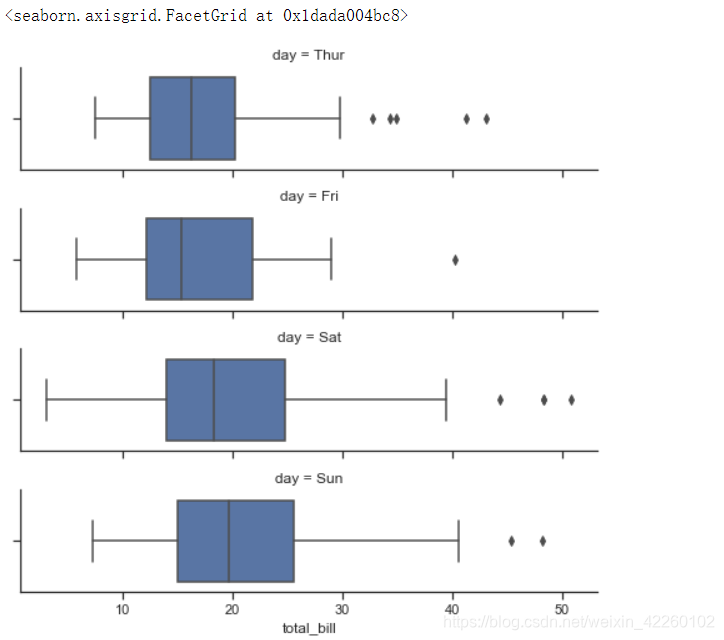
绘制先后顺序
from pandas import Categorical
ordered_days = tips.day.value_counts().index
print (ordered_days)
ordered_days = Categorical(['Thur', 'Fri', 'Sat', 'Sun'])
g = sns.FacetGrid(tips, row="day", row_order=ordered_days,
                  size=1.7, aspect=4,)
g.map(sns.boxplot, "total_bill")
运行结果:

facetgrid使用方法

猜你喜欢
转载自blog.csdn.net/weixin_42260102/article/details/103465040
今日推荐
周排行