一、背景描述
最近在研究didi的booster框架,应用到项目中,然后通过执行 assemble task 来构建一个优化过的应用包,构建完成后,在 build/reports/ 目录下会生成相应的报告。

生成的报告文件中,包含了部分dot文件,如下所示

打开该x.dot文件,是一堆如下面的文本,看不懂

digraph "com.amap.api.col.sl3.x" {
    graph [bgcolor="transparent",pad="0.555"];
    node [color="#00BFC4",fillcolor="#00BFC440",fontcolor="#333333",fontname=Helvetica,shape=box,style=filled];
    edge [fontname=Helvetica];
    rankdir = TB;
    "x" [color="#CCCC66",fillcolor="#CCCC6640"];
    "x:finalize()" [color="#000033",fillcolor="#00003340"];
    "x:setRenderer(GLSurfaceView$Renderer)" [color="#993399",fillcolor="#99339940"];
    "x$i:start()" [color="#66CC33",fillcolor="#66CC3340"];
    "x" -> "x:finalize()" [color="#0033FF",fontcolor="#0033FF"];
    "x" -> "x:setRenderer(GLSurfaceView$Renderer)" [color="#9999FF",fontcolor="#9999FF"];
    "x:setRenderer(GLSurfaceView$Renderer)" -> "x$i:start()" [color="#669933",fontcolor="#669933"];
}
因此,我们得先了解下什么是dot文件,什么是DOT语言?
二、什么是DOT语言?


-
The DOT Language :https://www.cnblogs.com/itzxy/p/7860073.html

-
在 org-mode 中使用 Graphviz 畫關係圖 https://coldnew.github.io/787b7d73/


下面我们就将上面的博客摘录过来。摘录地址:dot language 学习笔记:https://www.cnblogs.com/billnote/p/4043267.html
2.1 dot 语言简介
DOT语言是一种文本图形描述语言。文件扩展名通常为.gv或.dot 。它可以导出的格式有:GIF、PNG、SVG、PDF及PostScript。
2.2 基本语法
2.1 常用图形
- box、polygon、ellipse、circle、point、triangle、invtriangle、plaintext、diamond
digraph shapes {
  "Box"[shape=box]
  "Polygon"[shape=polygon,sides=7] /* 定义了一个7边行,sides属性定义多边形边的数量 */
  "Ellipse"[shape=ellipse]
  "Circle"[shape=circle]
  "Point"[shape=point]
  "triangle"[shape=triangle]
  "invtriangle"[shape=invtriangle]
  "plaintext"[shape=plaintext]
  "diamond"[shape=diamond]
}

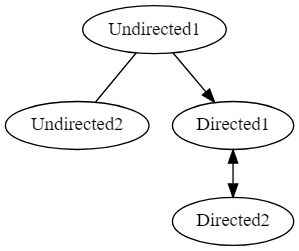
2.2 常用线条
- 无向线条、又向线条、双向线条
digraph lines {
  "Undirected1"->"Undirected2"[arrowhead=none]
  "Undirected1"->"Directed1"
  "Directed1"->"Directed2"[dir=both]
}
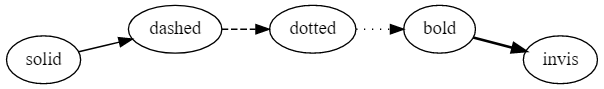
- 实线、虚线、点线、加粗、透明
digraph lines2 {
  rankdir=LR
  "solid"->"dashed"[style=solid]
  "dashed"->"dotted"[style=dashed]
  "dotted"->"bold"[style=dotted]
  "bold"->"invis"[style=bold]
  "invis"->"solid"[style=invis]
}
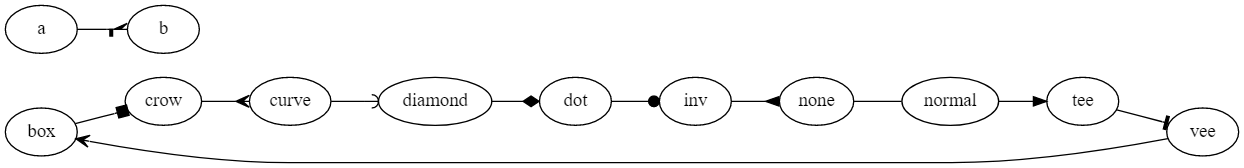
2.3 常用箭头
- box、crow、curve、icurve、diamond、dot、inv、none、normal、tee、vee
digraph arrow {
  rankdir=LR

  "box"->"crow"[arrowhead=box]
  "crow"->"curve"[arrowhead=crow]
  "curve"->"diamond"[arrowhead=curve]
  "diamond"->"dot"[arrowhead=diamond]
  "dot"->"inv"[arrowhead=dot]
  "inv"->"none"[arrowhead=inv]
  "none"->"normal"[arrowhead=none]
  "normal"->"tee"[arrowhead=normal]
  "tee"->"vee"[arrowhead=tee]
  "vee"->"box"[arrowhead=vee]

  #来个高级的用法
  a->b[arrowhead=lcrowortee]
}
2.4 常用属性
2.4.1 Node常用属性
| 属性名 | 默认值 | 说明 |
|---|---|---|
| color | black | node图形颜色,see color values |
| fontcolor | black | 字体颜色 |
| fontname | Times-Roman | 字体 |
| fontsize | 14 | 字体大小 |
| image | node背景图片地址 | |
| label | node name | node 显示内容 |
| shape | ellipse | 形状 |
| style | 图形样式,eg. bold、dotted、filled | |
| height | .5 | 最低高度尺寸 |
| width | .75 | 最低宽度尺寸 |
| URL | 点击跳转地址 | |
| target | 点击跳转打开方式 |
digraph demo_node {
   rankdir=LR
   "default_node"
   "node"[shape=box,color=antiquewhite,style=filled,label="node attrs",fontcolor=brown,fontsize=10,URL="http://www.baidu.com",target="_brank"]
   "default_node"->"node"
}

2.4.2 Edge常用属性
| 属性名 | 默认值 | 说明 |
|---|---|---|
| arrowhead | normal | 箭头样式 |
| arrowsize | 1.0 | 箭头尺寸 |
| color | black | 颜色 |
| dir | forward | 箭头方向 |
| edgeURL | 点击跳转地址 | |
| fontcolor | black | 字体颜色 |
| fontname | Times-Roman | 字体 |
| fontsize | 14 | 字体大小 |
| headport | 线条头部连接处,eg.n、ne、e、se、s、sw、w、nw | |
| label | 描述内容 | |
| labelfontcolor | black | label字体颜色 |
| labelfontname | Times-Roman | label字体 |
| labelfontsize | 14 | label字体大小 |
| style | 图形样式,eg.bold、dotted、filled | |
| tailport | 线条尾部连接处,eg.n、ne、e、se、s、sw、w、nw | |
| weight | 1 | integer cost of stretching an edge |
digraph demo_edge {
  rankdir=LR
  a->b[label="Yes",labelfontcolor=blue]
  edge[arrowhead=box,arrowsize=1.5,color=red,dir=both,style=dotted,weight=10]
  b->c
}

2.4.3 Graph常用属性
| 属性名 | 默认值 | 说明 |
|---|---|---|
| bgcolor | 背景颜色 | |
| color | black | for clusters,outline color,and fill color |
| dpi | 96 | 图像输出像素 |
| fillcolor | black | cluster fill color |
| fontcolor | black | 字体颜色 |
| fontname | Times-Roman | 字体 |
| fontsize | 14 | 字体大小 |
| label | 描述内容 | |
| landscape | true:orientation=landscape | |
| rank | 子图等级限制, same,min,max,source,sink | |
| rankdir | TB | 图片排列方式,LR(left to right) or TB(top to bottom) |
| size | 最大图片尺寸 | |
| style | 图片样式 | |
| stylesheet | pathname or URL to XML style sheet for SVG | |
| URL | 点击跳转地址 | |
| target | 点击跳转打开方式 |
digraph demo_graph {
  bgcolor=beige
  fontcolor=gray10
  fontsize=12
  label="this is demo"
  rankdir=TB

  {rank=same; "level1" "a-level1" "b-level1" "c-level1"}
  {rank=same; "level2" "d-level2" "e-level2"}
  {rank=same; "level3" "f-level3" "g-level3" "h-level3" "i-level3" "j-level3"}
  {rank=same; "level4" "k-level4"}
  "level1"->"level2"->"level3"->"level4"
  "a-level1"->"d-level2"
  "e-level2"->{"h-level3", "k-level4"}
  "b-level1"->{"e-level2", "f-level3", "i-level3", "k-level4"}
  "c-level1"->{"d-level2", "g-level3", "h-level3"}
  "j-level3"->{"f-level3", "k-level4"}
}

2.5 子图
dot支持将一组元素组合成一个子图,且一个图形可以包含一个及多个子图。
使用子图需要注意以下两点:
- 子图node无法在主图rank中使用。
- 子图命名必须以:"cluster"作为前缀。
digraph demo_subgraph {
  bgcolor=beige
  fontcolor=gray10
  fontsize=12
  label="this is demo"
  rankdir=TB

  /* 特别注意: 子图命名必须以"cluster"为前缀 */
  subgraph "cluster_g1" {
    label="g1"
    bgcolor=cadetblue
    "level1"->"level2"->"level3"->"level4"
  }

  subgraph "cluster_g2" {
    label="g2"
    bgcolor=cornsilk
    "level2"
    "d-level2"
    "e-level2"
  }

  subgraph "cluster_g3" {
    label="g3"
    bgcolor=cornsilk
    "level3"
    "f-level3"
    "g-level3"
    "h-level3"
    "i-level3"
    "j-level3"
  }

  "a-level1"->"d-level2"
  "e-level2"->{"h-level3", "k-level4"}
  "b-level1"->{"e-level2", "f-level3", "i-level3", "k-level4"}
  "c-level1"->{"d-level2", "g-level3", "h-level3"}
  "j-level3"->{"f-level3", "k-level4"}
}

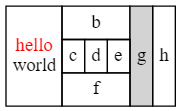
2.6 其他用法
2.6.1 label使用html标签
digraph html {
  abc [shape=none, margin=0, label=<
  <TABLE BORDER="0" CELLBORDER="1" CELLSPACING="0" CELLPADDING="4">
  <TR><TD ROWSPAN="3"><FONT COLOR="red">hello</FONT><BR/>world</TD>
  <TD COLSPAN="3">b</TD>
  <TD ROWSPAN="3" BGCOLOR="lightgrey">g</TD>
  <TD ROWSPAN="3">h</TD>
  </TR>
  <TR><TD>c</TD>
  <TD PORT="here">d</TD>
  <TD>e</TD>
  </TR>
  <TR><TD COLSPAN="3">f</TD>
  </TR>
  </TABLE>>];
 }
2.6.2 使用label定义子节点
digraph structs {
  node [shape=record];
  struct1 [shape=record,label="<f0> left|<f1> middle|<f2> right"];
  struct2 [shape=record,label="<f0> one|<f1> two"];
  struct3 [shape=record,label="hello\nworld |{ b |{c|<here> d|e}| f}| g | h"];
  struct1:f1 -> struct2:f0;
  struct1:f2 -> struct3:here;
}

2.7 UML
ps 以下内容摘自: 【dot 语言画类图和 UML 关系】https://www.jianshu.com/p/58333e9314ff
2.7.1 类图
digraph Class{
    rankdir=BT; // 箭头从下到上
    // 默认方形
    node [shape = "record", fontname = "Consolas"]
    // 默认空箭头
    edge [arrowhead = "empty", fontname = "Consolas"]

    // + 公有 - 私有 # 保护 ~ 包级(默认) \l左对齐换行
    people [label = "{people
    | +name: String\l
    -age: int\l
    | +getAge(): int\l}"]
    // o- 表示接口
    study [label = "{o- study}"]

    // 继承 extends
    student -> people
    // 实现 implements
    student -> study [style="dashed"]
}

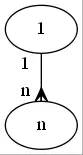
2.7.2 一对多
digraph {
    1 -> n [
        arrowhead = "crow"
        taillabel="1  "
        headlabel="n  "
    ]
}
2.7.3 多对多
digraph {
    1 -> n [
        dir = "both"
        arrowtail = "crow"
        arrowhead = "crow"
        taillabel="n  "
        headlabel="n  "
    ]
}
2.7.4 UML(统一建模语言)关系
digraph UML{
    rankdir=LR
    // 设置字体防止乱码
    fontname = "Microsoft YaHei"
    node [fontname = "Microsoft YaHei"]
    edge [fontname = "Microsoft YaHei"]

    子类 -> 父类
    [label = "1继承泛化
    Generalization
    extends"
    arrowhead = "empty"]

    接口[label = "接口
    interface"]

    实现 -> 接口
    [label = "2实现
    Realization
    implements "
    arrowhead = "empty"
    style="dashed"]

    主体 -> 工具
    [label = "3依赖
    Dependency"
    arrowhead = "vee"
    style="dashed"]


    主人 -> 被拥有
    [label = "4.1关联
    Association"
    arrowhead = "vee"]

    A -> B
    [label = "4.2双向关联"
    arrowhead = "none"]

    C -> C
    [label = "4.3自身关联"
    arrowhead = "vee"]


    成员 -> 整体
    [label = "5聚合
    Aggregation"
    dir = "both"
    arrowtail = "vee"
    arrowhead = "odiamond"]

    部分 -> 总体
    [label = "6.组合
    Composition"
    dir = "both"
    arrowhead = "diamond"
    arrowtail = "vee"]
}

2.8 高级用法
ps 内容摘自【使用graphviz绘制流程图(2015版)http://icodeit.org/2015/11/using-graphviz-drawing/?from=timeline】
2.8.1 软件模块组成图

IDP支持层为一个相对独立的子系统,其中包括如数据库管理器,配置信息管理器等模块,另外为了提供更大的灵活性,将很多其他的模块抽取出来作为外部模块,而支持层提供一个模块管理器,来负责加载/卸载这些外部的模块集合。
这些模块间的关系较为复杂,并且有部分模块关系密切,应归类为一个子系统中,上图对应的dot脚本为:
digraph idp_modules{

  rankdir = TB;
  fontname = "Microsoft YaHei";
  fontsize = 12;

  node [ fontname = "Microsoft YaHei", fontsize = 12, shape = "record" ];
  edge [ fontname = "Microsoft YaHei", fontsize = 12 ];

      subgraph cluster_sl{
          label="IDP支持层";
          bgcolor="mintcream";
          node [shape="Mrecord", color="skyblue", style="filled"];
          network_mgr [label="网络管理器"];
          log_mgr [label="日志管理器"];
          module_mgr [label="模块管理器"];
          conf_mgr [label="配置管理器"];
          db_mgr [label="数据库管理器"];
      };

      subgraph cluster_md{
          label="可插拔模块集";
          bgcolor="lightcyan";
          node [color="chartreuse2", style="filled"];
          mod_dev [label="开发支持模块"];
          mod_dm [label="数据建模模块"];
          mod_dp [label="部署发布模块"];
      };

  mod_dp -> mod_dev [label="依赖..."];
  mod_dp -> mod_dm [label="依赖..."];
  mod_dp -> module_mgr [label="安装...", color="yellowgreen", arrowhead="none"];
  mod_dev -> mod_dm [label="依赖..."];
  mod_dev -> module_mgr [label="安装...", color="yellowgreen", arrowhead="none"];
  mod_dm -> module_mgr [label="安装...", color="yellowgreen", arrowhead="none"];
}
2.8.2 状态图
有限自动机示意图
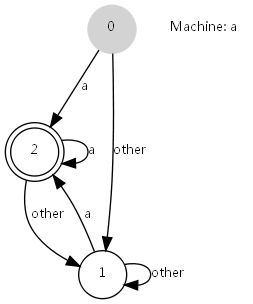
上图是一个简易有限自动机,接受a及a结尾的任意长度的串。其脚本定义如下:
digraph automata_0 {
  size = "8.5, 11";
  fontname = "Microsoft YaHei";
  fontsize = 10;

  node [shape = circle, fontname = "Microsoft YaHei", fontsize = 10];
  edge [fontname = "Microsoft YaHei", fontsize = 10];

  0 [ style = filled, color=lightgrey ];
  2 [ shape = doublecircle ];

  0 -> 2 [ label = "a " ];
  0 -> 1 [ label = "other " ];
  1 -> 2 [ label = "a " ];
  1 -> 1 [ label = "other " ];
  2 -> 2 [ label = "a " ];
  2 -> 1 [ label = "other " ];

  "Machine: a" [ shape = plaintext ];
}
形状值为plaintext的表示不用绘制边框,仅展示纯文本内容,这个在绘图中,绘制指示性的文本时很有用,如上图中的Machine: a。
- OSGi中模块的生命周期图
OSGi中,模块具有生命周期,从安装到卸载,可能的状态具有已安装,已就绪,正在启动,已启动,正在停止,已卸载等。如下图所示:

digraph module_lc{
  rankdir=TB;
  fontname = "Microsoft YaHei";
  fontsize = 12;

  node [fontname = "Microsoft YaHei", fontsize = 12, shape = "Mrecord", color="skyblue", style="filled"];
  edge [fontname = "Microsoft YaHei", fontsize = 12, color="darkgreen" ];

  installed [label="已安装状态"];
  resolved [label="已就绪状态"];
  uninstalled [label="已卸载状态"];
  starting [label="正在启动"];
  active [label="已激活(运行)状态"];
  stopping [label="正在停止"];
  start [label="", shape="circle", width=0.5, fixedsize=true, style="filled", color="black"];

  start -> installed [label="安装"];
  installed -> uninstalled [label="卸载"];
  installed -> resolved [label="准备"];
  installed -> installed [label="更新"];
  resolved -> installed [label="更新"];
  resolved -> uninstalled [label="卸载"];
  resolved -> starting [label="启动"];
  starting -> active [label=""];
  active -> stopping [label="停止"];
  stopping -> resolved [label=""];
}

digraph finite_state_machine {
  rankdir = LR;
  size = "8,5"

  node [shape = doublecircle];

  LR_0 LR_3 LR_4 LR_8;

  node [shape = circle];

  LR_0 -> LR_2 [ label = "SS(B)" ];
  LR_0 -> LR_1 [ label = "SS(S)" ];
  LR_1 -> LR_3 [ label = "S($end)" ];
  LR_2 -> LR_6 [ label = "SS(b)" ];
  LR_2 -> LR_5 [ label = "SS(a)" ];
  LR_2 -> LR_4 [ label = "S(A)" ];
  LR_5 -> LR_7 [ label = "S(b)" ];
  LR_5 -> LR_5 [ label = "S(a)" ];
  LR_6 -> LR_6 [ label = "S(b)" ];
  LR_6 -> LR_5 [ label = "S(a)" ];
  LR_7 -> LR_8 [ label = "S(b)" ];
  LR_7 -> LR_5 [ label = "S(a)" ];
  LR_8 -> LR_6 [ label = "S(b)" ];
  LR_8 -> LR_5 [ label = "S(a)" ];
}
2.8.3 时序图

digraph G {
    rankdir="LR";
    node[shape="point", width=0, height=0];
    edge[arrowhead="none", style="dashed"]

    {
        rank="same";
        edge[style="solided"];
        LC[shape="plaintext"];
        LC -> step00 -> step01 -> step02 -> step03 -> step04 -> step05;
    }

    {
        rank="same";
        edge[style="solided"];
        Agency[shape="plaintext"];
        Agency -> step10 -> step11 -> step12 -> step13 -> step14 -> step15;
    }

    {
        rank="same";
        edge[style="solided"];
        Agent[shape="plaintext"];
        Agent -> step20 -> step21 -> step22 -> step23 -> step24 -> step25;
    }

    step00 -> step10 [label="sends email new custumer", arrowhead="normal"];
    step11 -> step01 [label="declines", arrowhead="normal"];
    step12 -> step02 [label="accepts", arrowhead="normal"];
    step13 -> step23 [label="forward to", arrowhead="normal"];
    step24 -> step14;
    step14 -> step04 [arrowhead="normal"];
}
rankdir="LR"表示,布局从左L到右R。可以看到,在代码中有{}括起来的部分。
{
    rank="same";
    edge[style="solided"];
    Agency[shape="plaintext"];
    Agency -> step10 -> step11 -> step12 -> step13 -> step14 -> step15;
}
每一个rank="same"的block中的所有节点都会在同一条线上。我们设置了所有的线为虚线,但是在该block中,将线改为solided。
通过上面几篇博客的介绍,大致了解了dot语言的语法以及作用。发现它还是非常强大和灵活的。只要能够发挥你的组合及想象能力,肯定是能够满足一些基本文档图表的绘制需求。而且还摆脱了普通制图功能繁琐的排版工作,还是非常适合有一定编程基础的用户使用的。简直是一门很值得去学习了解的脚本语言。
更多的学习可以参考
官方文档地址:https://graphviz.gitlab.io/documentation/
官方pdf学习文档地址:https://graphviz.gitlab.io/_pages/pdf/dotguide.pdf
三、学习Graphviz
3.1 What is Graphviz?
官网描述如下所示:

Graphviz is open source graph visualization software. Graph visualization is a way of representing structural information as diagrams of abstract graphs and networks. It has important applications in networking, bioinformatics, software engineering, database and web design, machine learning, and in visual interfaces for other technical domains.
翻译过来大致如下:
Graphviz是一个开源的图形可视化软件。图形可视化是将结构信息表示为抽象图形和网络图的一种方法。它在网络、生物信息学、软件工程、数据库和web设计、机器学习以及其他技术领域的可视化界面中有着重要的应用。
3.2 Features

The Graphviz layout programs take descriptions of graphs in a simple text language, and make diagrams in useful formats, such as images and SVG for web pages; PDF or Postscript for inclusion in other documents; or display in an interactive graph browser. Graphviz has many useful features for concrete diagrams, such as options for colors, fonts, tabular node layouts, line styles, hyperlinks, and custom shapes.
翻译过来大致如下:
Graphviz 布局程序使用简单的文本语言对图形进行描述,并以有用的格式制作图表,例如用于网页的图像和svg;用于包含在其他文档中的pdf或postscript;或显示在交互式图形浏览器中。graphviz对于具体的图表有许多有用的特性,例如颜色、字体、表格节点布局、线条样式、超链接和自定义形状的选项。
3.3 Roadmap


dot - “hierarchical” or layered drawings of directed graphs. This is the default tool to use if edges have directionality.
翻译过来大致如下:
点-有向图的层次或分层图。如果边具有方向性,则这是要使用的默认工具。
这就是我们需要的dot文件。
3.4 Download
我们去下面这个【Graphviz软件下载地址 : https://graphviz.gitlab.io/download/】

因为电脑是window系统,所以找到【Stable 2.38 Windows install packages】进行下载,地址为:https://graphviz.gitlab.io/_pages/Download/Download_windows.html

进入到下载地址,选择合适的安装包下载即可,这里我选择zip格式下载,地址为:https://graphviz.gitlab.io/_pages/Download/windows/graphviz-2.38.zip
如下所示:

打开该压缩包,内容如下所示:

我将压缩包解压到目录:C:\Program Files (x86)\graphviz-2.38\release,如下所示

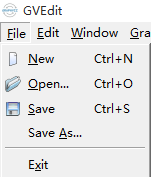
3.5 使用gvedit
进入到 C:\Program Files (x86)\graphviz-2.38\release\bin 目录,打开gvedit.exe程序,下面的GVedit.html是指导文档

打开gvedit程序,如下所示。

-
参考下面的GVedit.html是指导文档

-
File:
-
New: Creates a blank text window. You can use it to write a description of a graph in the DOT language. New graphs are not saved to disk until you save them manually.
-
Open: Opens a file dialogue box to select and load a DOT file into the editor. Each file is opened in a new window and does not affect other open graphs.
-
Save: Saves the active graph to disk. If the active graph is new and does not have a name, it opens a Save As dialogue to allow you to specify the file’s name before saving.
-
Save as: Opens a Save As dialogue to save the active graph. You can save a graph under different names but you will always be working with the most recently saved graph.
-
Close: Closes the active graph window. If there are any unsaved changes, you get a dialogue box asking if you want to save the changes before closing the graph.
-
-
Edit:
-
Undo : This command rolls back the last thing that you have done within the active graph.
-
Cut : Removes selected text and keeps it in the clipboard.
-
Copy: Copies selected text to the clipboard.
-
Paste: Inserts the text from the clipboard into the cursor position on the active graph.
-
Find: Opens the find dialogue box to allow you to locate desired text in a graph.
-
-
Graphviz
-
Run: Processes the active graph with the last attributes that were used for it. If the active graph has never been processed before, it opens the settings window.
-
Settings: Opens the settings window. Details of this window are given below.
-
-
View
-
Cascade: Sets the style for handling multiple windows to cascade, in which each new window overlaps the previous one.
-
Tile: Sets the style for handling multiple windows to tiling, in which the open graph windows partition the root window.
-
-
Help
-
Help: Opens a manual page describing how to use this program.
-
Graphviz on net: Opens a browser window on the Graphviz home page.
-
About GVedit: Provides version information about the program.
-
3.5.1 使用gvedit打开dot文件
按照上面的指导文档,我们打开之前的x.dot文件,如下所示

x.dot 源代码
digraph "com.amap.api.col.sl3.x" {
    graph [bgcolor="transparent",pad="0.555"];
    node [color="#00BFC4",fillcolor="#00BFC440",fontcolor="#333333",fontname=Helvetica,shape=box,style=filled];
    edge [fontname=Helvetica];
    rankdir = TB;
    "x" [color="#CCCC66",fillcolor="#CCCC6640"];
    "x:finalize()" [color="#000033",fillcolor="#00003340"];
    "x:setRenderer(GLSurfaceView$Renderer)" [color="#993399",fillcolor="#99339940"];
    "x$i:start()" [color="#66CC33",fillcolor="#66CC3340"];
    "x" -> "x:finalize()" [color="#0033FF",fontcolor="#0033FF"];
    "x" -> "x:setRenderer(GLSurfaceView$Renderer)" [color="#9999FF",fontcolor="#9999FF"];
    "x:setRenderer(GLSurfaceView$Renderer)" -> "x$i:start()" [color="#669933",fontcolor="#669933"];
}
生成的图像

3.5.2 使用gvedit编辑dot文件
比如我们【File】–>【New】
然后弹出下面的编辑界面

接着我们现在写一段dot脚本代码,如下所示
digraph demo_graph {
  bgcolor=beige
  fontcolor=gray10
  fontsize=12
  label="this is demo"
  rankdir=TB

  {rank=same; "level1" "a-level1" "b-level1" "c-level1"}
  {rank=same; "level2" "d-level2" "e-level2"}
  {rank=same; "level3" "f-level3" "g-level3" "h-level3" "i-level3" "j-level3"}
  {rank=same; "level4" "k-level4"}
  "level1"->"level2"->"level3"->"level4"
  "a-level1"->"d-level2"
  "e-level2"->{"h-level3", "k-level4"}
  "b-level1"->{"e-level2", "f-level3", "i-level3", "k-level4"}
  "c-level1"->{"d-level2", "g-level3", "h-level3"}
  "j-level3"->{"f-level3", "k-level4"}
}

然后我们点击【Layout】按钮,即可转图像

转完之后,如下所示

四、VSCode 安装Graphviz 插件
现在VSCode这么火,当然也想看看VSCode是否支持Graphviz 。打开搜索下Graphviz 插件,如下所示:

安装下这两个插件试一试
- Graphviz (dot) language support for Visual Studio Code
- Graphviz Preview
如下图所示,安装好了:


在VSCode上面也可以通过安装插件的方式打开和编辑dot文件了。
-
源代码

-
预览图

五、参考资料
-
节点、边和图形属性 Node, Edge and Graph Attributes : https://graphviz.gitlab.io/_pages/doc/info/attrs.html
-
The DOT Language :https://www.cnblogs.com/itzxy/p/7860073.html
-
在 org-mode 中使用 Graphviz 畫關係圖 https://coldnew.github.io/787b7d73/
-
【使用graphviz绘制流程图(2015版)http://icodeit.org/2015/11/using-graphviz-drawing/?from=timeline】
-
dot language 学习笔记:https://www.cnblogs.com/billnote/p/4043267.html
-
官方pdf学习文档地址:https://graphviz.gitlab.io/_pages/pdf/dotguide.pdf

作者:欧阳鹏 欢迎转载,与人分享是进步的源泉!
转载请保留原文地址:https://ouyangpeng.blog.csdn.net/article/details/100925405
☞ 本人QQ: 3024665621
☞ QQ交流群: 123133153
☞ github.com/ouyangpeng
☞ [email protected]
————————————————
版权声明:本文为CSDN博主「欧阳鹏」的原创文章,遵循 CC 4.0 BY-SA 版权协议,转载请附上原文出处链接及本声明。
原文链接:https://ouyangpeng.blog.csdn.net/article/details/100700954