ZedGraph控件实现使用鼠标拖动坐标轴移动曲线
背景
在使用曲线控件进行数据展示时为了方便通过曲线对数据进行分析,会对控件的操作体验要求比较高,其中就是通过鼠标拖拽坐标轴实现曲线的移动。
原图
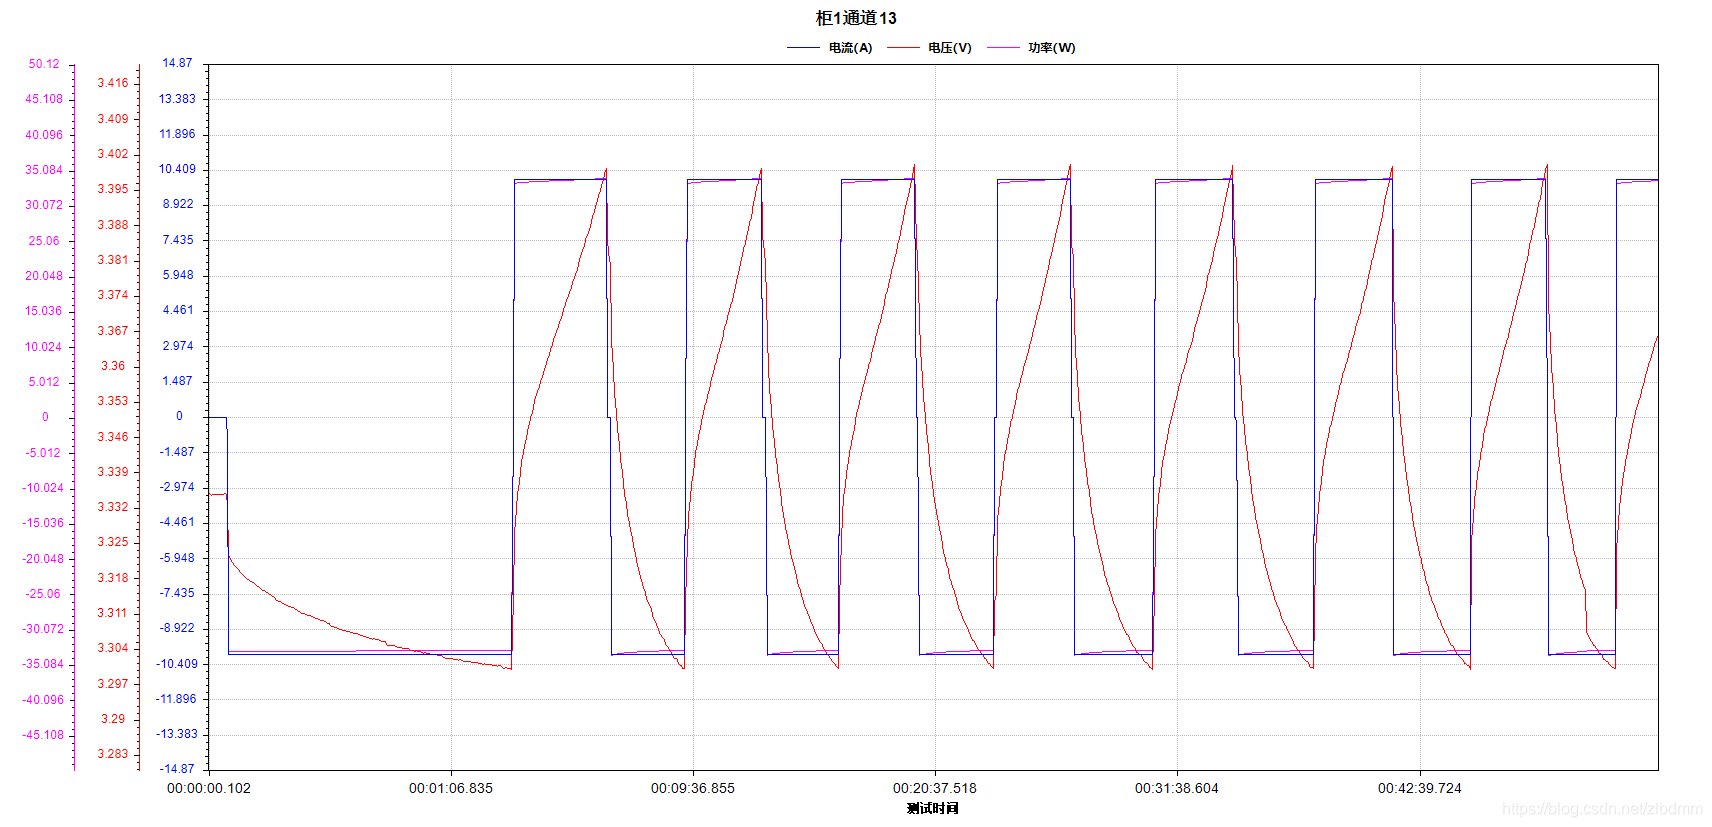
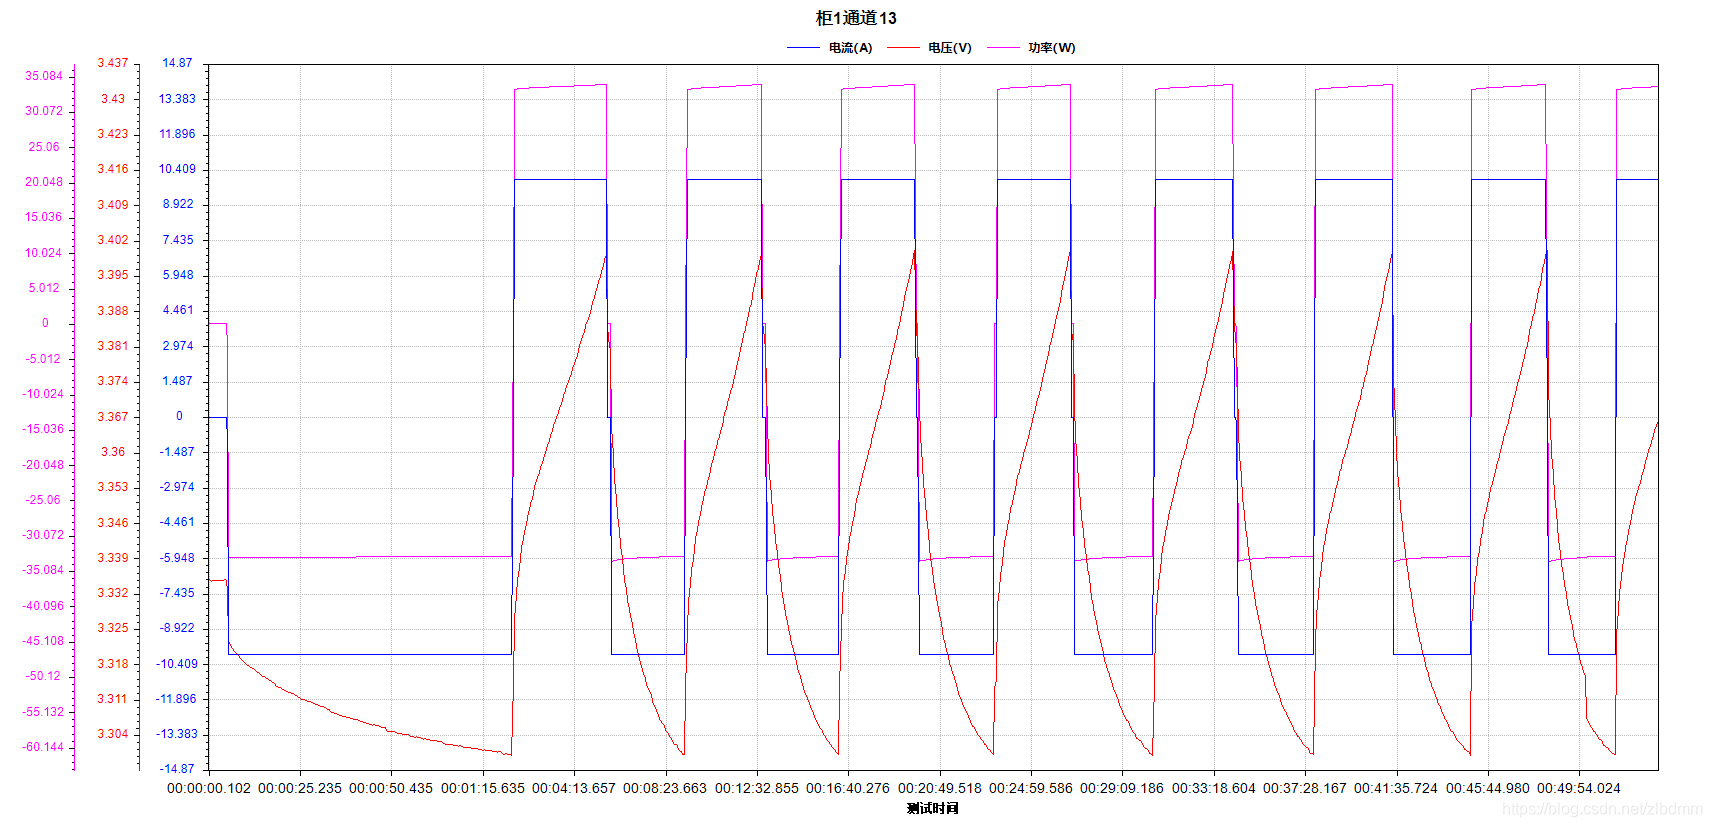
如果使用鼠标拖动功率坐标轴(最左侧的Y轴)上移,拖动电压坐标轴(中间的Y轴)下移,实现如下图效果:
实现的关键代码如下:
1、订阅ZedGraph控件(假如控件的Name为zgc)的鼠标相关事件
//拖动移动坐标轴相关
zgc.MouseDownEvent -= zgc_MouseDownEvent;           //鼠标放下事件
zgc.MouseDownEvent += zgc_MouseDownEvent;           //鼠标放下事件
zgc.MouseUpEvent -= zgc_MouseUpEvent;               //鼠标拿起事件
zgc.MouseUpEvent += zgc_MouseUpEvent;               //鼠标拿起事件
zgc.MouseMoveEvent -= zgc_MouseMoveEvent;           //鼠标移动事件
zgc.MouseMoveEvent += zgc_MouseMoveEvent;           //鼠标移动事件
2、各事件处理程序如下
#region 鼠标放下事件
/// <summary>
/// 鼠标放下事件
/// </summary>
/// <param name="sender"></param>
/// <param name="e"></param>
/// <returns></returns>
private static bool zgc_MouseDownEvent(ZedGraphControl sender, MouseEventArgs e)
{
    //初始化起始坐标点
    float startX = 0;
    //其中Rect:
    //获取或设置包含由轴(x轴、y轴和y2轴)限定的区域的矩形。
    //如果手动设置此值,则IsRectAuto值将自动设置为false。
    //X是获取矩形区域左上角的坐标
    float endX = sender.GraphPane.Chart.Rect.X;
    //如果鼠标落下的位置在此范围内 0到 矩形区域左上角的图标 即鼠标落点在Y轴的区域
    if (e.X > startX && e.X < endX)
    {
        //拖拽Y轴标识改为true
        isDragYAxis = true;
        //开始拖拽时Y的坐标值 = 鼠标的Y坐标
        startYPosition = e.Y;
        //获取Y轴的数量
        int yAxisCount = sender.GraphPane.YAxisList.Count;
        //就是获取Y左边Y轴的区域除以Y轴的数量 就是每个Y轴的单位宽度
        float unit = (endX - startX) / yAxisCount;
        //通过循环获取自己要拖拽哪个Y轴
        for (int i = 0; i < yAxisCount; i++)
        {
            //如果鼠标所在的X坐标对应Y轴的区域内
            if (e.X < unit * (i + 1) && e.X > unit * i)
            {
                //拖拽的Y轴的索引就是反顺序的索引
                dragYAxis = sender.GraphPane.YAxisList[yAxisCount - (i + 1)];
                break;
            }
        }
    }

    //否则就是拖拽X轴
    //sender.GraphPane.Chart.Rect.Y 获取左上角的Y坐标 再加上区域高度
    float startY = sender.GraphPane.Chart.Rect.Y + sender.GraphPane.Chart.Rect.Height;
    float endY = sender.GraphPane.Rect.Height;
    if (e.Y > startY && e.Y < endY)
    {
        //将拖拽X轴设置为true
        isDragXAxis = true;
        startXPosition = e.X;
        float unit = (endY - startY);
        dragXAxis = sender.GraphPane.XAxis;
    }

    //鼠标落下时的起点
    if (e.Button == MouseButtons.Left)
    {
        //获取鼠标左键的坐标点
        Point mouseDownLocation = new Point(e.X, e.Y);
        GraphPane myPane = sender.GraphPane;
        //获取点击点的坐标值
        DxValue = e.X;
        DyValue = e.Y;

    }
    else
    {
        DxValue = 0;
        DyValue = 0;
    }
    return default(bool);
}

#endregion

#region 鼠标拿起事件
/// <summary>
/// 鼠标拿起事件
/// </summary>
/// <param name="sender"></param>
/// <param name="e"></param>
/// <returns></returns>
private static bool zgc_MouseUpEvent(ZedGraphControl sender, MouseEventArgs e)
{
    isDragYAxis = false;
    isDragXAxis = false;
    // 判断是否拖拽的up点
    if (e.Button == MouseButtons.Left)
    {
        Point mouseDownLocation = new Point(e.X, e.Y);
        GraphPane myPane = sender.GraphPane; //获取点击点的坐标值
        UxValue = e.X;
        UyValue = e.Y;
    }
    else
    {
        UxValue = 0;
        UyValue = 0;
    }
    return default(bool);
}

#endregion

#region 鼠标移动事件
/// <summary>
/// 鼠标移动事件
/// </summary>
/// <param name="sender"></param>
/// <param name="e"></param>
/// <returns></returns>
private static bool zgc_MouseMoveEvent(ZedGraphControl sender, MouseEventArgs e)
{
    //如果是拖动Y轴
    if (isDragYAxis)
    {
        //速度
        float rate = (e.Y - startYPosition) / sender.GraphPane.Chart.Rect.Height;
        //距离
        float diff = rate * (float)(dragYAxis.Scale.Max - dragYAxis.Scale.Min);
        if (rate >= 0.01)
        {
            //Y轴的刻度最大值加上距离
            dragYAxis.Scale.Max += diff;
            //Y轴刻度的最小值加上距离
            dragYAxis.Scale.Min += diff;
            startYPosition = e.Y;
            //当前的最大最小值
            PointPair pp = new PointPair(dragYAxis.Scale.Min, dragYAxis.Scale.Max);
            //刷新曲线图
            sender.AxisChange();
            sender.Invalidate();

        }
        else if (rate <= -0.01)
        {
            dragYAxis.Scale.Max += diff;
            dragYAxis.Scale.Min += diff;
            startYPosition = e.Y;
            //当前的最大最小值
            PointPair pp = new PointPair(dragYAxis.Scale.Min, dragYAxis.Scale.Max);
            sender.AxisChange();
            sender.Invalidate();

        }
    }
    //拖拽X轴
    if (isDragXAxis)
    {
        float rate = (e.X - startXPosition) / sender.GraphPane.Chart.Rect.Width;
        float diff = rate * (float)(dragXAxis.Scale.Max - dragXAxis.Scale.Min);
        if (rate >= 0.01)
        {
            dragXAxis.Scale.Max -= diff;
            dragXAxis.Scale.Min -= diff;
            startXPosition = e.X;

            //当前的最大最小值
            PointPair pp = new PointPair(dragXAxis.Scale.Min, dragXAxis.Scale.Max);

            sender.AxisChange();
            sender.Invalidate();
        }
        else if (rate <= -0.01)
        {
            dragXAxis.Scale.Max -= diff;
            dragXAxis.Scale.Min -= diff;
            startXPosition = e.X;
            //当前的最大最小值
            PointPair pp = new PointPair(dragXAxis.Scale.Min, dragXAxis.Scale.Max);

            sender.AxisChange();
            sender.Invalidate();
        }
    }

    //判断是否拖拽的up点
    if (e.Button == MouseButtons.Left)
    {
        Point mouseDownLocation = new Point(e.X, e.Y);
        GraphPane myPane = sender.GraphPane; //获取点击点的坐标值
        UxValue = e.X;
        UyValue = e.Y;
    }
    else
    {
        UxValue = 0;
        UyValue = 0;
    }
    return default(bool);
}

#endregion
