上一篇: 平行坐标系折线图
代码结构和初始化画布的Chart对象介绍,请先看 这里
本图完整的源码地址: 这里
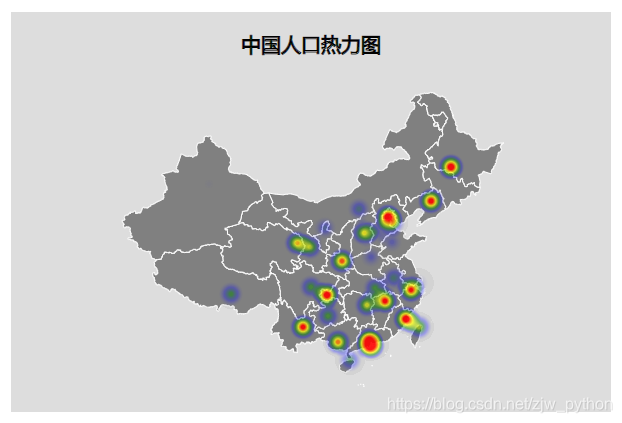
1 图表效果
2 数据
本文源码中提供了中国地图的GeoJson数据, 点击这里下载,如果想获取其他地区的数据,可参考这篇文章
3 关键代码
导入GeoJson格式的地图数据
d3.json('./china.json').then(function(data){
....
一些简单样式和标题的配置
const config = {
        margins: {top: 70, left: 80, bottom: 30, right: 80},
        textColor: 'black',
        title: '中国人口热力图'
    }
定义投影系统,包括中心点,比例以及偏移位置等
/* ----------------------------尺度转换------------------------  */
    const projection = d3.geoMercator()
                            .center([104, 38])
                            .scale(355)
                            .translate([chart.getBodyWidth()/2, chart.getBodyHeight()/2])
首先渲染地图轮廓,这个步骤和之前中国地图那篇文章的步骤相同
/* ----------------------------渲染地图轮廓------------------------  */
    chart.renderMap = function(){
        const path = d3.geoPath()
                        .projection(projection);

        let map = chart.body().selectAll('path')
                                .data(data.features);

            map.enter()
                 .append('path')
                 .attr('class', (d) => 'provinces ' + d.properties.name)
               .merge(map)
                 .attr('d', path)
                 .attr('stroke', 'white')
                 .attr('stroke-width', 1)
                 .attr('fill', 'gray');

            map.exit()
                .remove();
    }
接着就是渲染各省市中心的热力点,本文运用heatMap.js绘制热力点,并覆盖canvas在svg之上,这样就达到了效果,值得注意的是,heatMap.js的点坐标貌似必须为整数,不然渲染不出来。heatMap.js相关API和配置项可以参考官网
/* ----------------------------渲染省市中心点------------------------  */
    chart.renderCenter = function(){
        const heatMap = h337.create({
            container: chart.box().node(),
            maxOpacity: 0.9,
            minOpacity: 0.1,
            blur: 0.9,
            radius: 15,
            gradient: {
              '.1': 'gray',
              '.3': 'blue',
              '.5': 'green',
              '.7': 'yellow',
              '.9': 'red'
            }
        });

        const points = data.features.map((d) => ({
            x: Math.round(projection(d.properties.center)[0] + config.margins.left),
            y: Math.round(projection(d.properties.center)[1] + config.margins.top),
            value: d.properties.density
        }));

        heatMap.setData({
            max: 100,
            min: 0,
            data: points
        });
    }
最后就是绑定鼠标交互事件,悬停鼠标在省上时,省的边界变粗,且显示省的名字。值得注意的是,由于svg上面还有一层canvas,如果不做处理,那么鼠标事件无法被svg元素捕获,在这里给canvas画布添加css属性pointer-events: none,这样就正常了
/* ----------------------------绑定鼠标交互事件------------------------  */
    chart.addMouseOn = function(){
        //防抖函数
        function debounce(fn, time){
            let timeId = null;
            return function(){
                const context = this;
                const event = d3.event;
                timeId && clearTimeout(timeId)
                timeId = setTimeout(function(){
                    d3.event = event;
                    fn.apply(context, arguments);
                }, time);
            }
        }

        d3.selectAll('.provinces')
            .on('mouseover', function(d){
                const e = d3.event;
                const position = d3.mouse(chart.svg().node());

                d3.select(e.target)
                    .attr('stroke-width', 2);

                chart.svg()
                    .append('text')
                    .classed('tip', true)
                    .attr('x', position[0]+5)
                    .attr('y', position[1])
                    .attr('fill', config.textColor)
                    .text(d.properties.name);
            })
            .on('mouseleave', function(d,i){
                const e = d3.event;

                d3.select(e.target)
                    .attr('stroke-width', 1);

                d3.select('.tip').remove();
            })
            .on('mousemove', debounce(function(){
                    const position = d3.mouse(chart.svg().node());
                    d3.select('.tip')
                    .attr('x', position[0]+5)
                    .attr('y', position[1]-5);
                }, 6)
            );
    }
