问题驱动
为什么要安装这个组件?我只是想用Grafana。因为我遇到问题了,这个问题需要我安装Prometheus,具体原因,请看“性能测试(二)”。这就是问题驱动,我们就开始安装Prometheus吧!
Prometheus简介
Prometheus用于获取数据源,经常与Grafana一起使用,给Grafana提供数据。
安装配置
安装go语言环境
yum install -y epel-release
yum install go -y
go version
运行结果:

安装配置Prometheus
安装
下载安装文件:https://prometheus.io/download/
这是我下载的文件:prometheus-2.16.0-rc.1.linux-amd64.tar.gz
解压后,运行如下:
tar zxvf prometheus-2.16.0-rc.1.linux-amd64.tar.gz -C /usr/local/yeqinfang
cd /usr/local/yeqinfang/prometheus-2.16.0-rc.1.linux-amd64/
./prometheus
运行结果:
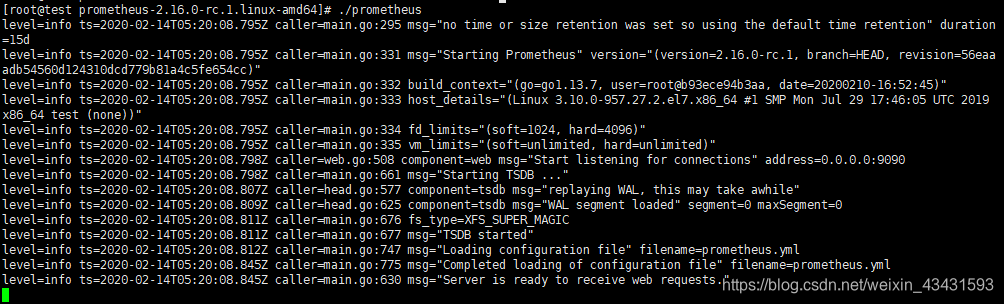
说明已经安装成功,我们先关掉,再去配置一下文件,如监控自己的主机。
关闭prometheus:
ps -a | grep prometheus
kill -TERM 进程ID
配置文件修改如下:
# my global config
global:
  scrape_interval:     15s # Set the scrape interval to every 15 seconds. Default is every 1 minute.
  evaluation_interval: 15s # Evaluate rules every 15 seconds. The default is every 1 minute.
  # scrape_timeout is set to the global default (10s).

# Alertmanager configuration
alerting:
  alertmanagers:
  - static_configs:
    - targets:
      # - alertmanager:9093

# Load rules once and periodically evaluate them according to the global 'evaluation_interval'.
rule_files:
  # - "first_rules.yml"
  # - "second_rules.yml"

# A scrape configuration containing exactly one endpoint to scrape:
# Here it's Prometheus itself.
scrape_configs:
  # The job name is added as a label `job=<job_name>` to any timeseries scraped from this config.
  - job_name: 'prometheus'

    # metrics_path defaults to '/metrics'
    # scheme defaults to 'http'.

    static_configs:
    - targets: ['localhost:3001']
上面的配置文件,最后一行更改了端口号为3001
接着运行文件:
./prometheus
运行结果并不是3001,而是默认的9090.这是为什么呢?原因应该是prometheus的这个端口,并不是服务起来的端口,以至于默认的9090改成了3001也没有用。
临时更改服务端口的办法:
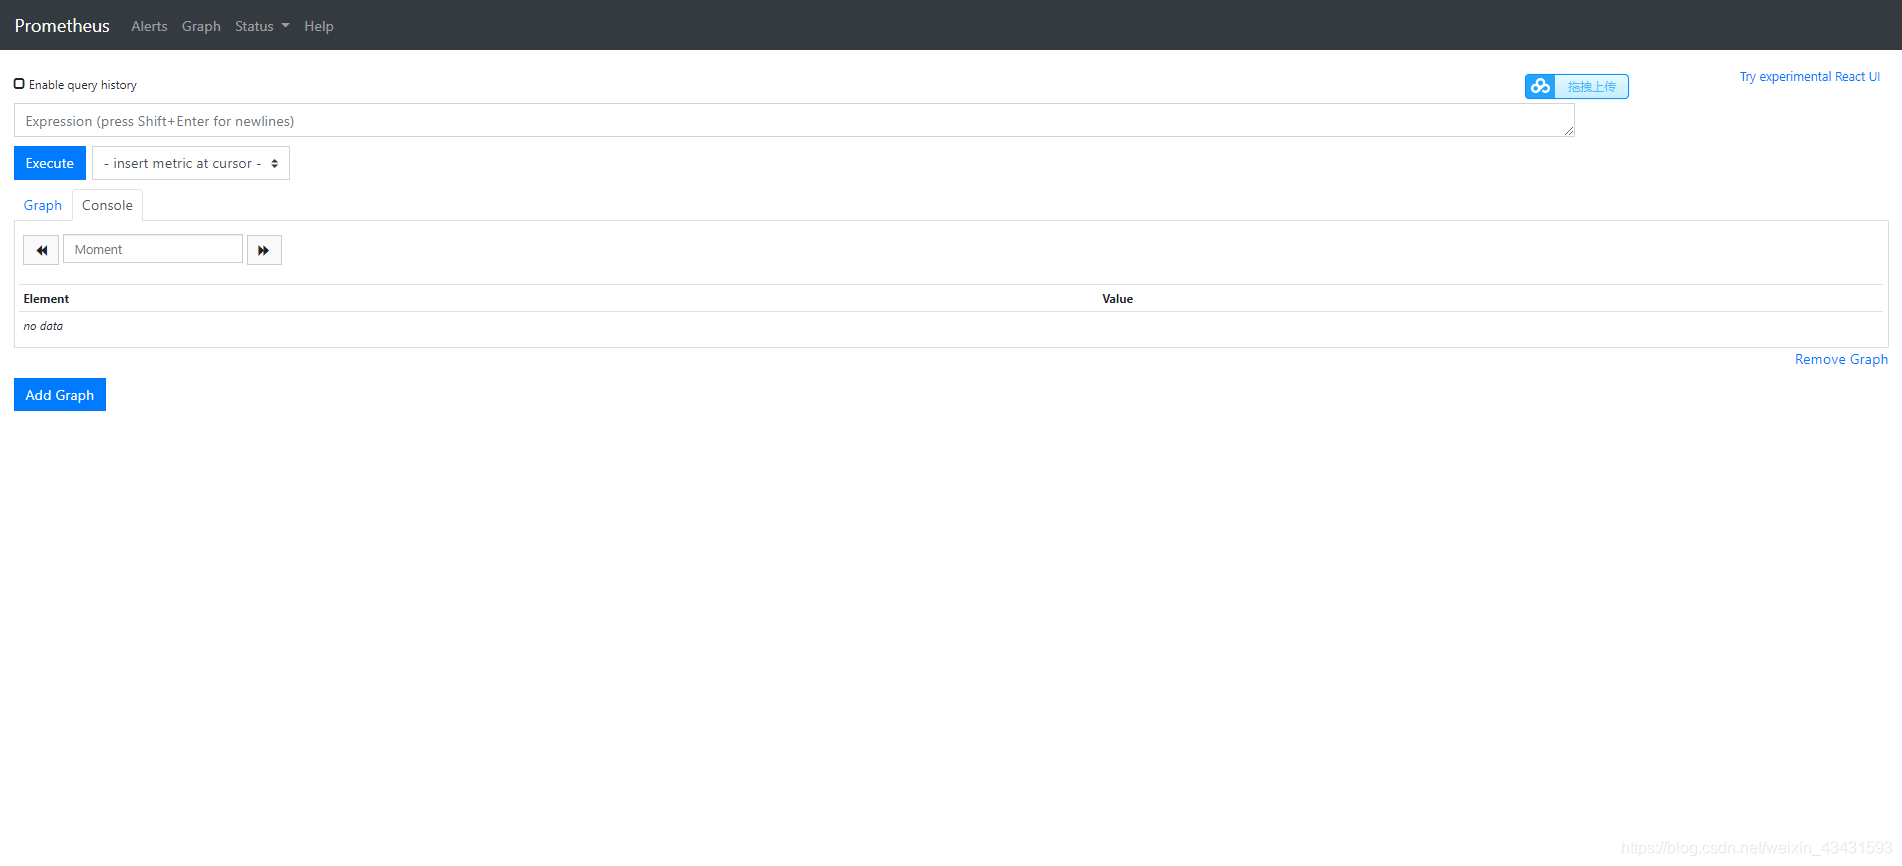
./prometheus --config.file=prometheus.yml --web.listen-address=:3001
上面试运行的时候加载了配置文件,并且指定了端口。再次运行之后,就解决了这个问题。打开界面如下:
 配置prometheus成自启动,这样就可以通过systemctl指令启动或关闭服务了:
touch /etc/systemd/system/prometheus.service
vim /etc/systemd/system/prometheus.service
文件编辑如下:
[Service]
ExecStart=/usr/local/yeqinfang/prometheus-2.16.0-rc.1.linux-amd64/prometheus \
  --config.file=/usr/local/yeqinfang/prometheus-2.16.0-rc.1.linux-amd64/prometheus.yml \
  --web.enable-admin-api \
  --web.listen-address=:3001
开启服务:
systemctl start prometheus.service
停止服务:
systemctl stop prometheus.service
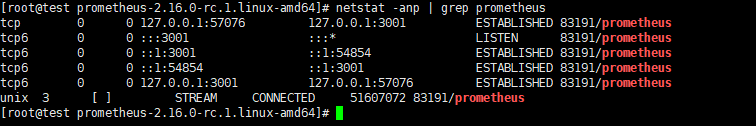
查看服务:
netstat -anp | grep prometheus
配置数据源
要获取linux系统的内存、cpu等信息,需要通过node_exporter插件完成.
通过以下网址查看版本信息:
https://github.com/prometheus/node_exporter/releases
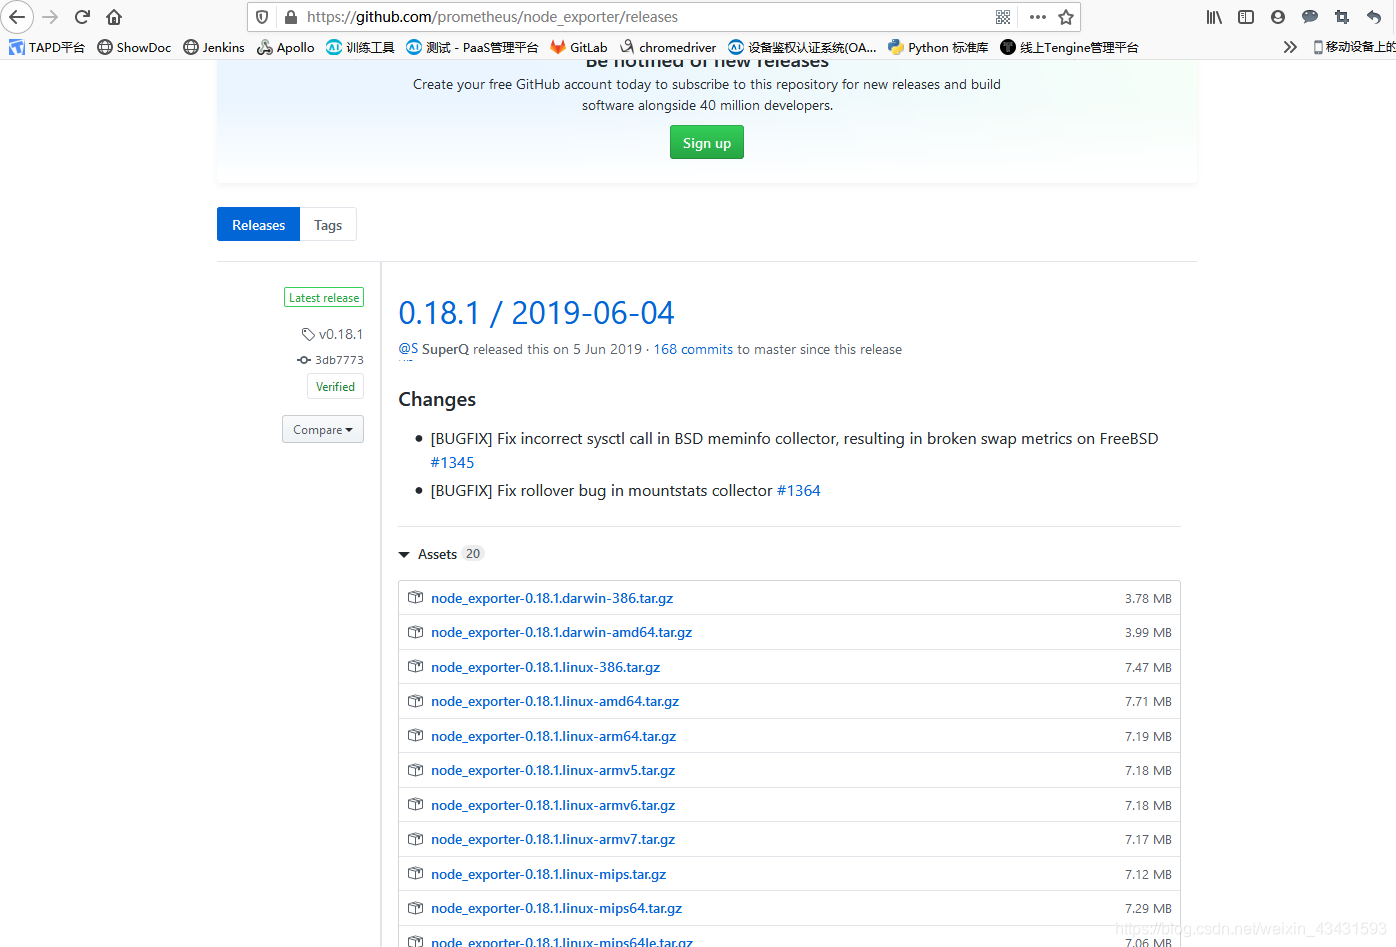
使用指令下载版本:
wget https://github.com/prometheus/node_exporter/releases/download/v0.18.1/node_exporter-0.18.1.linux-arm64.tar.gz
下载之后解压:
tar -xvf node_exporter-0.18.1.linux-amd64.tar.gz
后台运行
./node_exporter &
修改prometheus配置文件,末尾新增如下:
# my global config
global:
  scrape_interval:     15s # Set the scrape interval to every 15 seconds. Default is every 1 minute.
  evaluation_interval: 15s # Evaluate rules every 15 seconds. The default is every 1 minute.
  # scrape_timeout is set to the global default (10s).

# Alertmanager configuration
alerting:
  alertmanagers:
  - static_configs:
    - targets:
      # - alertmanager:9093

# Load rules once and periodically evaluate them according to the global 'evaluation_interval'.
rule_files:
  # - "first_rules.yml"
  # - "second_rules.yml"

# A scrape configuration containing exactly one endpoint to scrape:
# Here it's Prometheus itself.
scrape_configs:
  # The job name is added as a label `job=<job_name>` to any timeseries scraped from this config.
  - job_name: 'prometheus'

    # metrics_path defaults to '/metrics'
    # scheme defaults to 'http'.

    static_configs:
    - targets: ['localhost:3001']

  - job_name: 215-system-status
    static_configs:
    - targets: ['localhost:9100']
上面的9100是node_exporter端口,接着重新运行:
systemctl restart prometheus.service
登录prometheus,查看数据源状态:
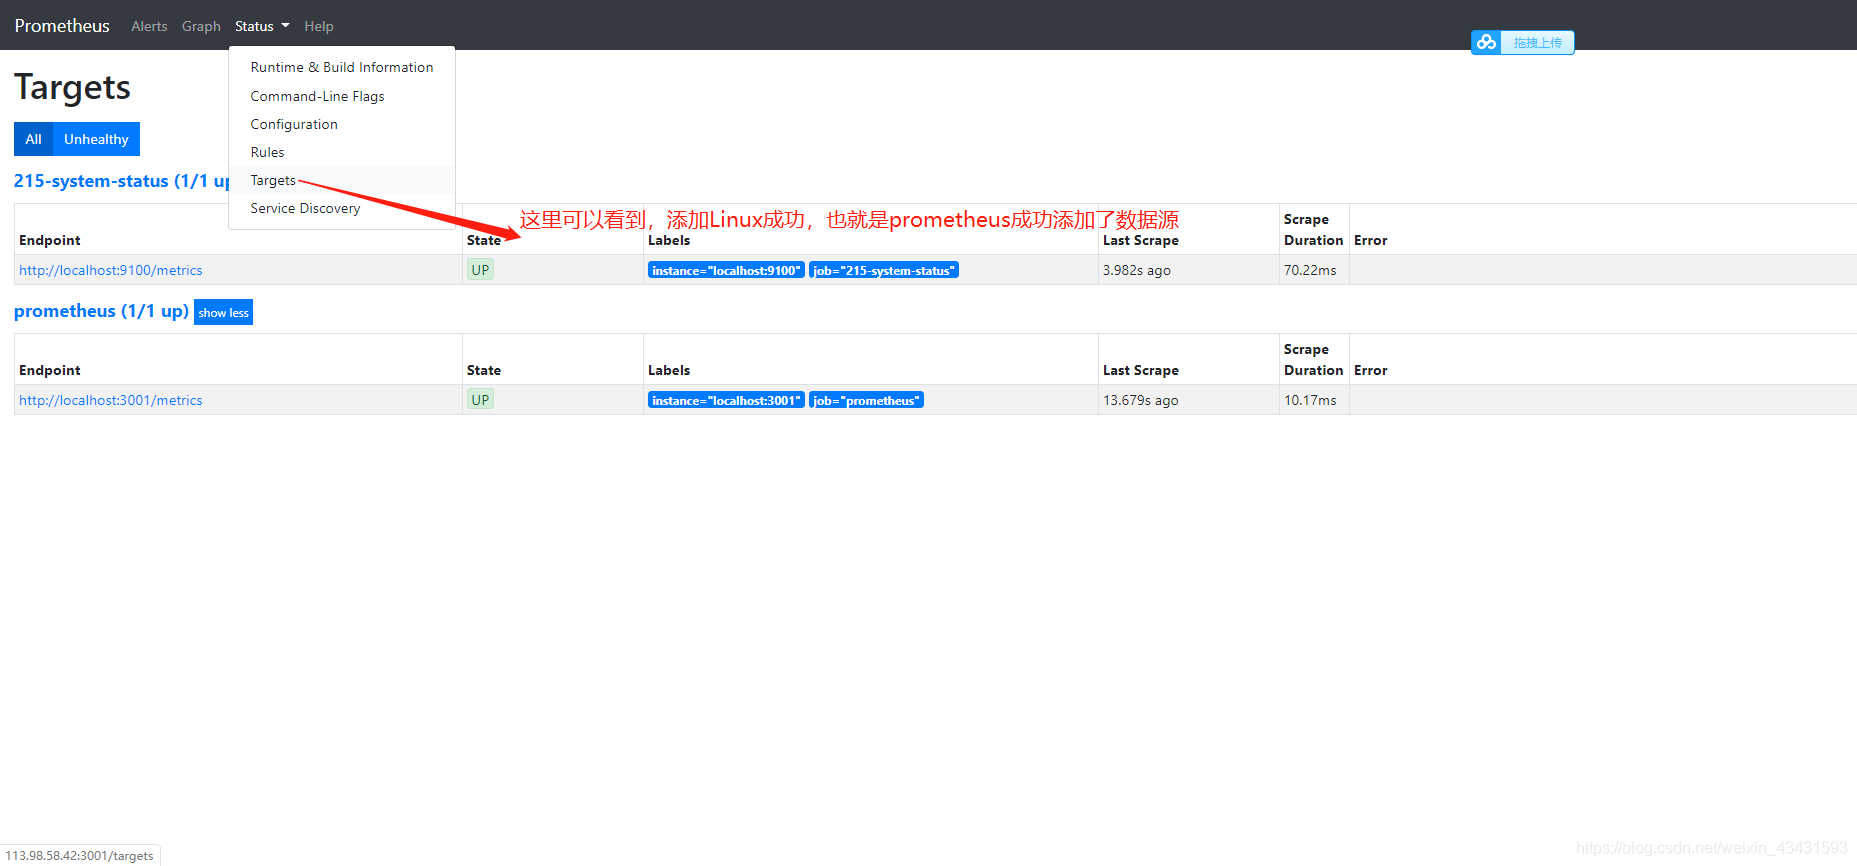 其他数据的配置,是一样的操作,这里不再累述。那么我们成功配置了数据源,可以去玩数据了。
