一、前言
在容器云的部署中,一个重要的准则是所有的容器以及容器内的进行都要以最低权限运行,所以一般情况下,一个应用程序的所有容器都是以非root权限运行的;另外,为了保证容器镜像的最小,一般debug相关的工具都不会随应用程序发布。在这种情况下,如果要对特定的容器进行debug,则必须让用户登录到特定的node,在宿主机系统空间运行debug命令,同时还要保证node上面有所有这些应用程序debug需要的工具。本文介绍的方案是在需要debug的时候,使用调试账户(具有一些特权)部署一个debug容器,包含应用程序debug所需要的各种通用或者专用工具。
转载自https://blog.csdn.net/cloudvtech
二、构建debug容器镜像
2.1 准备debug需要的工具集
gdb
strace
lsof
tcpdump
net-tools
ftp
openssh-clients
iproute
2.2 Dockerfile
FROM 200.222.0.178/centos73-base/master:7.3.0

LABEL maintainer "cloudvtech"

ADD bin/*   /usr/local/bin/
ADD repo/*  /etc/yum.repos.d/

RUN yum install -y gdb strace lsof tcpdump net-tools ftp openssh-clients iproute

ENTRYPOINT []
CMD ["/bin/bash”]
2.3 debug docker image大小
debug-container latest 92595bb6945e 31 seconds ago 308MB
转载自https://blog.csdn.net/cloudvtech
三、使用debug容器
3.1 部署应用程序
CONTAINER ID        IMAGE                                                                     COMMAND                  CREATED             STATUS              PORTS               NAMES
fe51426a027f        200.222.0.178/ats:latest                                                  "/bin/sh -c /start..."   2 hours ago         Up 2 hours                              test-ats
3.2 启动debug容器
docker run -it --pid=container:test-ats --net=container:test-ats --privileged debug-container sh
3.3 在debug容器内查看被debug容器内部的进程状态
sh-4.2# ps -ef
UID        PID  PPID  C STIME TTY          TIME CMD
... ...
root        18     0  0 02:44 ?        00:00:00 bash
root       631    18  0 02:45 ?        00:00:10 /bin/traffic_manager
root       639   631  1 02:45 ?        00:02:18 /bin/traffic_server -M --httpport 80:fd=6
root      2440     0  0 05:06 pts/0    00:00:00 sh
... ...
root      2459  2440  0 05:07 pts/0    00:00:00 ps -ef
3.4 在debug容器内运行strace
sh-4.2# strace -p 639
strace: Process 639 attached
epoll_wait(19, [], 32768, 10)           = 0
epoll_wait(19, [], 32768, 10)           = 0
epoll_wait(19, [], 32768, 10)           = 0
epoll_wait(19, [], 32768, 10)           = 0
epoll_wait(19, [], 32768, 10)           = 0
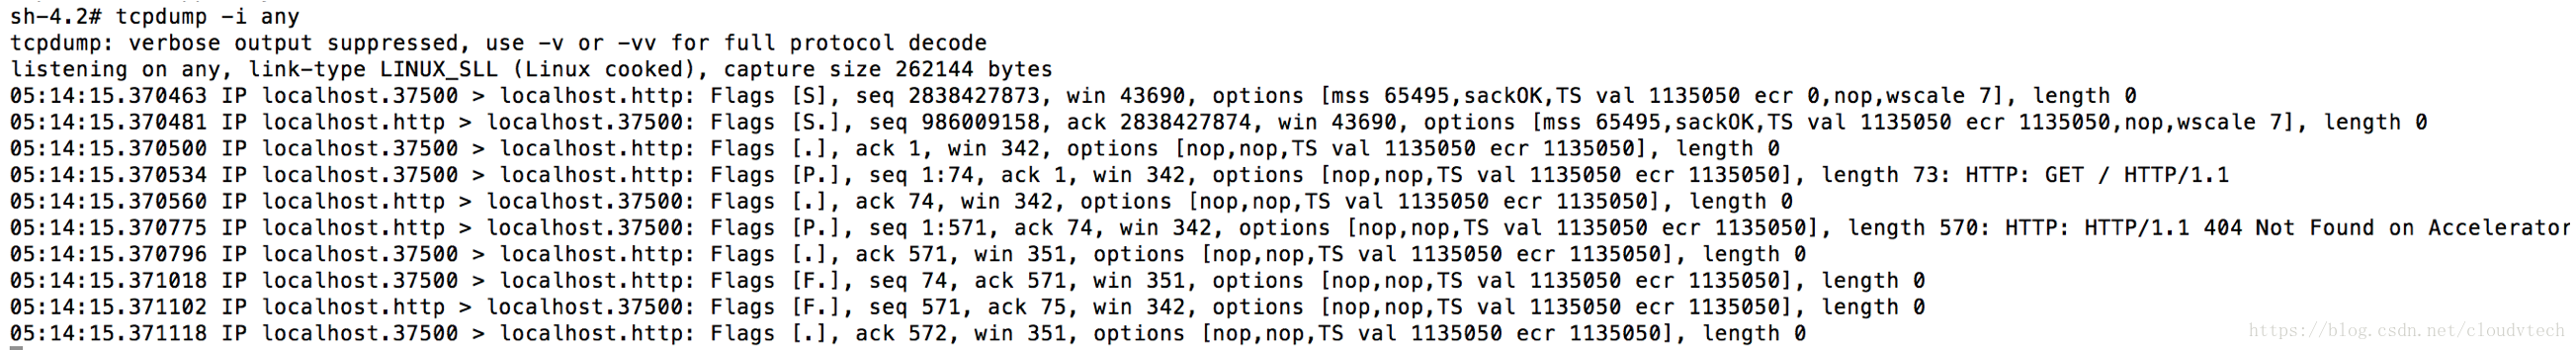
3.5 在debug容器内运行tcpdump
3.6 在debug容器内运行gdb
sh-4.2# ps -ef | grep traffic
root       631    18  0 02:45 ?        00:00:11 /bin/traffic_manager
root       639   631  1 02:45 ?        00:02:26 /bin/traffic_server -M --httpport 80:fd=6
root      2643  2440  0 05:15 pts/0    00:00:00 grep traffic

gdb /proc/639/root/bin/traffic_server
(gdb) attach 639
(gdb) bt
#0  0x00002b12acb2dd13 in epoll_wait () from /lib64/libc.so.6
#1  0x00000000006a6f96 in NetHandler::mainNetEvent (this=0x2b12ae1a3b20, event=<optimized out>, e=<optimized out>) at UnixNet.cc:310
#2  0x00000000006c9004 in handleEvent (this=<optimized out>, event=5, data=<optimized out>) at ./I_Continuation.h:147
#3  EThread::process_event (this=0x2b12ae1a0010, e=0x27cbe90, calling_code=5) at UnixEThread.cc:144
#4  0x00000000006c9cad in EThread::execute (this=<optimized out>) at UnixEThread.cc:268
#5  0x00000000004c1a9c in main (argv=<optimized out>) at Main.cc:1690
转载自https://blog.csdn.net/cloudvtech