文章目录
Trick100:加载大数据
有的时候加载大数据的时候,不需要加载全部,而是仅仅用百分之一进行框架的构建和测试。
# 加载全部数据
df = pd.read_csv("../input/us-accidents/US_Accidents_Dec19.csv")
print("The shape of the df is {}".format(df.shape))
def df
# 加载百分之一的数据
df = pd.read_csv("../input/us-accidents/US_Accidents_Dec19.csv", skiprows = lambda x: x>0 and np.random.rand() > 0.01)
print("The shape of the df is {}. It has been reduced 10 times!".format(df.shape))
skiprows中,x是整数的索引,x>0保证header不会被跳过,np.random().rand()>0.01说明跳过百分之99的数据
Trick99:Unnamed:0
读取数据的时候避免Unnamed:0 列
d = {\
"zip_code": [12345, 56789, 101112, 131415],
"factory": [100, 400, 500, 600],
"warehouse": [200, 300, 400, 500],
"retail": [1, 2, 3, 4]
}
df = pd.DataFrame(d)
df
# save to csv
df.to_csv("trick99data.csv")
先保存一个df

df = pd.read_csv("trick99data.csv")
df
df = pd.read_csv("trick99data.csv", index_col=0)
# or
# df = pd.read_csv("trick99data.csv", index = False)
df
我们可以发现,没有index_col=0或者index_col=False的时候,会有一列名为Unnamed:0的列,虽然我们后续可以使用drop直接删去,但是这样显得更专业不是?哈哈
trick 98:一个列很多的DF转化成行很多的
d = {\
"zip_code": [12345, 56789, 101112, 131415],
"factory": [100, 400, 500, 600],
"warehouse": [200, 300, 400, 500],
"retail": [1, 2, 3, 4]
}
df = pd.DataFrame(d)
df
df = df.melt(id_vars = "zip_code", var_name = "location_type", value_name = "distance")
df
主要是使用了pd.melt函数
- id_vars是保持不变的列
- value_vars是要变的列,如果没有就是全部列都转化
- var_names和value_name就是名字
我们可以发现是把(列的名字,列的值)转化为一行(val_names,value_name)
trick97:把年和那年第几天转化为具体日期
d = {\
"year": [2019, 2019, 2020],
"day_of_year": [350, 365, 1]
}
df = pd.DataFrame(d)
df
df["combined"] = df["year"]*1000 + df["day_of_year"]
df
df["date"] = pd.to_datetime(df["combined"], format = "%Y%j")
df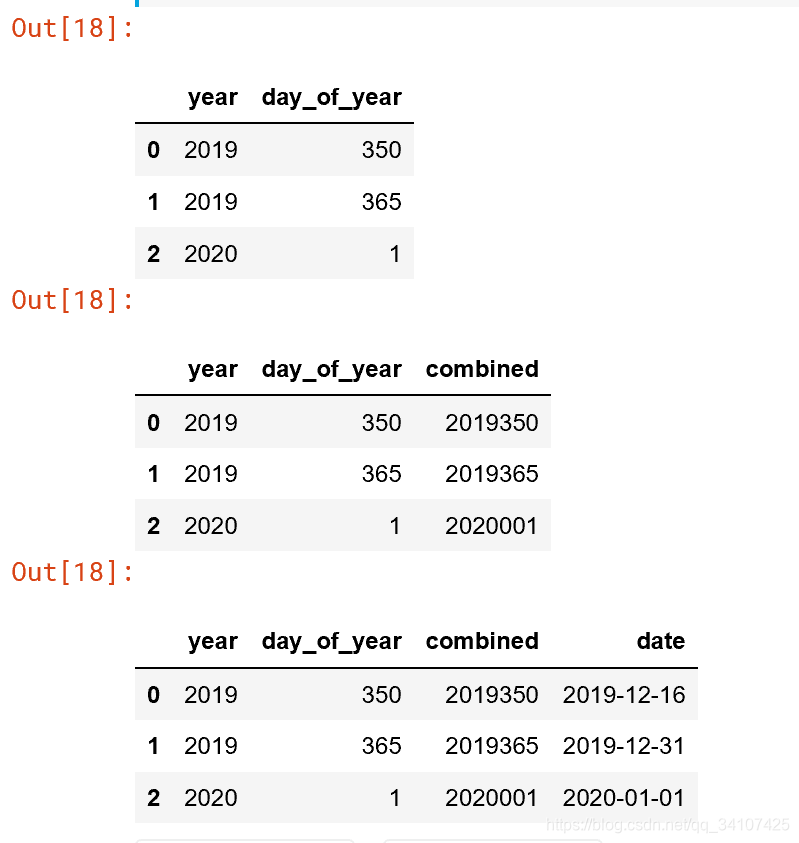
format:%Y%j
常见的还有%Y%m%D %H:%M:%S
trick 96:pandas作交互式图标
print(pd.__version__)
# Pandas version 0.25 or higher requiered and you need hvplot
# 这个不是交互的
df.plot(kind = "scatter", x = "spirit_servings", y = "wine_servings")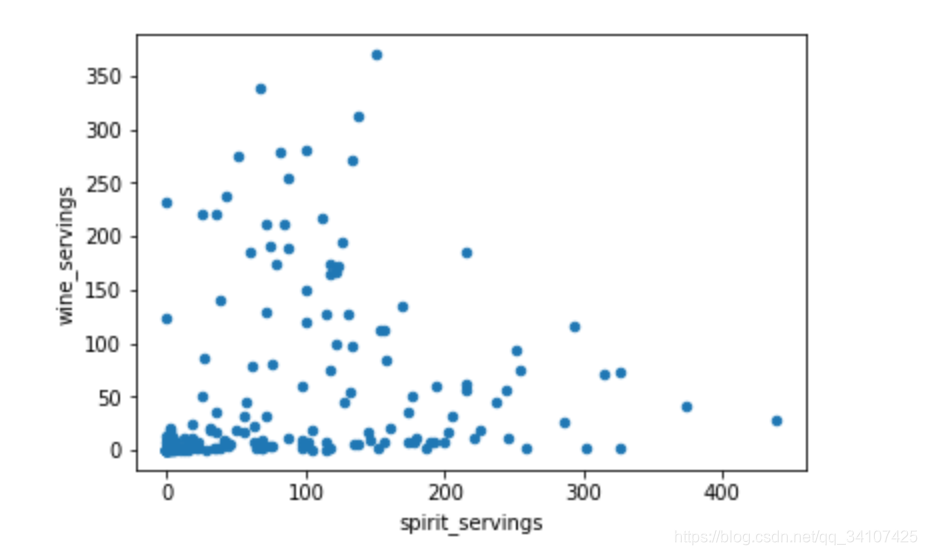
!pip install hvplot
pd.options.plotting.backend = "hvplot"
df.plot(kind = "scatter", x = "spirit_servings", y = "wine_servings", c = "continent")
trick 95:计算缺失值的数量
d = {\
"col1": [2019, 2019, 2020],
"col2": [350, 365, 1],
"col3": [np.nan, 365, None]
}
df = pd.DataFrame(d)
df
# Solution 1
df.isnull().sum()
# Solution 2
df.isna().sum()
# Solution 3
df.isna().any()
# Solution 4:
df.isna().any(axis = None)
df.isnull()和isna()的区别好像不大。
Trick 94:修正格式来节约内存
df = pd.read_csv("../input/titanic/train.csv", usecols = ["Pclass", "Sex", "Parch", "Cabin"])
df
# let's see how much our df occupies in memory
df.memory_usage(deep = True)
df.dtypes
# convert to smaller datatypes
df = df.astype({"Pclass":"int8",
                "Sex":"category",
                "Parch": "Sparse[int]", # most values are 0
                "Cabin":"Sparse[str]"}) # most values are NaN
df.memory_usage(deep = True)
df.dtypes

trick 93:通过频率把频率低的特征转化为other
d = {"genre": ["A", "A", "A", "A", "A", "B", "B", "C", "D", "E", "F"]}
df = pd.DataFrame(d)
df
# Step 1: count the frequencies
frequencies = df["genre"].value_counts(normalize = True)
frequencies
# Step 2: establish your threshold and filter the smaller categories
threshold = 0.1
small_categories = frequencies[frequencies < threshold].index
small_categories
# Step 3: replace the values
df["genre"] = df["genre"].replace(small_categories, "Other")
df["genre"].value_counts(normalize = True)
trick 92:正则表达式清理混合格式的特征列
d = {"customer": ["A", "B", "C", "D"], "sales":[1100, 950.75, "$400", "$1250.35"]}
df = pd.DataFrame(d)
df
# Step 1: check the data types
df["sales"].apply(type)
# Step 2: use regex
df["sales"] = df["sales"].replace("[$,]", "", regex = True).astype("float")
df
df["sales"].apply(type)
正则表达式中[abc]可以匹配一个字符串中的a,b,c.
正则表达式 查询表
trick 91:修改df的列顺序
d = {"A":[15, 20], "B":[20, 25], "C":[30 ,40], "D":[50, 60]}
df = pd.DataFrame(d)
df
# Using insert
df.insert(3, "C2", df["C"]*2)
df
# 第二种方法,先插入,然后改顺序
df["C3"] = df["C"]*3 # create a new columns, it will be at the end
columns = df.columns.to_list() # create a list with all columns
location = 4 # specify the location where you want your new column
columns = columns[:location] + ["C3"] + columns[location:-1] # reaarange the list
df = df[columns] # create te dataframe in with the order of columns you like
df
