Apache JMeter是一个纯Java开发的用于负载测试或者性能测试的开源软件。前面几片文章的介绍中都是通过使用JMeter的可视化页面进行的操作,这篇文章同样以对Web应用进行测试的压力测试为例,介绍非图形化方式进行压测的方法。
环境准备
关于Apache JMeter的概要介绍与安装的方法,可参看如下内容:
- https://liumiaocn.blog.csdn.net/article/details/101264380
JMeter非GUI模式
jmeter通过-n来指定非GUI模式,缺省状态下会启动JMeter的GUI界面,而启动时也伴随着如下提示信息:
liumiaocn:apache-jmeter-5.1.1 liumiao$ bin/jmeter -j /tmp/jmeter-master.log
================================================================================
Don't use GUI mode for load testing !, only for Test creation and Test debugging.
For load testing, use CLI Mode (was NON GUI):
   jmeter -n -t [jmx file] -l [results file] -e -o [Path to web report folder]
& increase Java Heap to meet your test requirements:
   Modify current env variable HEAP="-Xms1g -Xmx1g -XX:MaxMetaspaceSize=256m" in the jmeter batch file
Check : https://jmeter.apache.org/usermanual/best-practices.html
================================================================================
- 1
- 2
- 3
- 4
- 5
- 6
- 7
- 8
- 9
GUI模式 vs 非GUI模式
什么时候使用GUI模式,什么时候使用非GUI模式?
上述的提示已经非常清晰,不要使用GUI模式进行负载测试!只有在测试调试或者测试用例设定或者生成的时候才用GUI模式。
如何使用非GUI模式
使用命令与参数如下所示:
执行命令:jmeter -n -t [jmx文件] -l [结果文件] -e -o [测试报告目录]
使用示例
压力测试应用准备
在本地机器的8088端口使用Docker启动一个Nginx应用(使用其他方式也可),示例如下所示:
liumiaocn:~ liumiao$ docker images |grep nginx |grep latest
nginx                                           latest                          e445ab08b2be        2 months ago        126MB
liumiaocn:~ liumiao$ docker run -p 8088:80 -d --name=nginx-test nginx:latest
a80fb1a4fc20627891a6bd7394fd79ae9aefb7dc8cf72c12967bc2673a815308
liumiaocn:~ liumiao$
- 1
- 2
- 3
- 4
- 5
使用curl命令或者直接使用浏览器确认nginx已正常运行
liumiaocn:~ liumiao$ curl http://localhost:8088/
<!DOCTYPE html>
<html>
<head>
<title>Welcome to nginx!</title>
<style>
    body {
        width: 35em;
        margin: 0 auto;
        font-family: Tahoma, Verdana, Arial, sans-serif;
    }
</style>
</head>
<body>
<h1>Welcome to nginx!</h1>
<p>If you see this page, the nginx web server is successfully installed and
working. Further configuration is required.</p>

<p>For online documentation and support please refer to
<a href="http://nginx.org/">nginx.org</a>.<br/>
Commercial support is available at
<a href="http://nginx.com/">nginx.com</a>.</p>

<p><em>Thank you for using nginx.</em></p>
</body>
</html>
liumiaocn:~ liumiao$
- 1
- 2
- 3
- 4
- 5
- 6
- 7
- 8
- 9
- 10
- 11
- 12
- 13
- 14
- 15
- 16
- 17
- 18
- 19
- 20
- 21
- 22
- 23
- 24
- 25
- 26
- 27
准备jmx文件
在JMeter的非GUI方式的命令行中,jmx文件中保存了线程组和测试的设定信息,是压测的输入信息,而jmx文件的生成可以使用GUI界面生成,因为jmx就是xml文件的格式,一旦熟悉之后也可以直接编辑生成也可。
使用如下步骤准备测试验证的前提准备:
-
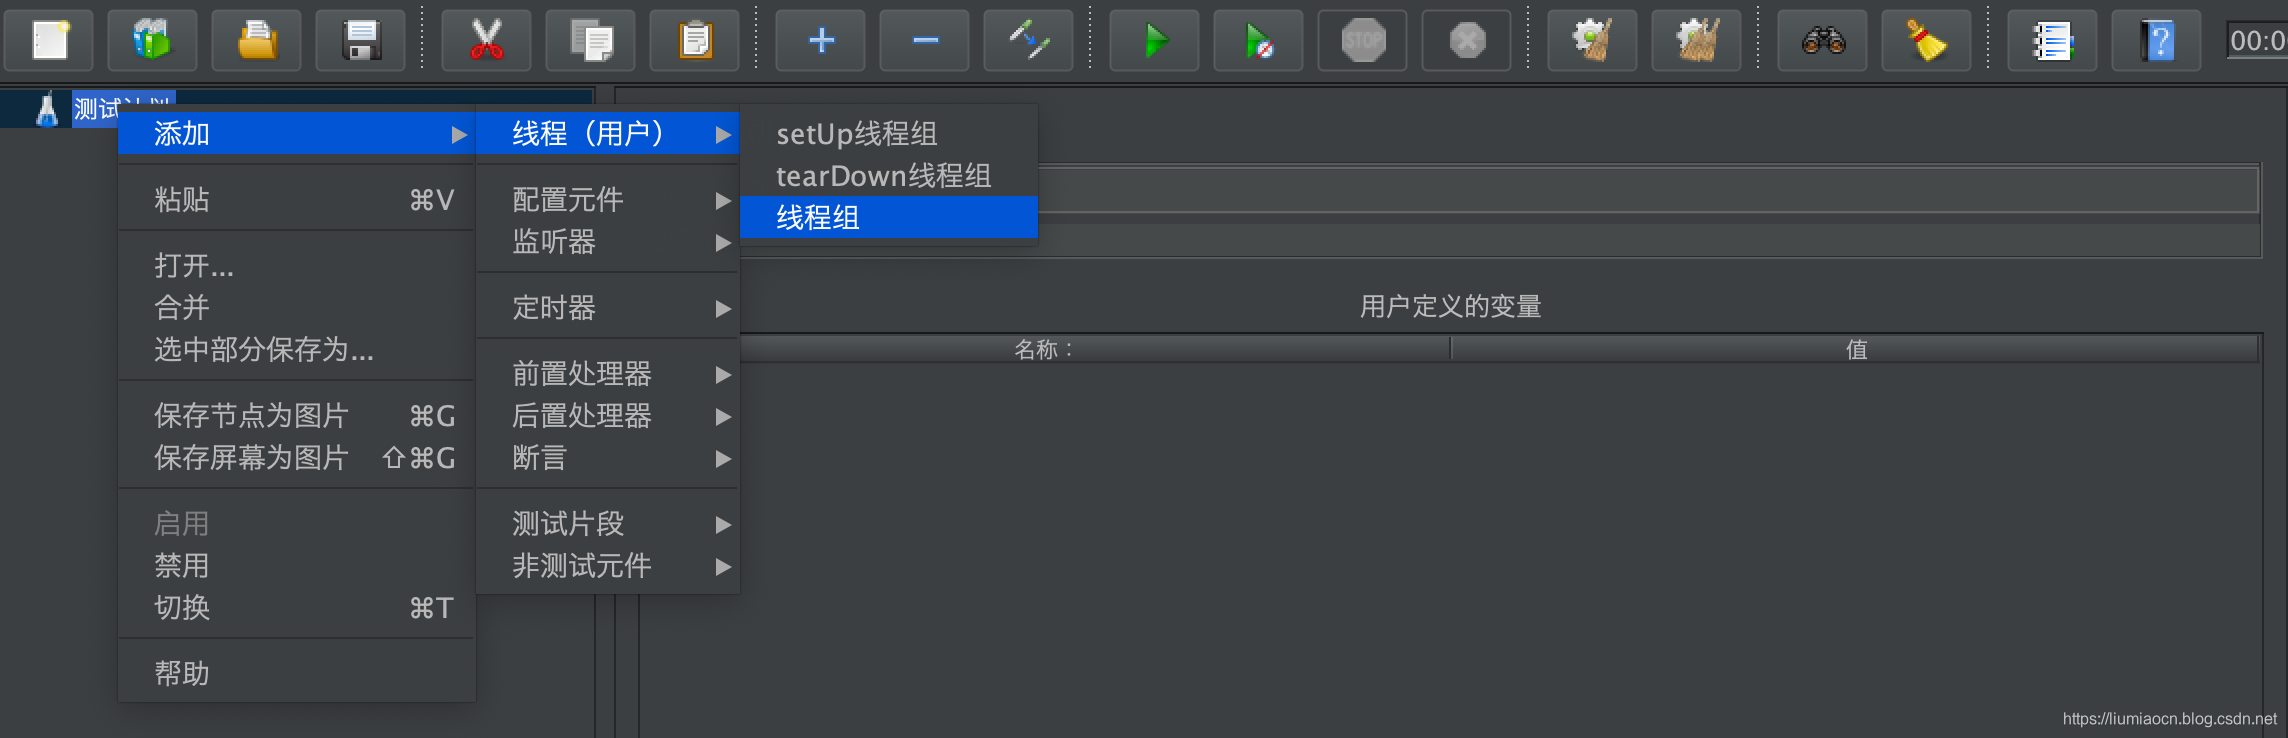
步骤1: 在测试计划下添加一个线程组,选择菜单信息如下图所示:
-
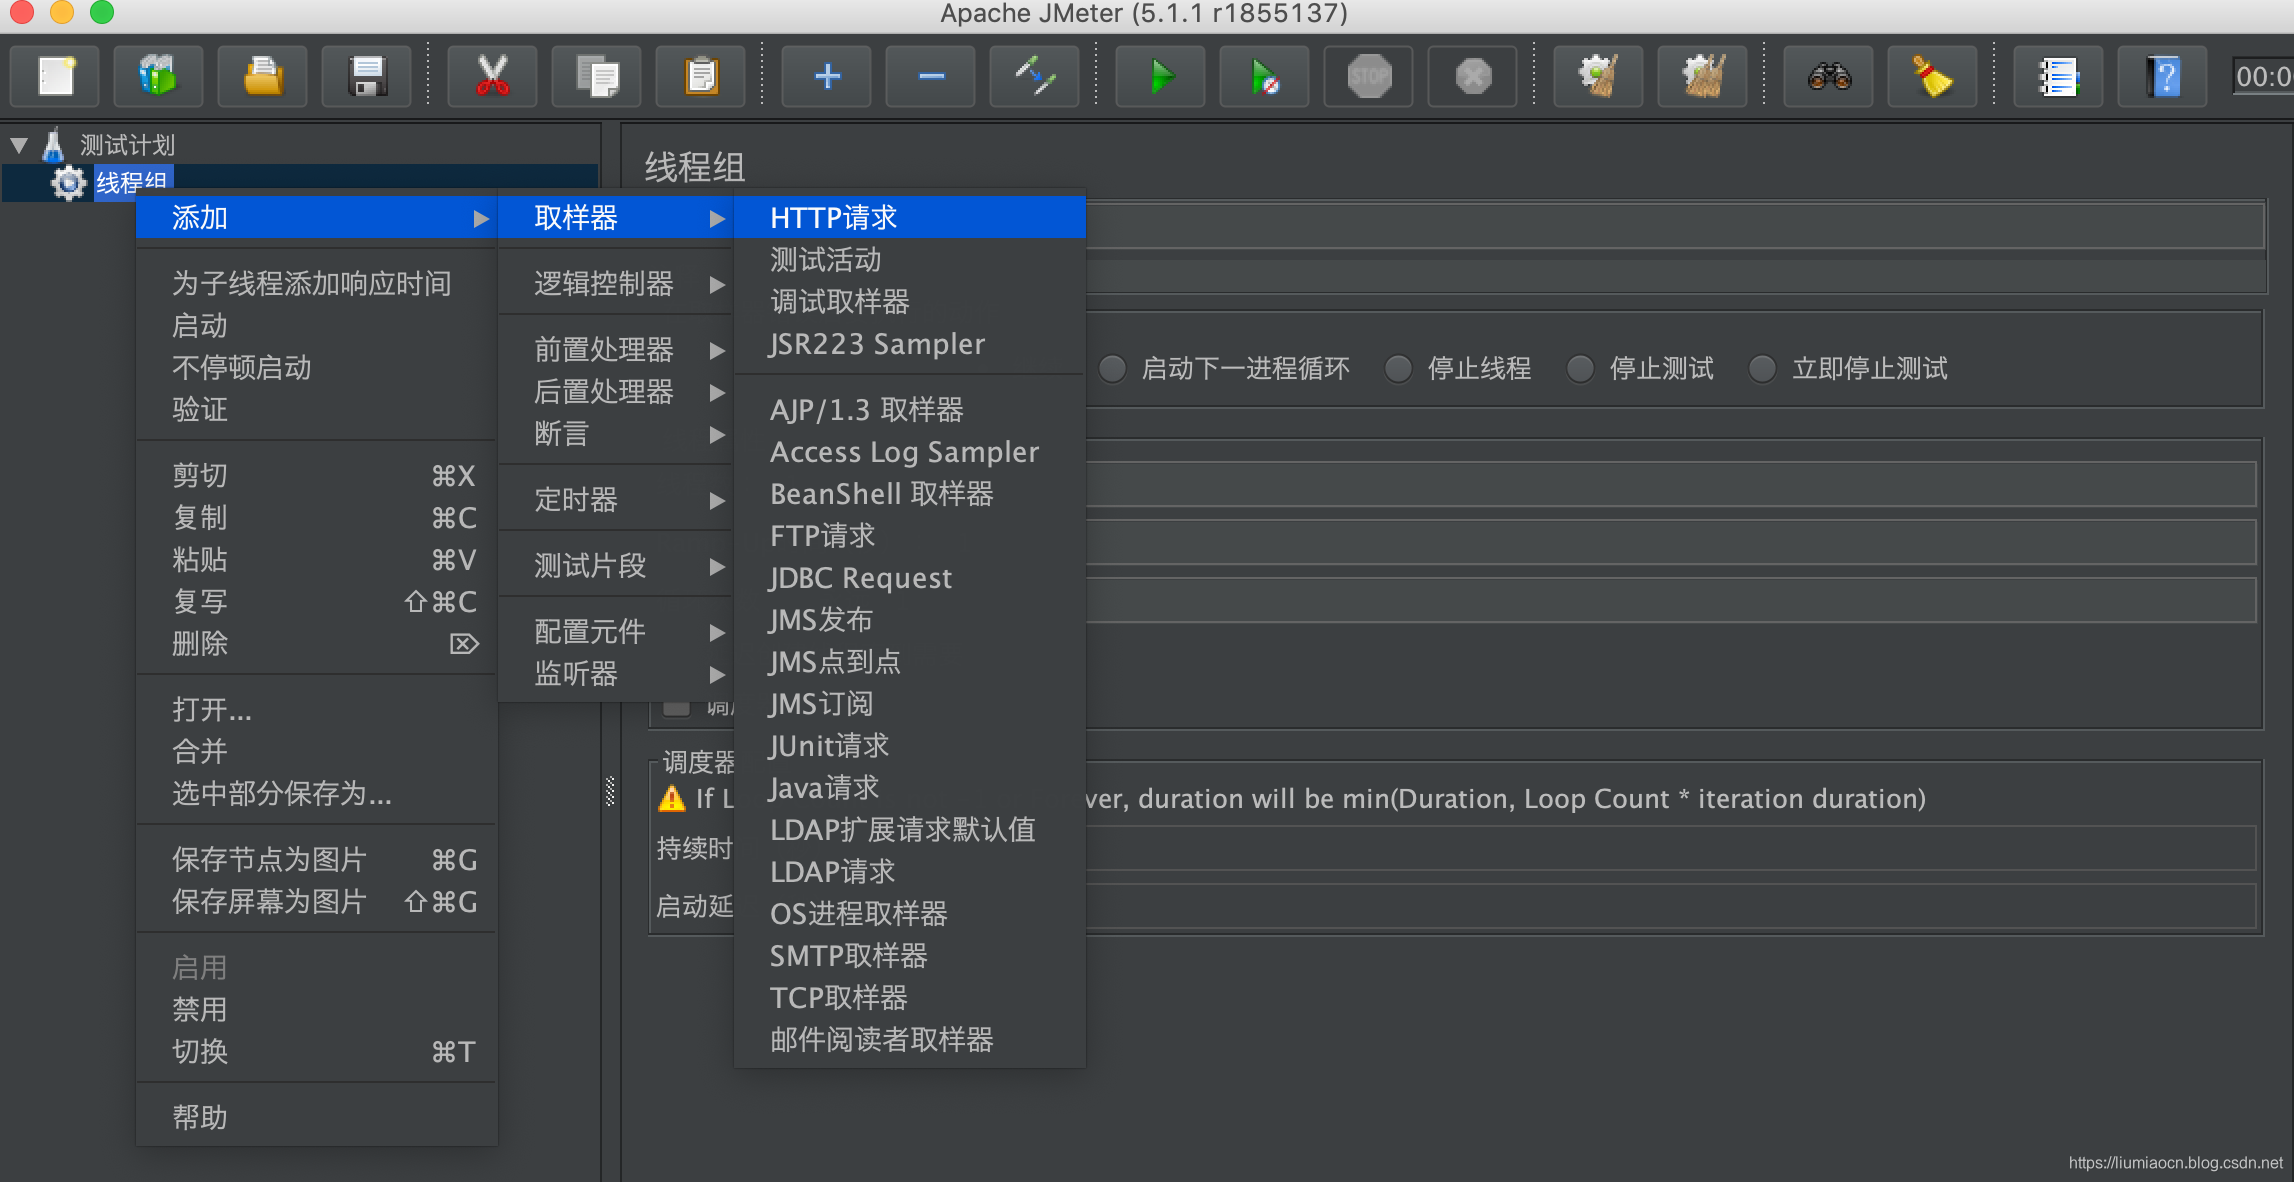
步骤2: 在刚刚创建的线程组上添加一个HTTP请求的取样器,选择菜单信息如下图所示:
-
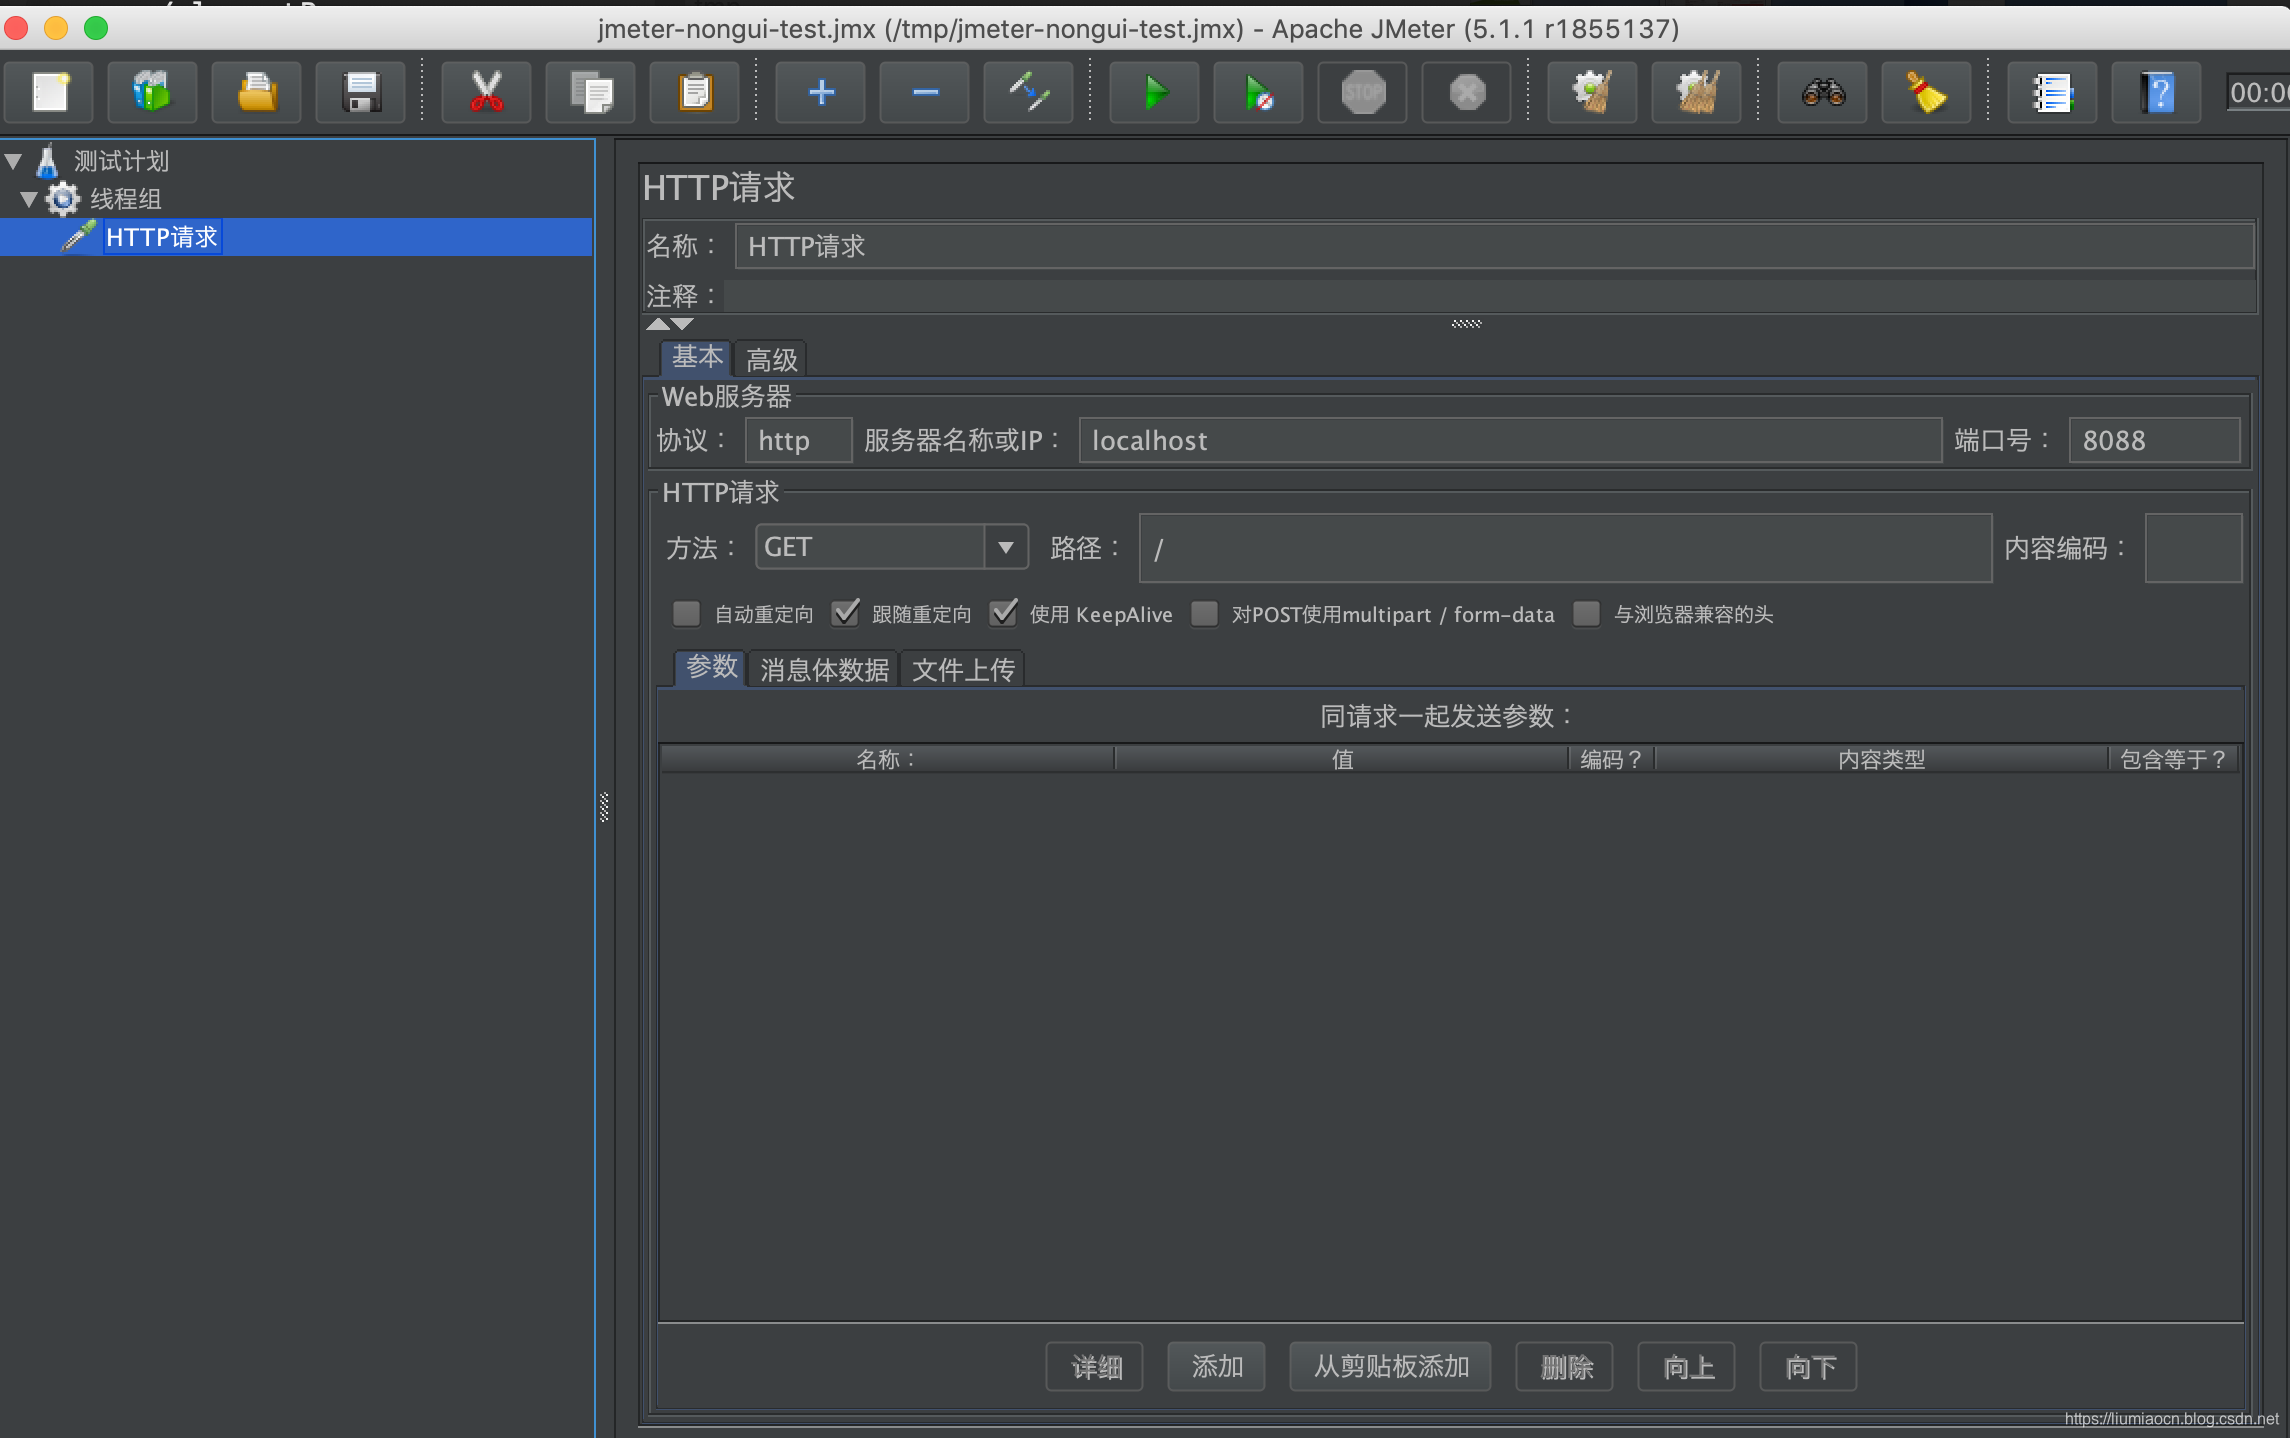
步骤3: 设定HTTP请求
-
步骤4: 设定线程组信息
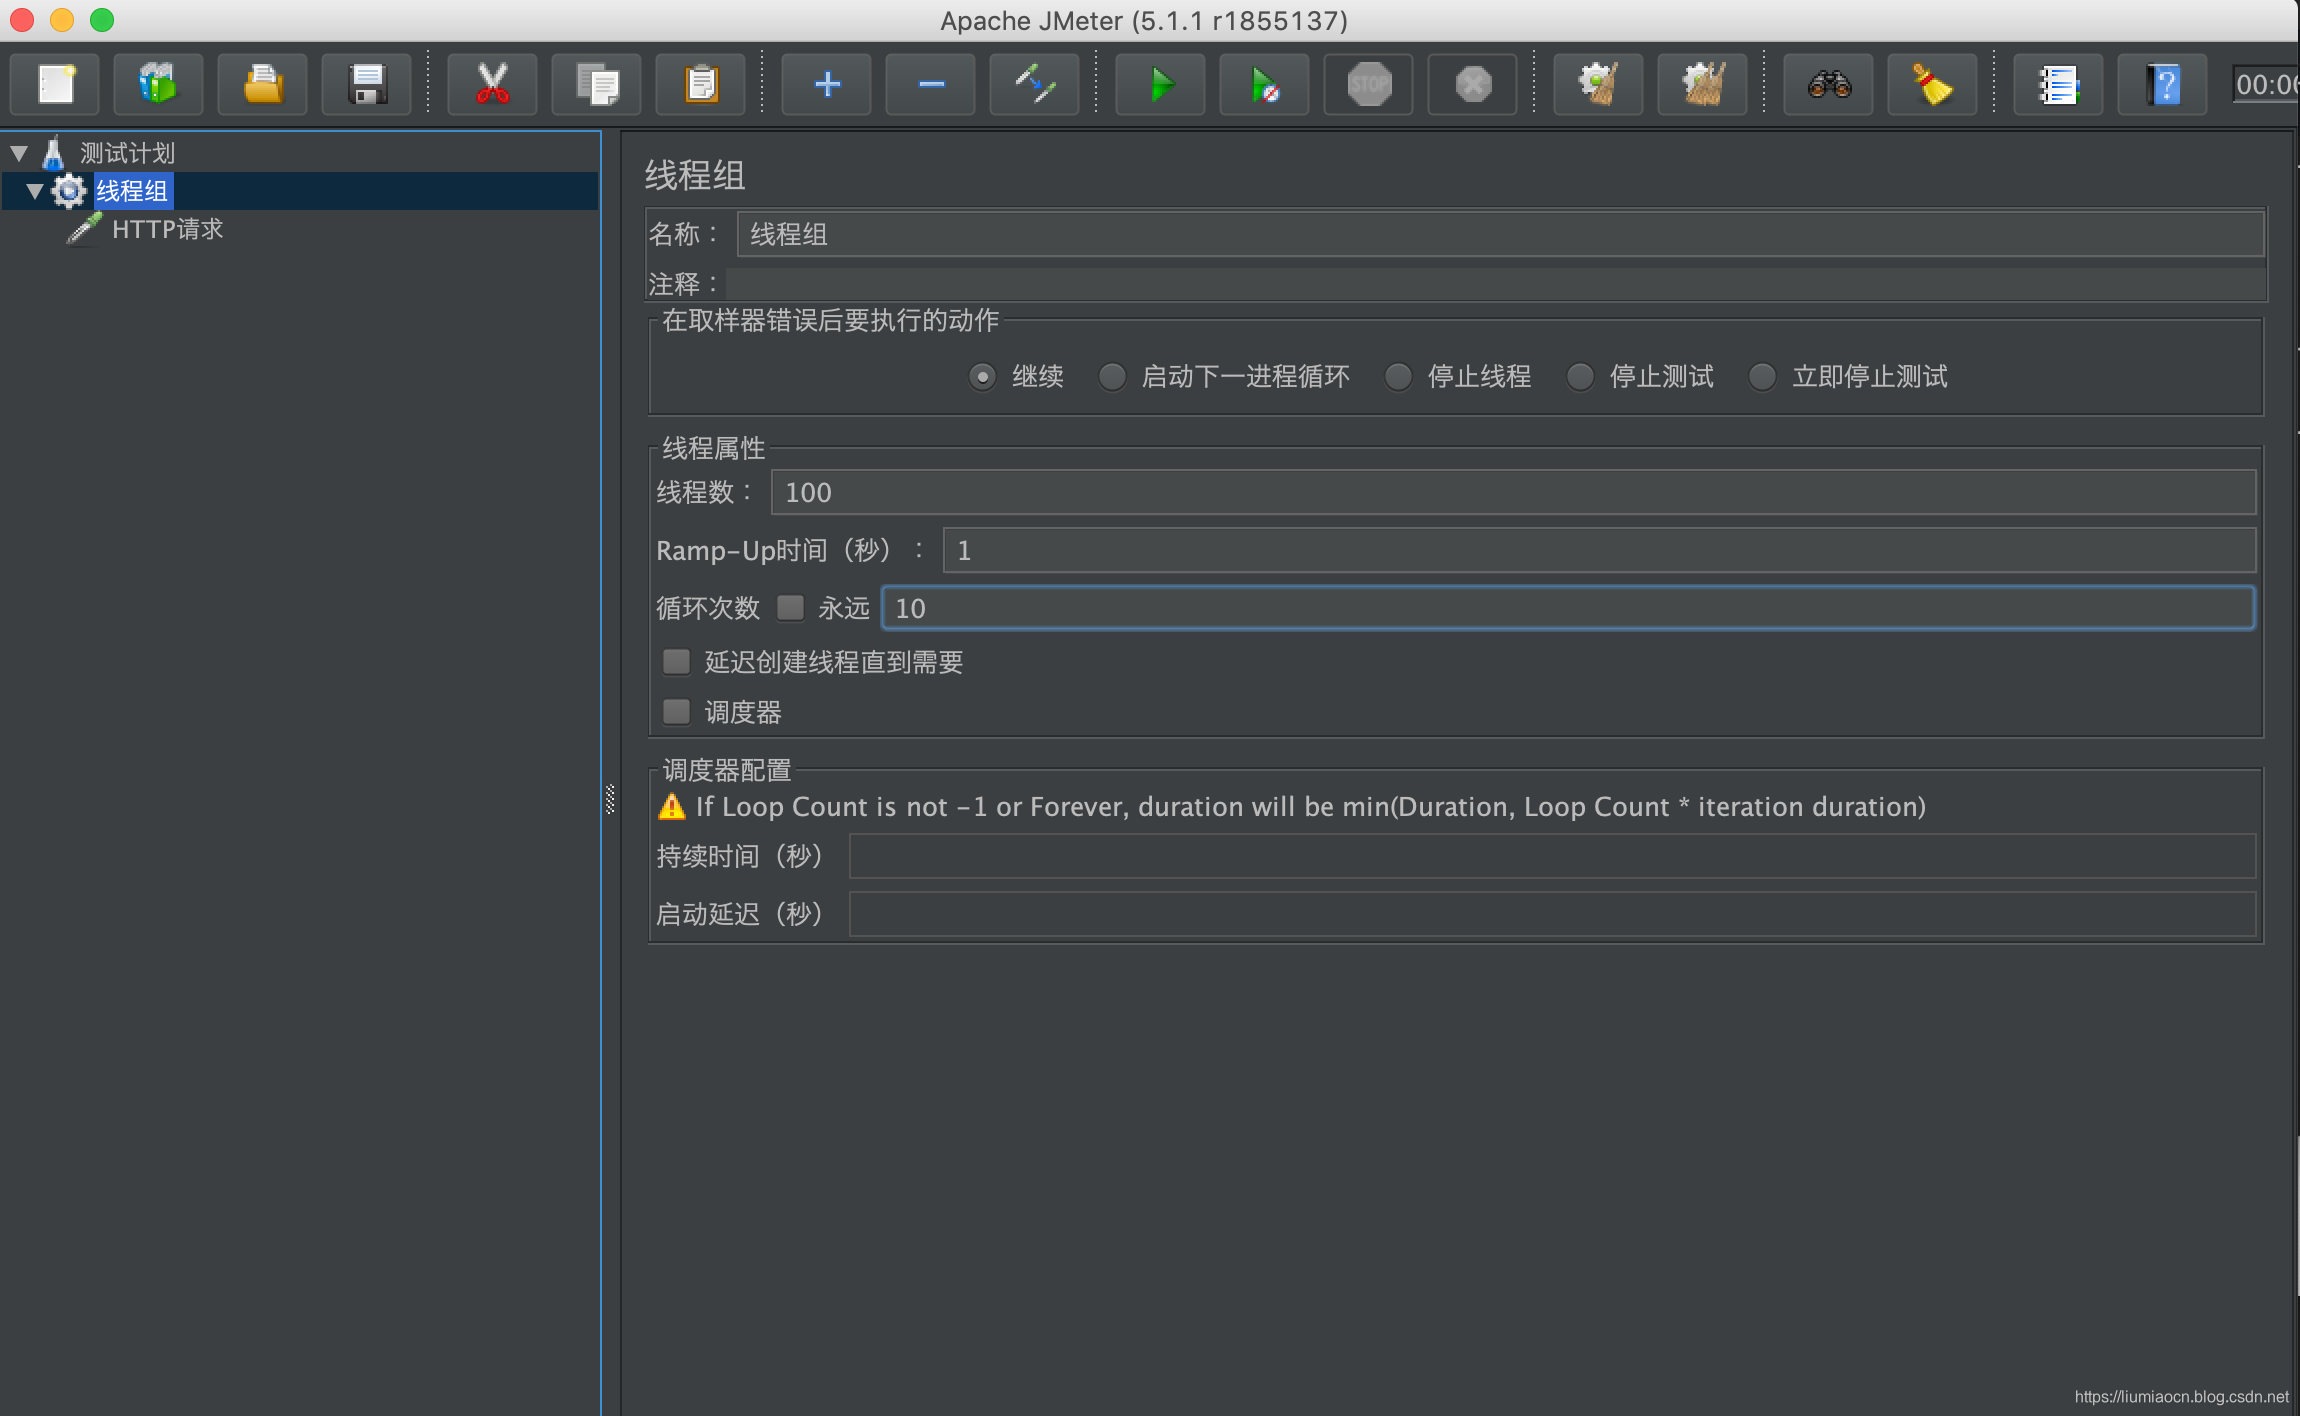
-
步骤5: 保存生成jmx文件
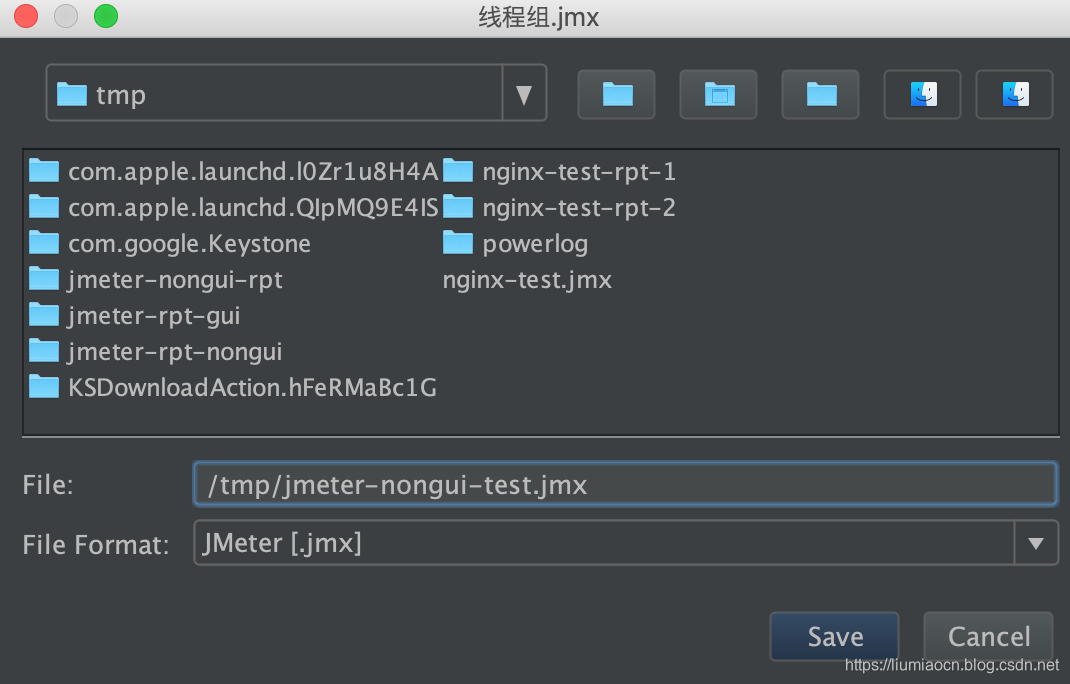
这样jmx文件就准备好了,如果当你觉得自己更熟悉这种生成的xml格式,也可以直接使用vi编辑生成如下格式的jmx文件自然也是可以的,可以看到设定的线程组的数量以及循环的次数和HTTP请求的设定,均在如下的XML格式的jmx文件中有保存。
liumiaocn:apache-jmeter-5.1.1 liumiao$ cat /tmp/jmeter-nongui-test.jmx
<?xml version="1.0" encoding="UTF-8"?>
<jmeterTestPlan version="1.2" properties="5.0" jmeter="5.1.1 r1855137">
  <hashTree>
    <TestPlan guiclass="TestPlanGui" testclass="TestPlan" testname="测试计划" enabled="true">
      <stringProp name="TestPlan.comments"></stringProp>
      <boolProp name="TestPlan.functional_mode">false</boolProp>
      <boolProp name="TestPlan.tearDown_on_shutdown">true</boolProp>
      <boolProp name="TestPlan.serialize_threadgroups">false</boolProp>
      <elementProp name="TestPlan.user_defined_variables" elementType="Arguments" guiclass="ArgumentsPanel" testclass="Arguments" testname="用户定义的变量" enabled="true">
        <collectionProp name="Arguments.arguments"/>
      </elementProp>
      <stringProp name="TestPlan.user_define_classpath"></stringProp>
    </TestPlan>
    <hashTree>
      <ThreadGroup guiclass="ThreadGroupGui" testclass="ThreadGroup" testname="线程组" enabled="true">
        <stringProp name="ThreadGroup.on_sample_error">continue</stringProp>
        <elementProp name="ThreadGroup.main_controller" elementType="LoopController" guiclass="LoopControlPanel" testclass="LoopController" testname="循环控制器" enabled="true">
          <boolProp name="LoopController.continue_forever">false</boolProp>
          <stringProp name="LoopController.loops">10</stringProp>
        </elementProp>
        <stringProp name="ThreadGroup.num_threads">100</stringProp>
        <stringProp name="ThreadGroup.ramp_time">1</stringProp>
        <boolProp name="ThreadGroup.scheduler">false</boolProp>
        <stringProp name="ThreadGroup.duration"></stringProp>
        <stringProp name="ThreadGroup.delay"></stringProp>
      </ThreadGroup>
      <hashTree>
        <HTTPSamplerProxy guiclass="HttpTestSampleGui" testclass="HTTPSamplerProxy" testname="HTTP请求" enabled="true">
          <elementProp name="HTTPsampler.Arguments" elementType="Arguments" guiclass="HTTPArgumentsPanel" testclass="Arguments" testname="用户定义的变量" enabled="true">
            <collectionProp name="Arguments.arguments"/>
          </elementProp>
          <stringProp name="HTTPSampler.domain">localhost</stringProp>
          <stringProp name="HTTPSampler.port">8088</stringProp>
          <stringProp name="HTTPSampler.protocol">http</stringProp>
          <stringProp name="HTTPSampler.contentEncoding"></stringProp>
          <stringProp name="HTTPSampler.path">/</stringProp>
          <stringProp name="HTTPSampler.method">GET</stringProp>
          <boolProp name="HTTPSampler.follow_redirects">true</boolProp>
          <boolProp name="HTTPSampler.auto_redirects">false</boolProp>
          <boolProp name="HTTPSampler.use_keepalive">true</boolProp>
          <boolProp name="HTTPSampler.DO_MULTIPART_POST">false</boolProp>
          <stringProp name="HTTPSampler.embedded_url_re"></stringProp>
          <stringProp name="HTTPSampler.connect_timeout"></stringProp>
          <stringProp name="HTTPSampler.response_timeout"></stringProp>
        </HTTPSamplerProxy>
        <hashTree/>
      </hashTree>
    </hashTree>
  </hashTree>
</jmeterTestPlan>
liumiaocn:apache-jmeter-5.1.1 liumiao$
- 1
- 2
- 3
- 4
- 5
- 6
- 7
- 8
- 9
- 10
- 11
- 12
- 13
- 14
- 15
- 16
- 17
- 18
- 19
- 20
- 21
- 22
- 23
- 24
- 25
- 26
- 27
- 28
- 29
- 30
- 31
- 32
- 33
- 34
- 35
- 36
- 37
- 38
- 39
- 40
- 41
- 42
- 43
- 44
- 45
- 46
- 47
- 48
- 49
- 50
- 51
- 52
执行压测并生成报告
执行命令:jmeter -n -t [jmx文件] -l [结果文件] -e -o [测试报告目录]
以上述的jmx文件为输入,通过-t进行指定,使用上述jmeter -n命令执行并生成报告:
liumiaocn:apache-jmeter-5.1.1 liumiao$ bin/jmeter -n -t /tmp/jmeter-nongui-test.jmx -l /tmp/result.jtl -e -o /tmp/jmeter-nongui-rpt
Creating summariser <summary>
Created the tree successfully using /tmp/jmeter-nongui-test.jmx
Starting the test @ Wed Oct 02 11:31:41 CST 2019 (1569987101117)
Waiting for possible Shutdown/StopTestNow/HeapDump/ThreadDump message on port 4445
summary =   1000 in 00:00:01 =  950.6/s Avg:    13 Min:     1 Max:    67 Err:     0 (0.00%)
Tidying up ...    @ Wed Oct 02 11:31:42 CST 2019 (1569987102451)
... end of run
liumiaocn:apache-jmeter-5.1.1 liumiao$
- 1
- 2
- 3
- 4
- 5
- 6
- 7
- 8
- 9
结果确认
其实,从jtl这个简单的csv文件中,基本可以看到可视化的图表的所有内容,如下获取最初3行和最后2两行的数据来看,可以看到执行的相关信息
liumiaocn:apache-jmeter-5.1.1 liumiao$ tail -n2 /tmp/result.jtl
1569987102446,2,HTTP请求,200,OK,线程组 1-100,text,true,,850,118,1,1,http://localhost:8088/,2,0,0
1569987102448,1,HTTP请求,200,OK,线程组 1-100,text,true,,850,118,1,1,http://localhost:8088/,1,0,0
liumiaocn:apache-jmeter-5.1.1 liumiao$
liumiaocn:apache-jmeter-5.1.1 liumiao$ head -n3 /tmp/result.jtl
timeStamp,elapsed,label,responseCode,responseMessage,threadName,dataType,success,failureMessage,bytes,sentBytes,grpThreads,allThreads,URL,Latency,IdleTime,Connect
1569987101523,67,HTTP请求,200,OK,线程组 1-1,text,true,,850,118,17,17,http://localhost:8088/,67,0,48
1569987101523,67,HTTP请求,200,OK,线程组 1-4,text,true,,850,118,17,17,http://localhost:8088/,67,0,49
liumiaocn:apache-jmeter-5.1.1 liumiao$
- 1
- 2
- 3
- 4
- 5
- 6
- 7
- 8
- 9
另外从总的行数上来看会更加清晰,为1001(1000次测试结果+1行的表头),另外结果中包含’,true,'表明执行结果为OK的除去之后仅剩表头,说明1000行的结果都是正常执行完毕,压测中没有出现异常结果。
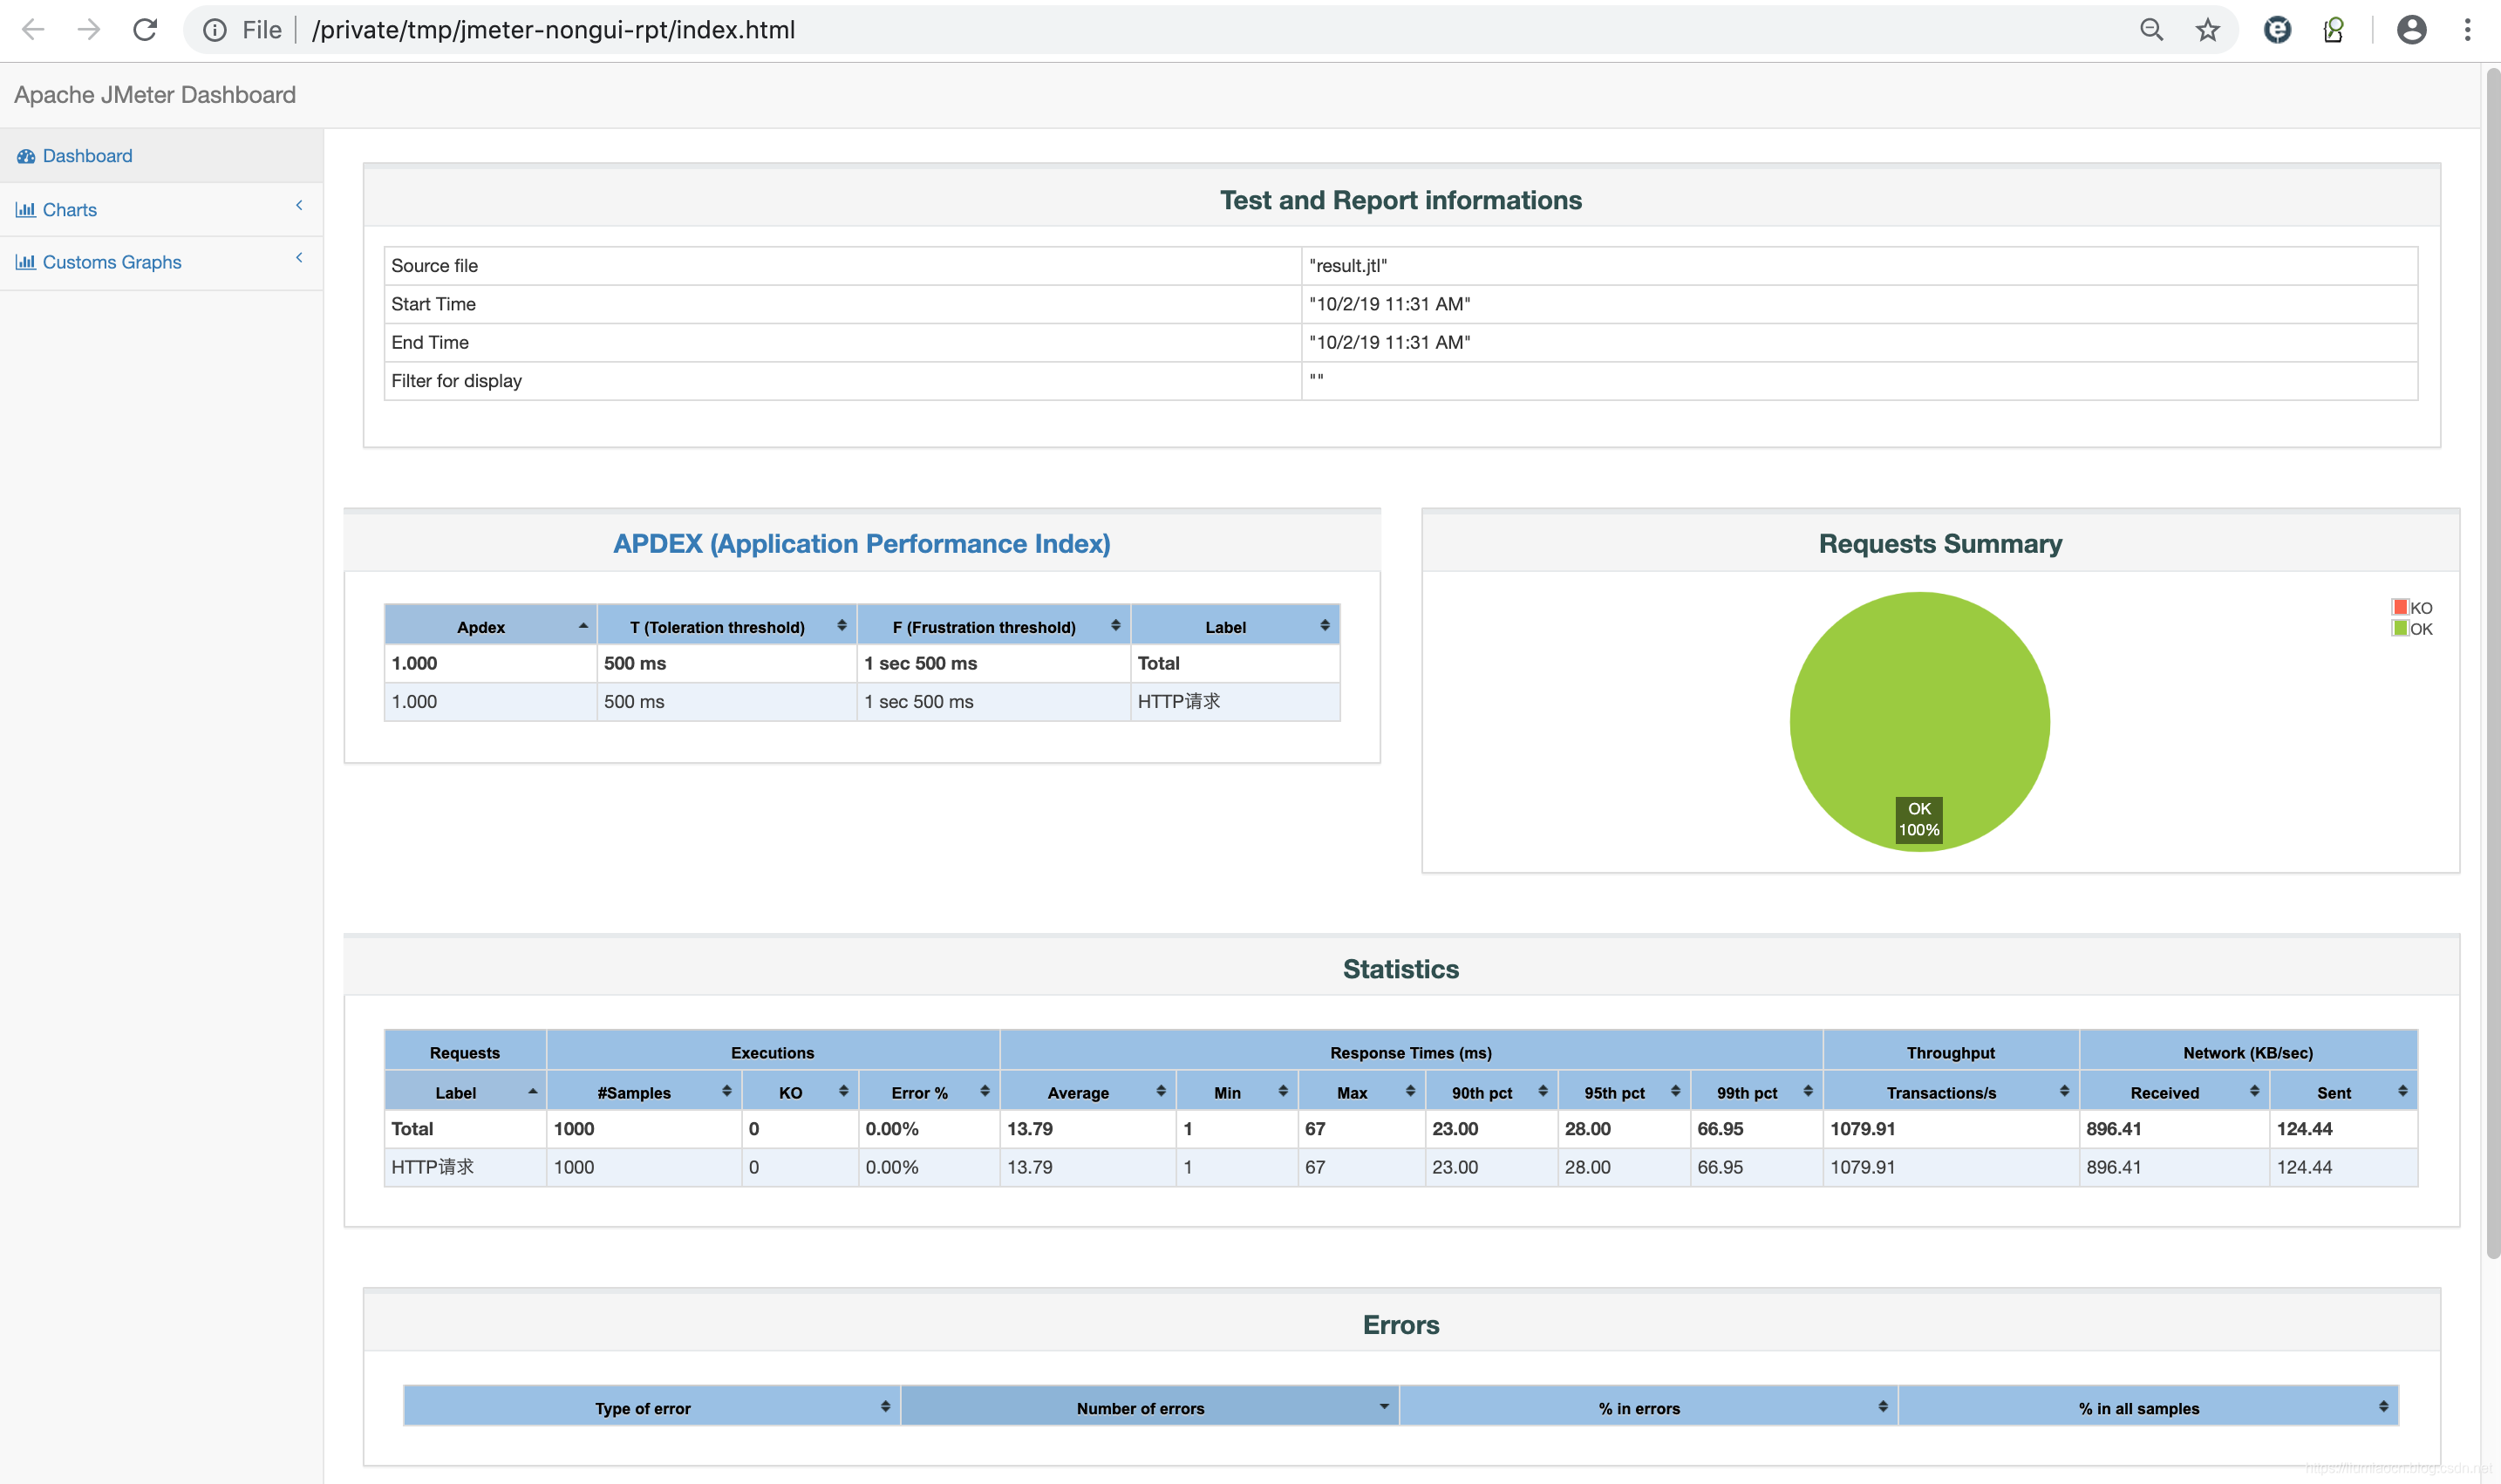
当然从生成的报表中,可以更为直观地看到压测结果的概要信息