Hystrix Dashboard 是监控 Hystrix 的熔断器状况 的一个组件,提供了数据监控和友好的图像化展示页面。
本文章 在 [上一个文章] 的基础上,讲述如何在 RestTemplate+Ribbon 中使用 Hystrix Dashboard 监控熔断器的状态。
一:在 RestTemplate 中使用 Hystrix Dashboard
1.1 在eureka-ribbon-hystrix-client项目的 pom.xml 中加上 Actuator、Hystrix Dashboard、Hystrix 的依赖 。pom.xml 代码如下:
<?xml version="1.0" encoding="UTF-8"?>
<project xmlns="http://maven.apache.org/POM/4.0.0" xmlns:xsi="http://www.w3.org/2001/XMLSchema-instance"
         xsi:schemaLocation="http://maven.apache.org/POM/4.0.0 https://maven.apache.org/xsd/maven-4.0.0.xsd">
    <modelVersion>4.0.0</modelVersion>
    <parent>
        <groupId>com.springcloud</groupId>
        <artifactId>springcloud-hx</artifactId>
        <version>1.0-SNAPSHOT</version>
        <relativePath/> <!-- lookup parent from repository -->
    </parent>
    <groupId>com.example</groupId>
    <artifactId>eureka-ribbon-hystrix-client</artifactId>
    <version>0.0.1-SNAPSHOT</version>
    <name>eureka-ribbon-hystrix-client</name>
    <description>Demo project for Spring Boot</description>

    <properties>
        <java.version>1.8</java.version>
    </properties>

    <dependencies>
        <dependency>
            <groupId>org.springframework.boot</groupId>
            <artifactId>spring-boot-starter-actuator</artifactId>
        </dependency>
        <dependency>
            <groupId>org.springframework.cloud</groupId>
            <artifactId>spring-cloud-starter-netflix-hystrix-dashboard</artifactId>
        </dependency>
        <dependency>
            <groupId>org.springframework.cloud</groupId>
            <artifactId>spring-cloud-starter-netflix-hystrix</artifactId>
        </dependency>
        <dependency>
            <groupId>org.springframework.cloud</groupId>
            <artifactId>spring-cloud-starter-netflix-eureka-client</artifactId>
        </dependency>
        <dependency>
            <groupId>org.springframework.cloud</groupId>
            <artifactId>spring-cloud-starter-netflix-ribbon</artifactId>
        </dependency>
        <dependency>
            <groupId>org.springframework.boot</groupId>
            <artifactId>spring-boot-starter-web</artifactId>
        </dependency>
        <dependency>
            <groupId>org.springframework.boot</groupId>
            <artifactId>spring-boot-starter-test</artifactId>
            <scope>test</scope>
        </dependency>
    </dependencies>

    <build>
        <plugins>
            <plugin>
                <groupId>org.springframework.boot</groupId>
                <artifactId>spring-boot-maven-plugin</artifactId>
            </plugin>
        </plugins>
    </build>

</project>
1.2 在启动类上加上 @EnableDiscoveryClient 开启服务注册于发现,加上@EnableHystrix开启Hystrix 的熔断器功能,加上@EnableHystrixDashboard 开启 Hystrix Dashboard 的功能,代码如下:
package com.example.eurekaribbonhystrixclient;

import com.netflix.hystrix.contrib.metrics.eventstream.HystrixMetricsStreamServlet;
import org.springframework.boot.SpringApplication;
import org.springframework.boot.autoconfigure.SpringBootApplication;
import org.springframework.boot.web.servlet.ServletRegistrationBean;
import org.springframework.cloud.client.circuitbreaker.EnableCircuitBreaker;
import org.springframework.cloud.client.discovery.EnableDiscoveryClient;
import org.springframework.cloud.netflix.hystrix.EnableHystrix;
import org.springframework.cloud.netflix.hystrix.dashboard.EnableHystrixDashboard;
import org.springframework.context.annotation.Bean;

@SpringBootApplication
//开启服务注册于发现
@EnableDiscoveryClient
//开启Hystrix 的熔断器功能
@EnableHystrix
//开启 Hystrix Dashboard 的功能
@EnableHystrixDashboard
public class EurekaRibbonHystrixClientApplication {

    public static void main(String[] args) {
        SpringApplication.run(EurekaRibbonHystrixClientApplication.class, args);
    }


    //解决http://localhost:8765/hystrix.stream  访问不了的问题
    @Bean
    public ServletRegistrationBean hystrixMetricsStreamServlet() {
        HystrixMetricsStreamServlet streamServlet = new HystrixMetricsStreamServlet();
        ServletRegistrationBean registrationBean = new ServletRegistrationBean(new HystrixMetricsStreamServlet());
        registrationBean.setLoadOnStartup(1);
        registrationBean.addUrlMappings("/hystrix.stream");
        registrationBean.setName("HystrixMetricsStreamServlet");
        return registrationBean;
    }
}
1.3 分别启动 eureka-server , eureka-client, eureka-client ,eureka-ribbon-hystrix-client 服务。
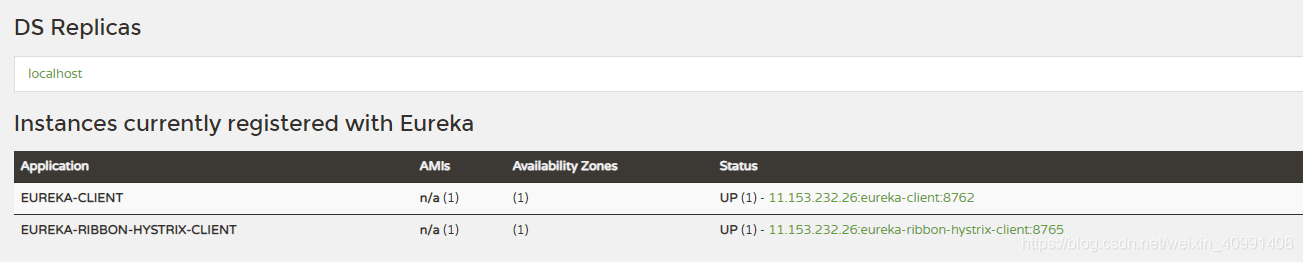
浏览器访问 http://localhost:8761/
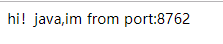
浏览器上访问 :http://localhost:8765/RibbonController/hi/java ,
然后 再访问 http://localhost:8765/hystrix.stream,浏览器上会显示熔断器的数据指标,如图所示:

在浏览器上访问 http://localhost:8765/hystrix ,浏览器显示的界面如下:

在界面上依次填写 http://localhost:8765/hystrix.stream ,2000 ,test(这个随意填写),点击 “monitor” ,进入页面,如图所示:


现在,我们把eureka-client 服务关闭,看下结果: