最近在极客时间学习《Linux性能优化实战》,结合自己的web服务器和微信小程序服务器来实战,根据每章节输出成文档。
01 | 如何学习Linux性能优化?
性能指标是“高并发”和“响应快”。性能优化就是找出系统的瓶颈。
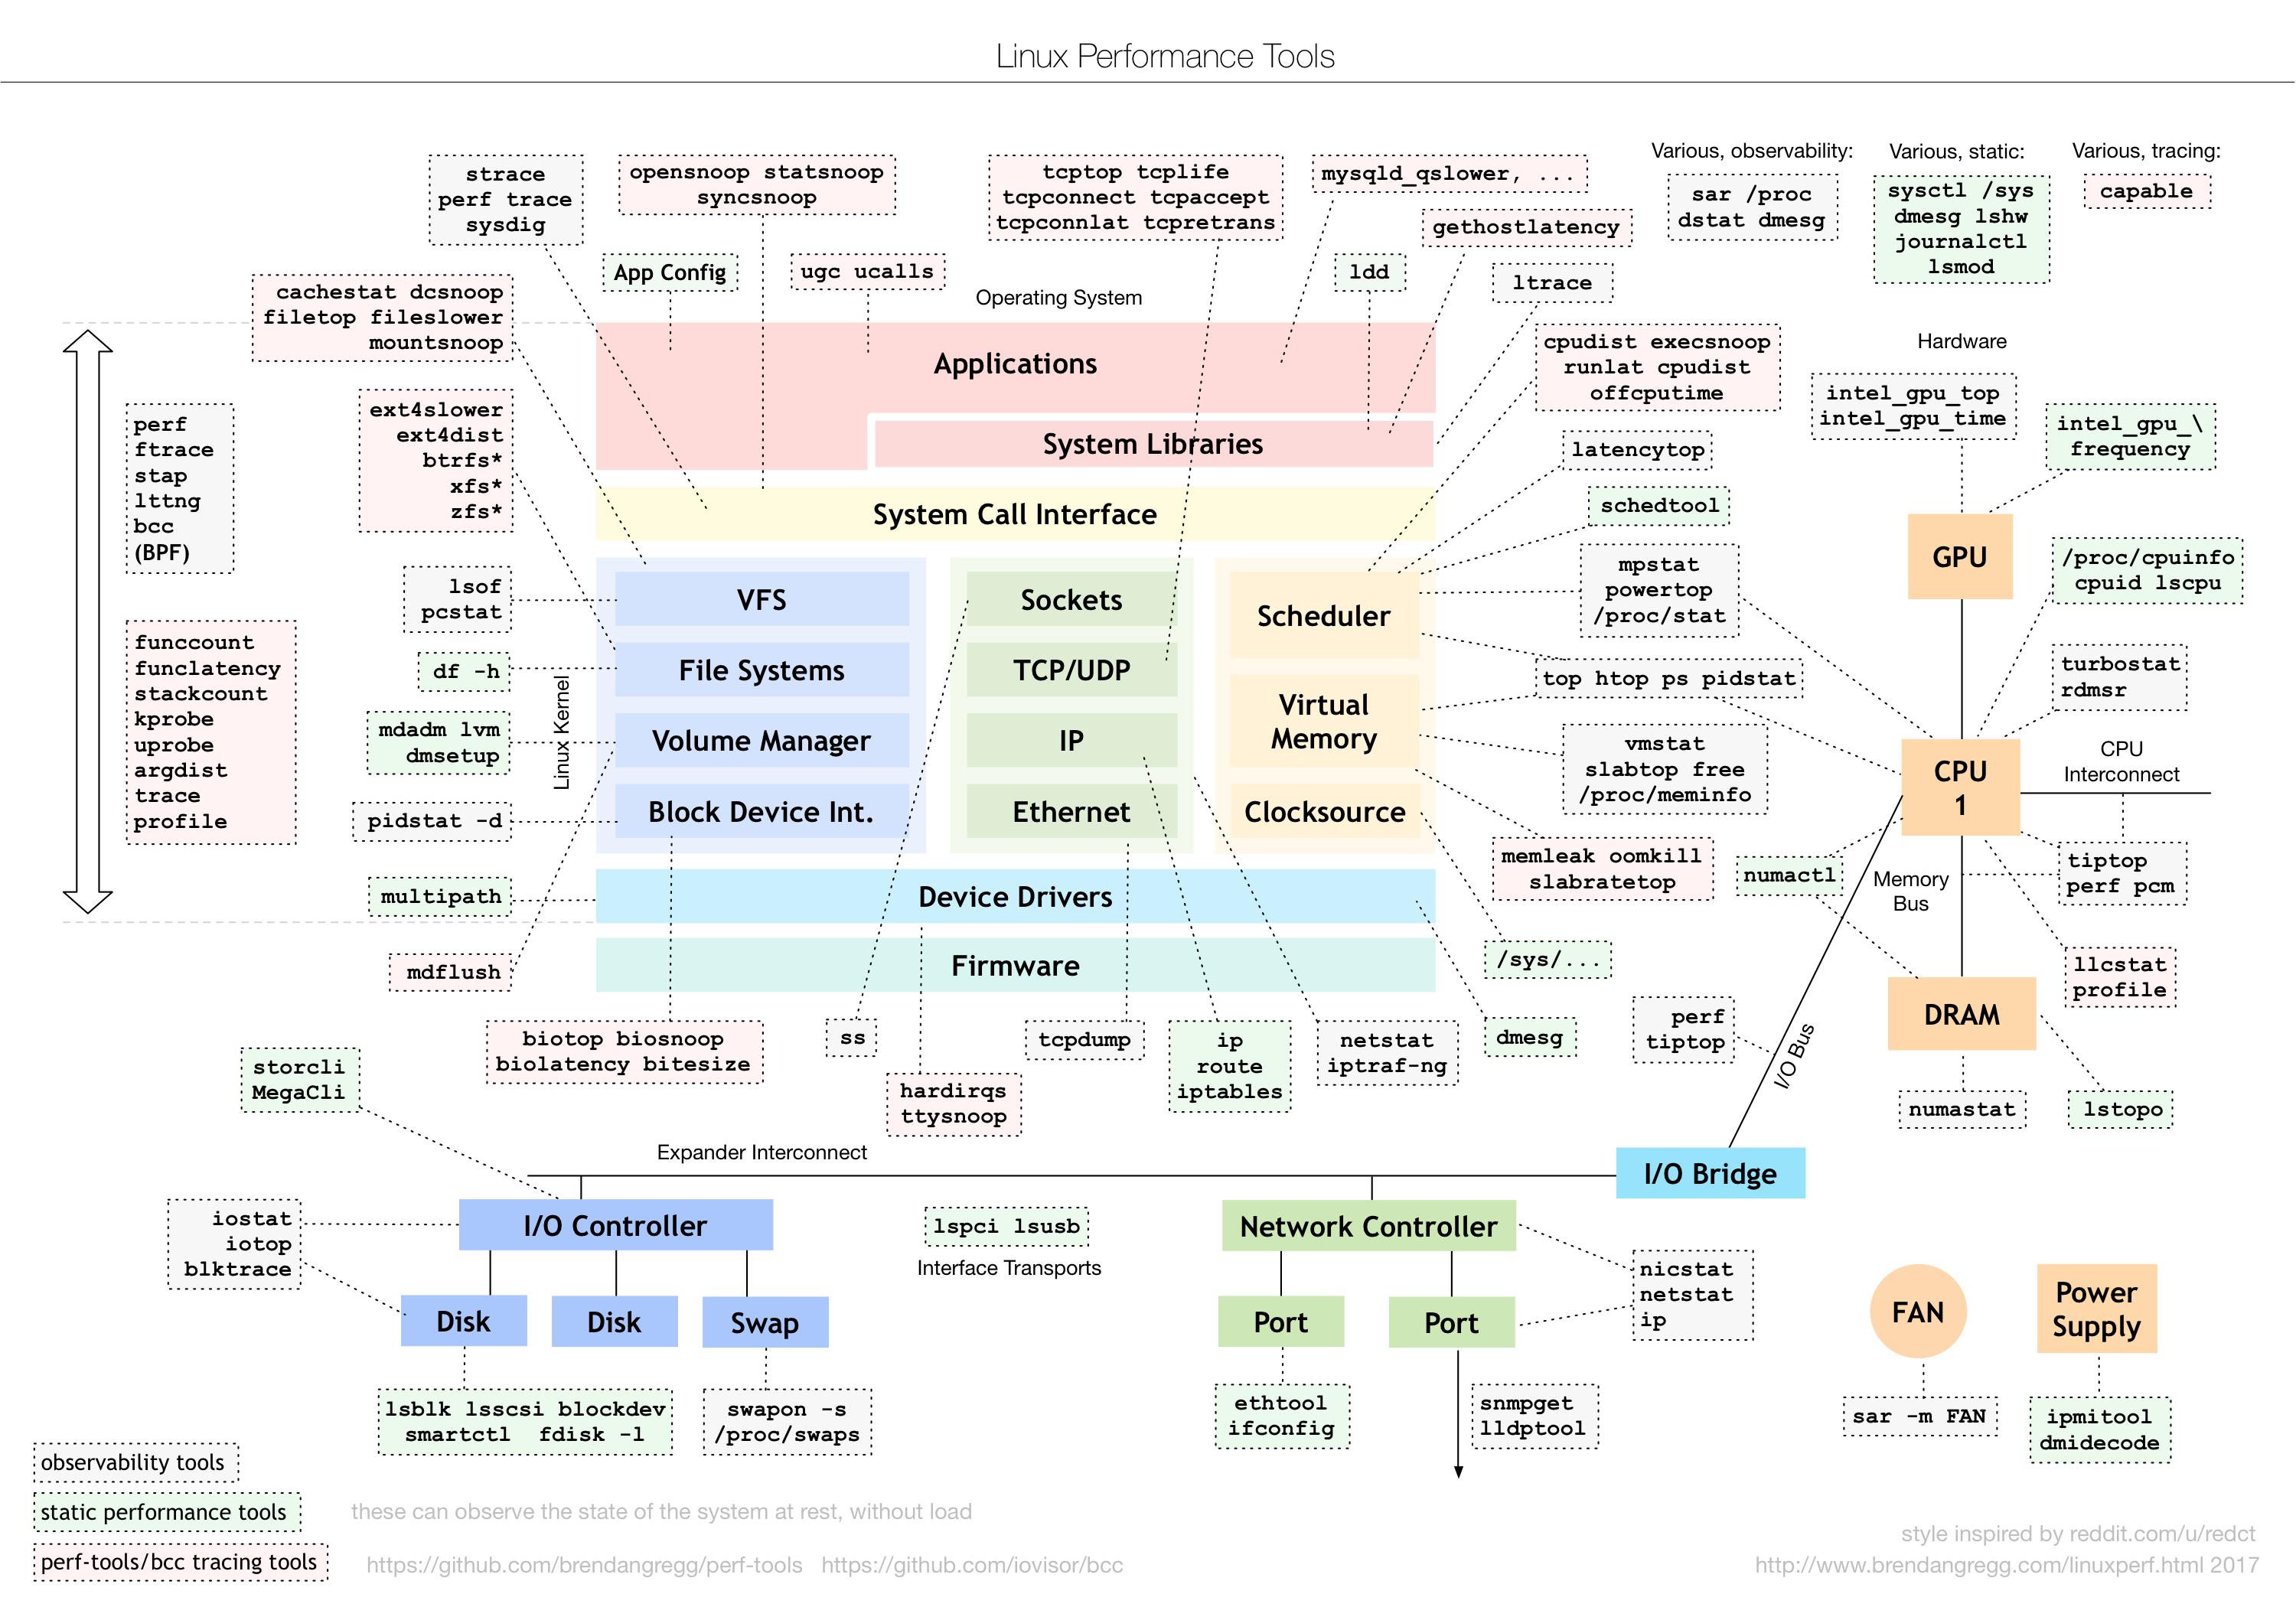
要建立整体系统性能的全局观。(图片源自http://www.brendangregg.com/Perf/linux_perf_tools_full.png)
02 | 基础篇:到底应该怎么理解“平均负载”?
![]()
uptime命令的结果意义分别是:
当前时间、系统运行时间、正在登陆用户数、过去1分钟、5分钟、15分钟的平均负载。
然后就man uptime看说明书……(赞美Linux man手册)
System load averages is the average number of processes that are either in a runnable or
uninterruptable state. A process in a runnable state is either using the CPU or waiting
to use the CPU. A process in uninterruptable state is waiting for some I/O access, eg
waiting for disk. The averages are taken over the three time intervals. Load averages
are not normalized for the number of CPUs in a system, so a load average of 1 means a
single CPU system is loaded all the time while on a 4 CPU system it means it was idle
75% of the time.理解:单个CPU平均干活率*CPU数目=平均负载率,4核CPU*0.25=负载率1,4核CPU*1=负载率4,单核CPU*0.01=负载率0.01
然后作者居然把这段话用大白话翻译讲解了一遍?果然还是得学根源。用好man手册就完事儿了。
然后查看CPU信息:
![]()
嗯我只有一个CPU。然后就知道了平均负载率就是我这个CPU干活率。三个数值递增,说明越靠近现在负载率越低。负载率到达70%就要注意了。最重要的还是看这三个数值的关系:有没有突增、翻倍这些异常现象。
注意平均负载率不仅包括了正在使用 CPU 的进程,还包括等待 CPU 和等待IO的进程。不等于CPU利用率。
然后就是三个实验。
实验一:CPU密集型进程
终端一执行sqrt()函数模拟CPU的集中使用:stress --cpu 1 --timeout 600
终端二查看:watch -d uptime(watch -d表示重复执行一条命令,并高亮变化的区域)

说明是突发CPU负载,终端三查看:mpstat -P ALL 5 (-P ALL 表示监控所有 CPU,后面数字 5 表示间隔 5s输出数据)

说明是用户进程导致的,再查看哪个进程pidstat -u 5 1 间隔5s输出一行

说明是stress进程在大量使用CPU,找到原因了(阿里云盾都出来了。。。)关掉stress恢复正常。
实验二:IO密集型进程
终端一执行stress -i 即不断执行sync()函数来模拟IO的大量使用
还是在终端二 watch -d uptime来观察平均负载率
