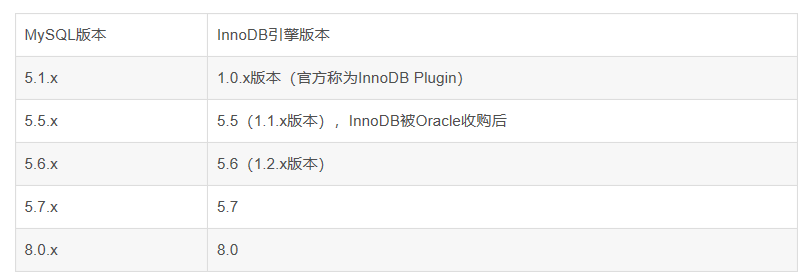
InnoDB是MySQL使用最多的存储引擎,通常InnoDB状态可以通过show engine innodb status\G查看。
由于MySQL不同版本采用InnoDB引擎版本不同,5.6后对show engine innodb status信息进行了优化,本文环境为5.7。
show engine innodb status统计信息
需要注意一点:show engine innodb status显示的不是当前状态,而是过去某个时间范围内InnoDB存储引擎的状态。
向右拉
Per second averages calculated from the last 59 seconds
在显示前端可看到以上信息,代表查询的信息为过去59秒内每2秒的平均值。
show engine innodb status主要包括以下几个部分:

BACKGROUND THREAD
InnoDB存储引擎的核心操作大部分都集中在Mater Thread后台线程中。
MySQL5.5版本之前:
-----------------
BACKGROUND THREAD
-----------------
srv_master_thread loops: 846676 1_second, 846675 sleeps, 84665 10_second, 17 background, 17 flush
srv_master_thread log flush and writes: 854189
MySQL 5.6之后对Master Thread进行了优化,去除了sleeps的信息,srv_active为之前的每秒的循环,srv_idle为每10秒的的循环,srv_shutdown为停止的循环,通常为0,只在MySQL关闭时才会增加。
-----------------
BACKGROUND THREAD
-----------------
srv_master_thread loops: 3911776 srv_active, 0 srv_shutdown, 309625
srv_idlesrv_master_thread log flush and writes: 4221384
上面可以看出主循环每10秒进行了309625次,每秒进行了3911776次,每10秒的操作符合1:10。
负载低的情况下日志缓冲刷盘次数,4221384 ≈ 3911776+309625。
根据循环次数可大概判断当前数据库负载情况。如果每秒循环次数少,每10秒次数多,证明当前负载很低;如果每秒循环次数多,每10秒次数少,远大于10:1,证明当前负载很高。
SEMAPHORES
当前等待线程的列表及事件计数器,可以评估当前负载情况。
----------
SEMAPHORES
----------
OS WAIT ARRAY INFO: reservation count 58961200
OS WAIT ARRAY INFO: signal count 125268732
Mutex spin waits 770371493, rounds 6482840874, OS waits 20699077
RW-shared spins 0, rounds 115276716, OS waits 14655922
RW-excl spins 0, rounds 987115172, OS waits 12384598
RW-sx spins 40484350, rounds 419545112, OS waits 4476477
Spin rounds per wait: 115276716.00 RW-shared, 987115172.00 RW-excl, 10.36 RW-sx
 要明白InnoDB如何处理互斥量(Mutexes),以及什么是两步获得锁(two-step approach)。
1、首先进程试图获得一个锁,如果此锁被它人占用。它就会执行所谓的spin wait,即所谓循环的查询“锁被释放了吗?”。
2、如果在循环过程中,一直未得到锁释放的信息,则其转入OS WAIT,即所谓线程进入挂起(suspended)状态。
3、直到锁被释放后,通过信号(singal)唤醒线程。
Spin wait的消耗远小于OSwaits。Spin wait利用cpu的空闲时间,检查锁的状态,OS Wait会有所谓content switch,从CPU内核中换出当前执行线程以供其它线程使用。所以应尽量减少OS waits,可以通过innodb_sync_spin_loops参数来平衡spin wait和os wait。Mutex信息可通过show engine innodb mutex查看。
2、如果在循环过程中,一直未得到锁释放的信息,则其转入OS WAIT,即所谓线程进入挂起(suspended)状态。
3、直到锁被释放后,通过信号(singal)唤醒线程。
Spin wait的消耗远小于OSwaits。Spin wait利用cpu的空闲时间,检查锁的状态,OS Wait会有所谓content switch,从CPU内核中换出当前执行线程以供其它线程使用。所以应尽量减少OS waits,可以通过innodb_sync_spin_loops参数来平衡spin wait和os wait。Mutex信息可通过show engine innodb mutex查看。
LATEST DETECTED DEADLOCK
记录最近一次死锁信息,只有产生过死锁才会有记录。
------------------------
LATEST DETECTED DEADLOCK
------------------------
190425 18:00:13
*** (1) TRANSACTION:
TRANSACTION 231E7C5DF, ACTIVE 0 sec starting index read
mysql tables in use 1, locked 1
LOCK WAIT 4 lock struct(s), heap size 1248, 3 row lock(s)
MySQL thread id 1346996, OS thread handle 0x7fd968454700, query id 760545285 10.10.x.x app_user updating
DELETE
FROM db_0.table_0
WHERE ORDER_ID IN ( 456787464 , 456787465 )
*** (1) WAITING FOR THIS LOCK TO BE GRANTED:
RECORD LOCKS space id 5 page no 6064 n bits 824 index `orderId_index` of table `db_0`.`table_0` trx id 231E7C5DF lock_mode X waiting
Record lock, heap no 180 PHYSICAL RECORD: n_fields 2; compact format; info bits 32
0: len 8; hex 80000015eb6a1041; asc j A;;
1: len 8; hex 800000002018fce2; asc ;
*** (2) TRANSACTION:
TRANSACTION 231E7C5DD, ACTIVE 0 sec starting index read, thread declared inside InnoDB 1
mysql tables in use 1, locked 1
5 lock struct(s), heap size 1248, 4 row lock(s)
MySQL thread id 1348165, OS thread handle 0x7fd96669f700, query id 760545283 10.10.x.x app_user updating
DELETE FROM db_0.table_0 WHERE ORDER_ID IN ( 456787464 , 456787465 )
*** (2) HOLDS THE LOCK(S):
RECORD LOCKS space id 5 page no 6064 n bits 824 index `orderId_index` of table `db_0`.`table_0` trx id 231E7C5DD lock_mode X locks rec but not gap
Record lock, heap no 180 PHYSICAL RECORD: n_fields 2; compact format; info bits 32
0: len 8; hex 80000015eb6a1041; asc j A;;
1: len 8; hex 800000002018fce2; asc ;;
*** (2) WAITING FOR THIS LOCK TO BE GRANTED:
RECORD LOCKS space id 5 page no 6064 n bits 824 index `orderId_index` of table `db_0`.`table_0` trx id 231E7C5DD lock_mode X waiting
Record lock, heap no 180 PHYSICAL RECORD: n_fields 2; compact format; info bits 32
0: len 8; hex 80000015eb6a1041; asc j A;;
1: len 8; hex 800000002018fce2; asc ;;
*** WE ROLL BACK TRANSACTION (1)
死锁是指两个或两个以上的进程在执行过程中,因争夺资源而造成的一种互相等待的现象。正常死锁会自动释放,innodb有一个内在的死锁检测工具,当死锁超过一定时间后,会回滚其中一个事务,innodb_lock_wait_timeout可配置死锁等待超时时间。
死锁在两情况下最容易产生:
1、高并发同时操作同一条数据
2、存在主键和辅助索引,加锁顺序相反
避免死锁方法即降低并发,操作数据时使加锁顺序相同。
TRANSACTIONS
包含了InnoDB事务(transaction)的统计信息。
------------
TRANSACTIONS
------------
Trx id counter 2409176
Purge done for trx's n:o < 2409171 undo n:o < 0 state: running but idle
History list length 31
LIST OF TRANSACTIONS FOR EACH SESSION:
---TRANSACTION 421224214038352, not started
0 lock struct(s), heap size 1136, 0 row lock(s)
---TRANSACTION 421224214044736, not started
0 lock struct(s), heap size 1136, 0 row lock(s)
---TRANSACTION 421224214039264, not started
0 lock struct(s), heap size 1136, 0 row lock(s)
---TRANSACTION 2409171, ACTIVE 1549 sec fetching rows, thread declared inside InnoDB 3871
mysql tables in use 1, locked 0
0 lock struct(s), heap size 1136, 0 row lock(s)
MySQL thread id 653597, OS thread handle 140289889908480, query id 2528936 127.0.0.1 root Sending data
SELECT /*!40001 SQL_NO_CACHE */ * FROM `table`

FILE I/O
在InnoDB中大量使用了AIO(Async IO)来处理IO 请求,IO Thread主要是负责这些IO请求的回调处理,通过调用fsync()函数协调内存与磁盘之间的数据。
--------
FILE I/O
--------
I/O thread 0 state: waiting for completed aio requests (insert buffer thread)
I/O thread 1 state: waiting for completed aio requests (log thread)
I/O thread 2 state: waiting for completed aio requests (read thread)
I/O thread 3 state: waiting for completed aio requests (read thread)
I/O thread 4 state: waiting for completed aio requests (read thread)
I/O thread 5 state: waiting for completed aio requests (read thread)
I/O thread 6 state: waiting for completed aio requests (read thread)
I/O thread 7 state: waiting for completed aio requests (read thread)
I/O thread 8 state: waiting for completed aio requests (read thread)
I/O thread 9 state: waiting for completed aio requests (read thread)
I/O thread 10 state: waiting for completed aio requests (write thread)
I/O thread 11 state: waiting for completed aio requests (write thread)
I/O thread 12 state: waiting for completed aio requests (write thread)
I/O thread 13 state: waiting for completed aio requests (write thread)
I/O thread 14 state: waiting for completed aio requests (write thread)
I/O thread 15 state: waiting for completed aio requests (write thread)
I/O thread 16 state: waiting for completed aio requests (write thread)
I/O thread 17 state: waiting for completed aio requests (write thread)
Pending normal aio reads: [0, 0, 0, 0, 0, 0, 0, 0] , aio writes: [0, 0, 0, 0, 0, 0, 0, 0] ,
ibuf aio reads:, log i/o's:, sync i/o's:
Pending flushes (fsync) log: 0; buffer pool: 0
15234061 OS file reads, 304461183 OS file writes, 73899457 OS fsyncs
0.00 reads/s, 0 avg bytes/read, 0.24 writes/s, 0.17 fsyncs/s
InnoDB1.0版本之前有4个IO线程,1.1后做了优化,Purge Thread从Master Thread独立出来,Purge Cleaner Thread从InnoDB1.2版本引入,都是为了减轻Master Thread的工作,提高CPU利用率。
 显示各个I/O thread的pending operations,pending的log和buffer pool thread的fsync()调用;
aio:代表的是异步IO(asynchronous I/O);
OS file:显示了reads writes fsync() 调用次数。
INSERT BUFFER AND ADAPTIVE HASH INDEX
INSERT BUFFER即合并插入缓存,从innodb 1.0.x版本开始引入Change Buffer,是INSERT BUFFER升级版,即MySQL 5.1.x以上版本都支持,不仅包括INSERT BUFFER,还包括UPDATE BUFFER、DELETE BUFFER、PURGE BUFFER。
------------------------------------
INSERT BUFFER AND ADAPTIVE HASH INDEX
-------------------------------------
Ibuf: size 1356, free list len 149402, seg size 149404, 2004231
mergesmerged operations:
insert 1373793, delete mark 316276978, delete 5341003
discarded operations:
insert 0, delete mark 0, delete 0
Hash table size 298897, node heap has 1 buffer(s)
Hash table size 298897, node heap has 1 buffer(s)
Hash table size 298897, node heap has 0 buffer(s)
Hash table size 298897, node heap has 1 buffer(s)
Hash table size 298897, node heap has 1 buffer(s)
Hash table size 298897, node heap has 1 buffer(s)
Hash table size 298897, node heap has 2 buffer(s)
Hash table size 298897, node heap has 0 buffer(s)
Hash table size 298897, node heap has 1 buffer(s)
Hash table size 298897, node heap has 0 buffer(s)
Hash table size 298897, node heap has 0 buffer(s)
Hash table size 298897, node heap has 1 buffer(s)
Hash table size 298897, node heap has 1 buffer(s)
193.03 hash searches/s, 713.40 non-hash searches/s
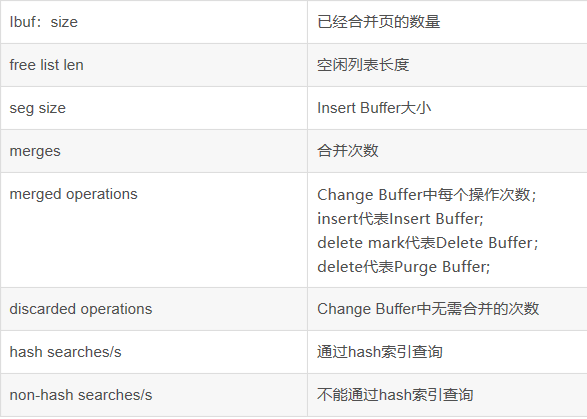
可以看到自适应哈希索引大小、使用情况、每秒使用自适应哈希索引搜索情况。自适应HASH索引,由INNODB存储引擎控制,只适合等值查询,不适合范围查询。可通过innodb_adaptive_hash_index来禁用或启动。
LOG
事物日志的信息。
---
LOG
---
Log sequence number 33859450169594
Log flushed up to 33859450169564
Pages flushed up to 33859450169210
Last checkpoint at 33859450169201
0 pending log flushes, 0 pending chkp writes
15044267 log i/o's done, 0.10 log i/o's/second
InnoDB事物采用Write-Ahead log策略,即事物在提交时,先写重做日志,在修改页。
Write-Ahead Log:如果一个页在写入磁盘时,必须先将内存中小于该页LSN的日志先写入到磁盘中。
重做日志有LSN、每个页有LSN、Checkpoint也有LSN。
Write-Ahead Log:如果一个页在写入磁盘时,必须先将内存中小于该页LSN的日志先写入到磁盘中。
重做日志有LSN、每个页有LSN、Checkpoint也有LSN。
 LSN记录的是重做日志的总量,单位是字节。以下三种情况会将重做日志缓存刷到重做日志文件:
Master Thread 每秒刷重做日志缓存到重做日志文件
innodb_flush_log_at_trx_commit=1时,每次事务提交刷重做日志缓存到重做日志文件
重做日志缓冲池剩余空间小于1/2时,刷重做日志缓存到重做日志文件
BUFFER POOL AND MEMORY
innodb_buffer_pool包含数据页、索引页、undo页、insert buffer、数据字典、自适应哈希索引、锁信息等。数据库缓冲池是通过LRU列表管理的。
----------------------
BUFFER POOL AND MEMORY
----------------------
Total large memory allocated 19789774848
Dictionary memory allocated 3944999
Buffer pool size 1179504
Free buffers 8192
Database pages 1116347
Old database pages 411925
Modified db pages 3
Pending reads 0
Pending writes: LRU 0, flush list 0, single page 0
Pages made young 74514305, not young 649973267
0.21 youngs/s, 0.17 non-youngs/s
Pages read 15233915, created 7356668, written 264739684
0.00 reads/s, 0.00 creates/s, 0.10 writes/s
Buffer pool hit rate 1000 / 1000, young-making rate 0 / 1000 not 0 / 1000
Pages read ahead 0.00/s, evicted without access 0.00/s, Random read ahead 0.00/s
LRU len: 1116347, unzip_LRU len: 0
I/O sum[48]:cur[0], unzip sum[0]:cur[0]

可以看到当前Buffer Pool Size共有1179504页,即1179504*16K。新读取到的页默认插入LRU列表的5/8的位置。此值由innodb_old_blocks_pct控制,即前5/8称为new list,后面3/8的称为old list。Pages made young 显示LRU列表中old list移到new list的次数,not young显示仍在old list的次数。这两个值受innodb_old_blocks_time影响,此值为微秒。如果old list中超过30微秒不再读取,则记录not young,反之记录为Pages made young。
(root@localhost) [(none)] >show global variables like '%blocks%';
+------------------------+-------+
| Variable_name | Value |
+------------------------+-------+
| innodb_old_blocks_pct | 37 |
| innodb_old_blocks_time | 30 |
+------------------------+-------+
youngs/s,non-youngs/s,表示每秒这两类操作的次数。
Pages read,created,written,表示innodb被读取,创建,写入了多少页及每秒的次数。
Buffer pool hit rate,表示缓冲池命中率,如果低于95%需要具体排查。
Pages read ahead,表示页面预读,随机预读的每秒页数。
LRU中包含unzip_LRU,unzip_LRU是管理非16KB的压缩表。
INDIVIDUAL BUFFER POOL INFO
可通过innodb_buffer_pool_instances 来配置多个缓冲池实例,默认为1。可减少数据库内部资源竞争,增加并发处理能力。如果分配多个缓冲池实例,每个缓冲池大小为 innodb_buffer_pool_size / innodb_buffer_pool_instances 。
----------------------
INDIVIDUAL BUFFER POOL INFO
-----------------------
--BUFFER POOL 0
Buffer pool size 147438
Free buffers 1024
Database pages 139530
Old database pages 51486
Modified db pages 0
Pending reads 0
Pending writes: LRU 0, flush list 0, single page 0
Pages made young 8790743, not young 77467460
0.00 youngs/s, 0.00 non-youngs/s
Pages read 1856892, created 916430, written 30727167
0.00 reads/s, 0.00 creates/s, 0.00 writes/s
No buffer pool page gets since the last printout
Pages read ahead 0.00/s, evicted without access 0.00/s, Random read ahead 0.00/s
LRU len: 139530, unzip_LRU len: 0
I/O sum[6]:cur[0], unzip sum[0]:cur[0]
---BUFFER POOL 1
---BUFFER POOL 2
---BUFFER POOL 3
可以通过information_schema.INNODB_BUFFER_POOL_STATS视图查看每个buffer_pool实例的信息,MySQL默认一个page大小为16K,可以得出POOL_SIZE * innodb_buffer_pool_instances * 16K = innodb_buffer_pool_size。
(root@localhost) [information_schema] >select POOL_ID,POOL_SIZE,FREE_BUFFERS,DATABASE_PAGES,OLD_DATABASE_PAGES,MODIFIED_DATABASE_PAGES,PAGES_MADE_YOUNG,PAGES_NOT_MADE_YOUNG from information_schema.INNODB_BUFFER_POOL_STATS;
+---------+-----------+--------------+----------------+--------------------+-------------------------+------------------+----------------------+
| POOL_ID | POOL_SIZE | FREE_BUFFERS | DATABASE_PAGES | OLD_DATABASE_PAGES | MODIFIED_DATABASE_PAGES | PAGES_MADE_YOUNG | PAGES_NOT_MADE_YOUNG |
+---------+-----------+--------------+----------------+--------------------+-------------------------+------------------+----------------------+
| 0 | 90112 | 0 | 90109 | 33279 | 0 | 18064 | 132278807 |
| 1 | 90112 | 0 | 90109 | 33282 | 0 | 18342 | 132086061 |
| 2 | 90112 | 0 | 90110 | 33282 | 0 | 17631 | 132149779 |
+---------+-----------+--------------+----------------+--------------------+-------------------------+------------------+----------------------+
详细说明同上。
ROW OPERATIONS
显示了row 操作及其他一些统计信息。
--------------
ROW OPERATIONS
--------------
0 queries inside InnoDB, 0 queries in queue
0 read views open inside InnoDB
Process ID=444943, Main thread ID=139899621590784, state: sleeping
Number of rows inserted 172887566, updated 227534242, deleted 56676133, read 709667077
8.77 inserts/s, 8.04 updates/s, 0.00 deletes/s, 10.92 reads/s
queries,表示innodb内核中有多少个线程,队列中有多少个线程。
read views open inside InnoDB,表示有多少个read view 被打开,一个read view 包含事物开始点数据库内容的MVCC快照。
Process ID=444943,表示内核的主线程状态。
Number of rows inserted、updated、deleted、read,表示多少行被插入,更新和删除,读取及每秒信息,可用于监控。
Number of rows inserted、updated、deleted、read,表示多少行被插入,更新和删除,读取及每秒信息,可用于监控。
可通过以下命令查看:
(root@localhost) [(none)] >show global status like 'Innodb_rows_%';
+----------------------+-----------+
| Variable_name | Value |
+----------------------+-----------+
| Innodb_rows_deleted | 56676133 |
| Innodb_rows_inserted | 172887566 |
| Innodb_rows_read | 709667077 |
| Innodb_rows_updated | 227534242 |
+----------------------+-----------+(root@localhost) [(none)] >show global status like 'Uptime';
+---------------+---------+
| Variable_name | Value |
+---------------+---------+
| Uptime | 1757270 |
+---------------+---------+
END OF INNODB MONITOR OUTPUT
InnoDB信息结束语。
----------------------------
END OF INNODB MONITOR OUTPUT
============================
如果看不到这行输出,可能是有大量事务或者有一个大的死锁截断了输出信息。
————————————————
版权声明:本文为CSDN博主「MYSQL轻松学」的原创文章,遵循 CC 4.0 BY-SA 版权协议,转载请附上原文出处链接及本声明。
原文链接:https://blog.csdn.net/liang_0609/article/details/93730726