背景:
今天数据库在凌晨6点左右,造成了大量的libarary cache lock,其中导致docker重启都没有释放掉资源。
环境:
oracle:11.2.0.4.20(亚马逊aws用的rds数据库(封装oracle))
linux 环境(具体版本)
原因分析:
由于RDS不能够做awr以及ash报告,貌似可以做一个Statspack报告,但是太麻烦,就没有做。通过监控查看到当时数据库负载最高的是数据库收集信息的一个JOB
(最开始我分析错了,直接在support上找libarary cache lock文档,忽略了监控查看负载,得出的结论错误,没有说服力;这个是我同事看的监控)
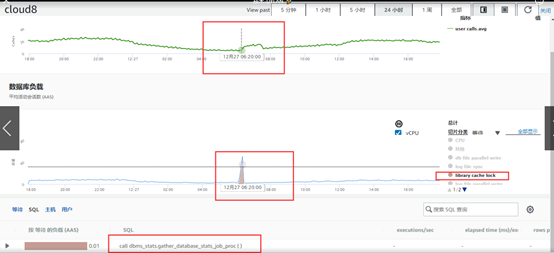
查看aws监控,查看libarary cache lock 排名第一的sql就是数据库的JOB。大家都知道,默认的数据库定时任务是周一之周五晚上22:00 开始,周六,周天是凌晨6:00开始,窗口持续时间是4小时;所以当时我也没有考虑(比较和oracle默认的不一样),但是情况恰好是aws的数据库自动任务窗口就是不一样。
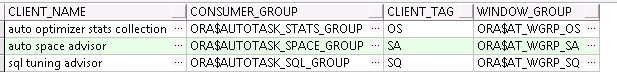
SELECT * FROM DBA_AUTOTASK_CLIENT;

查看到以下全是enabled:
auto optimizer stats collection --统计信息的收集
auto space advisor --自动空间顾问
sql tuning advisor --sql追踪顾问(sql优化顾问)
1.自动优化器统计收集:为所有方案对象收集陈旧的或缺少的统计数据,所收集的统计信息将被用来提高SQL的执行的性能。
2 自动分段顾问:标识数据库中的段是否有可以回收的空间,并以此信息统计为基础做出怎样整理段的碎片以节约空间。也可以手动的执行此job来获取最新的建议信息,或者获取自动段advisor 不检测的但又可以回收的段的信息。
3 自动SQL调整顾问:自动标识并尝试调整高负载的SQL。
10g里的自动任务是以SCHEDULER的JOB形式运行的,可以在dba_scheduler_jobs视图里查到相关的JOB;11g里的自动任务使用的是11g的新特性AUTOTASK的方式实现的。可以从dba_autotask_client视图中查到相关信息。
两个版本中自动任务的执行时间是不同的。
10g中分为两个时间段WEEKNIGHT_WINDOW和WEEKEND_WINDOW,可以从dba_scheduler_windows视图中查到。它们分别的运行开始时间和持续时间为:
WEEKNIGHT_WINDOW,默认的任务,每周一至周五晚22:00:00开始,持续8小时
WEEKEND_WINDOW,第周六00:00:00,持续2天
11g中维护窗口分得更细,分为7个,即第一天个维护窗口,可以针对不同的需求做出更细粒度的调整,dba_scheduler_windows视图中查到,分别为MONDAY_WINDOW,TUESDAY_WINDOW,WEDNESDAY_WINDOW,THURSDAY_WINDOW,FRIDAY_WINDOW,SATURDAY_WINDOW,SUNDAY_WINDOW。开始时间和持续时间分别为:
默认的任务周一到周五晚22:00:00开始,持续4小时,周六和周日早6:00:00开始,执行20小时。
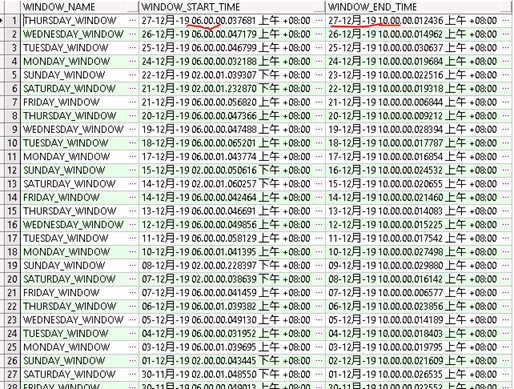
可以查看dba_autotask_开头的视图无查看详细结果以及运行记录。
select * from dba_autotask_window_history order by window_start_time desc ;
select *
from dba_autotask_client_history
where window_start_time >=
to_date('2019-12-27 00:00:00', 'yyyy-mm-dd hh24:mi:ss')
and window_start_time <=
to_date('2019-12-27 12:00:00', 'yyyy-mm-dd hh24:mi:ss');

select client_name,consumer_group,client_tag,window_group from dba_autotask_client;
经过查询,这段时间确实在运行自动维护窗口任务。6-10点,这个自动任务窗口。
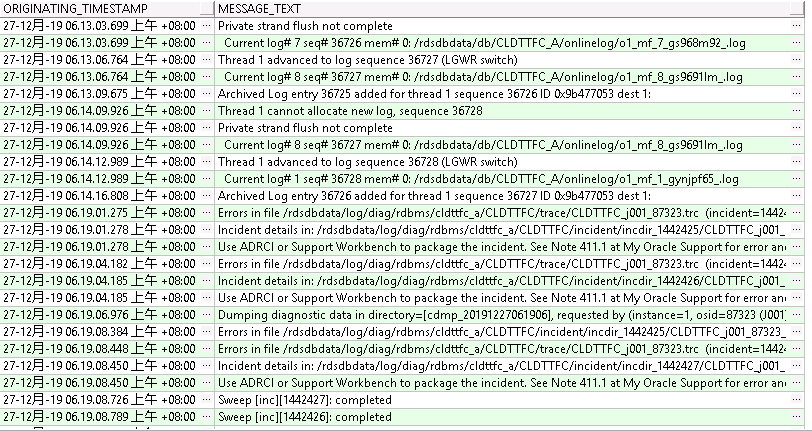
以下是alert日志以及trc日志:
select ORIGINATING_TIMESTAMP, MESSAGE_TEXT
from alertlog
WHERE ORIGINATING_TIMESTAMP BETWEEN
TO_DATE('2019-12-27 06:00:00', 'YYYY-MM-DD HH24:MI:SS') AND
TO_DATE('2019-12-27 07:00:00', 'YYYY-MM-DD HH24:MI:SS')
ORDER BY ORIGINATING_TIMESTAMP asc;
后面把日志download下来:
Setting Resource Manager plan SCHEDULER[0x32CC]:DEFAULT_MAINTENANCE_PLAN via scheduler window
Setting Resource Manager plan DEFAULT_MAINTENANCE_PLAN via parameter
Fri Dec 27 06:00:00 2019
Starting background process VKRM
Fri Dec 27 06:00:00 2019
VKRM started with pid=145, OS id=87222
Fri Dec 27 06:00:02 2019
Begin automatic SQL Tuning Advisor run for special tuning task "SYS_AUTO_SQL_TUNING_TASK"
Fri Dec 27 06:00:52 2019
Thread 1 cannot allocate new log, sequence 36724
Private strand flush not complete
Current log# 4 seq# 36723 mem# 0: /rdsdbdata/db/CLDTTFC_A/onlinelog/o1_mf_4_gynjqr2m_.log
Thread 1 advanced to log sequence 36724 (LGWR switch)
Current log# 5 seq# 36724 mem# 0: /rdsdbdata/db/CLDTTFC_A/onlinelog/o1_mf_5_gs967p0k_.log
Fri Dec 27 06:00:58 2019
Archived Log entry 36722 added for thread 1 sequence 36723 ID 0x9b477053 dest 1:
Fri Dec 27 06:03:38 2019
Thread 1 cannot allocate new log, sequence 36725
Private strand flush not complete
Current log# 5 seq# 36724 mem# 0: /rdsdbdata/db/CLDTTFC_A/onlinelog/o1_mf_5_gs967p0k_.log
Thread 1 advanced to log sequence 36725 (LGWR switch)
Current log# 6 seq# 36725 mem# 0: /rdsdbdata/db/CLDTTFC_A/onlinelog/o1_mf_6_gs9684mm_.log
Fri Dec 27 06:03:44 2019
Archived Log entry 36723 added for thread 1 sequence 36724 ID 0x9b477053 dest 1:
Fri Dec 27 06:08:02 2019
Thread 1 cannot allocate new log, sequence 36726
Private strand flush not complete
Current log# 6 seq# 36725 mem# 0: /rdsdbdata/db/CLDTTFC_A/onlinelog/o1_mf_6_gs9684mm_.log
Thread 1 advanced to log sequence 36726 (LGWR switch)
Current log# 7 seq# 36726 mem# 0: /rdsdbdata/db/CLDTTFC_A/onlinelog/o1_mf_7_gs968m92_.log
Fri Dec 27 06:08:09 2019
Archived Log entry 36724 added for thread 1 sequence 36725 ID 0x9b477053 dest 1:
Fri Dec 27 06:13:03 2019
Thread 1 cannot allocate new log, sequence 36727
Private strand flush not complete
Current log# 7 seq# 36726 mem# 0: /rdsdbdata/db/CLDTTFC_A/onlinelog/o1_mf_7_gs968m92_.log
Thread 1 advanced to log sequence 36727 (LGWR switch)
Current log# 8 seq# 36727 mem# 0: /rdsdbdata/db/CLDTTFC_A/onlinelog/o1_mf_8_gs9691lm_.log
Fri Dec 27 06:13:09 2019
Archived Log entry 36725 added for thread 1 sequence 36726 ID 0x9b477053 dest 1:
Fri Dec 27 06:14:09 2019
Thread 1 cannot allocate new log, sequence 36728
Private strand flush not complete
Current log# 8 seq# 36727 mem# 0: /rdsdbdata/db/CLDTTFC_A/onlinelog/o1_mf_8_gs9691lm_.log
Thread 1 advanced to log sequence 36728 (LGWR switch)
Current log# 1 seq# 36728 mem# 0: /rdsdbdata/db/CLDTTFC_A/onlinelog/o1_mf_1_gynjpf65_.log
Fri Dec 27 06:14:16 2019
Archived Log entry 36726 added for thread 1 sequence 36727 ID 0x9b477053 dest 1:
Fri Dec 27 06:19:01 2019
Errors in file /rdsdbdata/log/diag/rdbms/cldttfc_a/CLDTTFC/trace/CLDTTFC_j001_87323.trc (incident=1442425):
ORA-04030: out of process memory when trying to allocate 432 bytes (kxs-heap-c,kprbalo temp memory)
Incident details in: /rdsdbdata/log/diag/rdbms/cldttfc_a/CLDTTFC/incident/incdir_1442425/CLDTTFC_j001_87323_i1442425.trc
Use ADRCI or Support Workbench to package the incident.
See Note 411.1 at My Oracle Support for error and packaging details.
Errors in file /rdsdbdata/log/diag/rdbms/cldttfc_a/CLDTTFC/trace/CLDTTFC_j001_87323.trc (incident=1442426):
ORA-04030: out of process memory when trying to allocate 169040 bytes (pga heap,kgh stack)
ORA-04030: out of process memory when trying to allocate 432 bytes (kxs-heap-c,kprbalo temp memory)
Incident details in: /rdsdbdata/log/diag/rdbms/cldttfc_a/CLDTTFC/incident/incdir_1442426/CLDTTFC_j001_87323_i1442426.trc
Use ADRCI or Support Workbench to package the incident.
See Note 411.1 at My Oracle Support for error and packaging details.
Fri Dec 27 06:19:06 2019
Dumping diagnostic data in directory=[cdmp_20191227061906], requested by (instance=1, osid=87323 (J001)), summary=[incident=1442426].
Errors in file /rdsdbdata/log/diag/rdbms/cldttfc_a/CLDTTFC/incident/incdir_1442425/CLDTTFC_j001_87323_i1442425.trc:
ORA-04030: out of process memory when trying to allocate 169040 bytes (pga heap,kgh stack)
ORA-04030: out of process memory when trying to allocate 432 bytes (kxs-heap-c,kprbalo temp memory)
Errors in file /rdsdbdata/log/diag/rdbms/cldttfc_a/CLDTTFC/trace/CLDTTFC_j001_87323.trc (incident=1442427):
ORA-04030: out of process memory when trying to allocate 82456 bytes (pga heap,control file i/o buffer)
ORA-04030: out of process memory when trying to allocate 432 bytes (kxs-heap-c,kprbalo temp memory)
Incident details in: /rdsdbdata/log/diag/rdbms/cldttfc_a/CLDTTFC/incident/incdir_1442427/CLDTTFC_j001_87323_i1442427.trc
Use ADRCI or Support Workbench to package the incident.
See Note 411.1 at My Oracle Support for error and packaging details.
Fri Dec 27 06:19:08 2019
Sweep [inc][1442427]: completed
Sweep [inc][1442426]: completed
Sweep [inc][1442425]: completed
Sweep [inc2][1442426]: completed
Fri Dec 27 06:19:10 2019
Thread 1 cannot allocate new log, sequence 36729
Private strand flush not complete
Current log# 1 seq# 36728 mem# 0: /rdsdbdata/db/CLDTTFC_A/onlinelog/o1_mf_1_gynjpf65_.log
Fri Dec 27 06:19:12 2019
Errors in file /rdsdbdata/log/diag/rdbms/cldttfc_a/CLDTTFC/incident/incdir_1442425/CLDTTFC_j001_87323_i1442425.trc:
ORA-04030: out of process memory when trying to allocate 82456 bytes (pga heap,control file i/o buffer)
ORA-04030: out of process memory when trying to allocate 432 bytes (kxs-heap-c,kprbalo temp memory)
Thread 1 advanced to log sequence 36729 (LGWR switch)
Current log# 2 seq# 36729 mem# 0: /rdsdbdata/db/CLDTTFC_A/onlinelog/o1_mf_2_gynjpvd5_.log
Fri Dec 27 06:19:16 2019
Archived Log entry 36727 added for thread 1 sequence 36728 ID 0x9b477053 dest 1:
Fri Dec 27 06:20:08 2019
Sweep [inc2][1442427]: completed
Sweep [inc2][1442425]: completed
Fri Dec 27 06:22:24 2019
Errors in file /rdsdbdata/log/diag/rdbms/cldttfc_a/CLDTTFC/trace/CLDTTFC_j001_87323.trc (incident=1442428):
ORA-04030: out of process memory when trying to allocate 134217752 bytes (QERHJ hash-joi,HT buckets)
Incident details in: /rdsdbdata/log/diag/rdbms/cldttfc_a/CLDTTFC/incident/incdir_1442428/CLDTTFC_j001_87323_i1442428.trc
Use ADRCI or Support Workbench to package the incident.
See Note 411.1 at My Oracle Support for error and packaging details.
Fri Dec 27 06:22:27 2019
Dumping diagnostic data in directory=[cdmp_20191227062227], requested by (instance=1, osid=87323 (J001)), summary=[incident=1442428].
Fri Dec 27 06:22:29 2019
Sweep [inc][1442428]: completed
Sweep [inc2][1442428]: completed
Fri Dec 27 06:23:17 2019
Thread 1 cannot allocate new log, sequence 36730
Private strand flush not complete
Current log# 2 seq# 36729 mem# 0: /rdsdbdata/db/CLDTTFC_A/onlinelog/o1_mf_2_gynjpvd5_.log
Thread 1 advanced to log sequence 36730 (LGWR switch)
Current log# 3 seq# 36730 mem# 0: /rdsdbdata/db/CLDTTFC_A/onlinelog/o1_mf_3_gynjq8t5_.log
明显的报错信息,提示的进程内存用完。
以下是trc的信息:
CLDTTFC_j001_87323.trc
Trace file /rdsdbdata/log/diag/rdbms/cldttfc_a/CLDTTFC/trace/CLDTTFC_j001_87323.trc
Oracle Database 11g Enterprise Edition Release 11.2.0.4.0 - 64bit Production
With the Partitioning, Oracle Label Security, OLAP, Data Mining
and Real Application Testing options
ORACLE_HOME = /rdsdbbin/oracle
System name: Linux
Node name: ip-10-7-2-111
Release: 3.8.13-118.18.3.el7uek.x86_64
Version: #2 SMP Tue May 23 10:33:22 PDT 2017
Machine: x86_64
VM name: Xen Version: 4.2 (HVM)
Instance name: CLDTTFC
Redo thread mounted by this instance: 1
Oracle process number: 303
Unix process pid: 87323, image: oracle@ip-10-7-2-111 (J001)
*** 2019-12-27 06:01:08.153
*** SESSION ID:(14130.62173) 2019-12-27 06:01:08.153
*** CLIENT ID:() 2019-12-27 06:01:08.153
*** SERVICE NAME:(SYS$USERS) 2019-12-27 06:01:08.153
*** MODULE NAME:(DBMS_SCHEDULER) 2019-12-27 06:01:08.153
*** ACTION NAME:(ORA$AT_SQ_SQL_SW_3840) 2019-12-27 06:01:08.153
status=(pst=ERROR)
status=(pst=ERROR)
status=(pst=ERROR)
*** 2019-12-27 06:01:19.449
status=(pst=ERROR)
*** 2019-12-27 06:01:33.033
status=(pst=SUCCESS)
**************************************************************
Execution Statistics
Exec count: 1
CR gets: 1584
CU gets: 0
Disk Reads: 0
Disk Writes: 0
IO Read Requests: 0
IO Write Requests: 0
Bytes Read: 0
Bytes Written: 0
Bytes Exchanged with Storage: 0
Bytes Exchanged with Disk: 0
Bytes Simulated Read: 0
Bytes Simulated Returned: 0
Elapsed Time: 21 (ms)
CPU Time: 21 (ms)
User I/O Time: 0 (us)
status=(pst=ERROR)
status=(pst=SUCCESS)
**************************************************************
Execution Statistics
Exec count: 1
CR gets: 23
CU gets: 0
Disk Reads: 0
Disk Writes: 0
IO Read Requests: 0
IO Write Requests: 0
Bytes Read: 0
Bytes Written: 0
Bytes Exchanged with Storage: 0
Bytes Exchanged with Disk: 0
Bytes Simulated Read: 0
Bytes Simulated Returned: 0
Elapsed Time: 173 (us)
CPU Time: 170 (us)
User I/O Time: 0 (us)
*** 2019-12-27 06:01:35.101
status=(pst=SUCCESS)
**************************************************************
Execution Statistics
Exec count: 1
CR gets: 61
CU gets: 0
Disk Reads: 0
Disk Writes: 0
IO Read Requests: 0
IO Write Requests: 0
Bytes Read: 0
Bytes Written: 0
Bytes Exchanged with Storage: 0
Bytes Exchanged with Disk: 0
Bytes Simulated Read: 0
Bytes Simulated Returned: 0
Elapsed Time: 1772 (us)
CPU Time: 1780 (us)
User I/O Time: 0 (us)
status=(pst=ERROR)
status=(pst=SUCCESS)
**************************************************************
Execution Statistics
Exec count: 1
CR gets: 21
CU gets: 0
Disk Reads: 0
Disk Writes: 0
IO Read Requests: 0
IO Write Requests: 0
Bytes Read: 0
Bytes Written: 0
Bytes Exchanged with Storage: 0
Bytes Exchanged with Disk: 0
Bytes Simulated Read: 0
Bytes Simulated Returned: 0
Elapsed Time: 697 (us)
CPU Time: 686 (us)
User I/O Time: 0 (us)
*** 2019-12-27 06:01:55.361
status=(pst=SUCCESS)
**************************************************************
Execution Statistics
Exec count: 1
CR gets: 120541
CU gets: 0
Disk Reads: 0
Disk Writes: 0
IO Read Requests: 0
IO Write Requests: 0
Bytes Read: 0
Bytes Written: 0
Bytes Exchanged with Storage: 0
Bytes Exchanged with Disk: 0
Bytes Simulated Read: 0
Bytes Simulated Returned: 0
Elapsed Time: 4160 (ms)
CPU Time: 4160 (ms)
User I/O Time: 0 (us)
*** 2019-12-27 06:02:01.423
status=(pst=SUCCESS)
**************************************************************
Execution Statistics
Exec count: 1
CR gets: 1894
CU gets: 0
Disk Reads: 0
Disk Writes: 0
IO Read Requests: 0
IO Write Requests: 0
Bytes Read: 0
Bytes Written: 0
Bytes Exchanged with Storage: 0
Bytes Exchanged with Disk: 0
Bytes Simulated Read: 0
Bytes Simulated Returned: 0
Elapsed Time: 88 (ms)
CPU Time: 88 (ms)
User I/O Time: 0 (us)
status=(pst=ERROR)
status=(pst=SUCCESS)
**************************************************************
Execution Statistics
Exec count: 1
CR gets: 123
CU gets: 0
Disk Reads: 0
Disk Writes: 0
IO Read Requests: 0
IO Write Requests: 0
Bytes Read: 0
Bytes Written: 0
Bytes Exchanged with Storage: 0
Bytes Exchanged with Disk: 0
Bytes Simulated Read: 0
Bytes Simulated Returned: 0
Elapsed Time: 2393 (us)
CPU Time: 2336 (us)
User I/O Time: 0 (us)
*** 2019-12-27 06:02:05.948
status=(pst=ERROR)
*** 2019-12-27 06:03:17.063
status=(pst=TIMEOUT)
**************************************************************
Execution Statistics
Exec count: 0
CR gets: 3851129
CU gets: 0
Disk Reads: 0
Disk Writes: 0
IO Read Requests: 0
IO Write Requests: 0
Bytes Read: 0
Bytes Written: 0
Bytes Exchanged with Storage: 0
Bytes Exchanged with Disk: 0
Bytes Simulated Read: 0
Bytes Simulated Returned: 0
Elapsed Time: 15 (s)
CPU Time: 15 (s)
User I/O Time: 0 (us)
status=(pst=ERROR)
status=(pst=SUCCESS)
**************************************************************
Execution Statistics
Exec count: 1
CR gets: 290878
CU gets: 0
Disk Reads: 0
Disk Writes: 0
IO Read Requests: 0
IO Write Requests: 0
Bytes Read: 0
Bytes Written: 0
Bytes Exchanged with Storage: 0
Bytes Exchanged with Disk: 0
Bytes Simulated Read: 0
Bytes Simulated Returned: 0
Elapsed Time: 2726 (ms)
CPU Time: 2725 (ms)
User I/O Time: 0 (us)
*** 2019-12-27 06:03:17.249
status=(pst=ERROR)
status=(pst=ERROR)
*** 2019-12-27 06:03:23.906
status=(pst=SUCCESS)
**************************************************************
Execution Statistics
Exec count: 1
CR gets: 127412
CU gets: 0
Disk Reads: 0
Disk Writes: 0
IO Read Requests: 0
IO Write Requests: 0
Bytes Read: 0
Bytes Written: 0
Bytes Exchanged with Storage: 0
Bytes Exchanged with Disk: 0
Bytes Simulated Read: 0
Bytes Simulated Returned: 0
Elapsed Time: 181 (ms)
CPU Time: 181 (ms)
User I/O Time: 0 (us)
status=(pst=ERROR)
*** 2019-12-27 06:03:24.267
status=(pst=ERROR)
*** 2019-12-27 06:03:30.802
status=(pst=SUCCESS)
**************************************************************
Execution Statistics
Exec count: 1
CR gets: 127412
CU gets: 0
Disk Reads: 0
Disk Writes: 0
IO Read Requests: 0
IO Write Requests: 0
Bytes Read: 0
Bytes Written: 0
Bytes Exchanged with Storage: 0
Bytes Exchanged with Disk: 0
Bytes Simulated Read: 0
Bytes Simulated Returned: 0
Elapsed Time: 187 (ms)
CPU Time: 186 (ms)
User I/O Time: 0 (us)
status=(pst=ERROR)
mmap(offset=220491776, len=4096) failed with errno=12 for the file ora_j001_CLDTTFC
*** 2019-12-27 06:19:01.229
mmap(offset=220491776, len=4096) failed with errno=12 for the file ora_j001_CLDTTFC
mmap(offset=220491776, len=4096) failed with errno=12 for the file ora_j001_CLDTTFC
mmap(offset=220491776, len=4096) failed with errno=12 for the file ora_j001_CLDTTFC
mmap(offset=220491776, len=4096) failed with errno=12 for the file ora_j001_CLDTTFC
mmap(offset=220491776, len=4096) failed with errno=12 for the file ora_j001_CLDTTFC
mmap(offset=220491776, len=4096) failed with errno=12 for the file ora_j001_CLDTTFC
mmap(offset=220491776, len=4096) failed with errno=12 for the file ora_j001_CLDTTFC
mmap(offset=220491776, len=4096) failed with errno=12 for the file ora_j001_CLDTTFC
mmap(offset=220491776, len=4096) failed with errno=12 for the file ora_j001_CLDTTFC
mmap(offset=220491776, len=4096) failed with errno=12 for the file ora_j001_CLDTTFC
mmap(offset=220491776, len=4096) failed with errno=12 for the file ora_j001_CLDTTFC
mmap(offset=220491776, len=4096) failed with errno=12 for the file ora_j001_CLDTTFC
mmap(offset=220491776, len=4096) failed with errno=12 for the file ora_j001_CLDTTFC
mmap(offset=220491776, len=4096) failed with errno=12 for the file ora_j001_CLDTTFC
mmap(offset=220491776, len=4096) failed with errno=12 for the file ora_j001_CLDTTFC
mmap(offset=220491776, len=4096) failed with errno=12 for the file ora_j001_CLDTTFC
mmap(offset=220491776, len=4096) failed with errno=12 for the file ora_j001_CLDTTFC
mmap(offset=220491776, len=4096) failed with errno=12 for the file ora_j001_CLDTTFC
mmap(offset=220491776, len=4096) failed with errno=12 for the file ora_j001_CLDTTFC
mmap(offset=220491776, len=4096) failed with errno=12 for the file ora_j001_CLDTTFC
Incident 1442425 created, dump file: /rdsdbdata/log/diag/rdbms/cldttfc_a/CLDTTFC/incident/incdir_1442425/CLDTTFC_j001_87323_i1442425.trc
ORA-04030: out of process memory when trying to allocate 432 bytes (kxs-heap-c,kprbalo temp memory)
Incident 1442426 created, dump file: /rdsdbdata/log/diag/rdbms/cldttfc_a/CLDTTFC/incident/incdir_1442426/CLDTTFC_j001_87323_i1442426.trc
ORA-04030: out of process memory when trying to allocate 169040 bytes (pga heap,kgh stack)
ORA-04030: out of process memory when trying to allocate 432 bytes (kxs-heap-c,kprbalo temp memory)
Incident 1442427 created, dump file: /rdsdbdata/log/diag/rdbms/cldttfc_a/CLDTTFC/incident/incdir_1442427/CLDTTFC_j001_87323_i1442427.trc
ORA-04030: out of process memory when trying to allocate 82456 bytes (pga heap,control file i/o buffer)
ORA-04030: out of process memory when trying to allocate 432 bytes (kxs-heap-c,kprbalo temp memory)
最终原因由于运行SYS_AUTO_SQL_TUNING_TASK任务导致的。
select * from v$version;
select * from dba_registry_history;

查看support,有关文档是说的备库bug(这个是单机的主库),显然不成立。
来自(support Doc ID 122793.1)support上还有libarary cache lock的原因:
A DML operation that is hanging because the table which is accessed is currently undergoing changes (ALTER TABLE). This may take quite a long time depending on the size of the table and the type of the modification (e.g. ALTER TABLE x MODIFY (col1 CHAR(200) on a table with thousands of records)
In this case, V$LOCK will show that the session doing the 'ALTER TABLE' with an exclusive DML enqueue lock on the table object (LMODE=6, TYPE=TM where ID1 is the OBJECT_ID of the table). The waiting session however does not show up in V$LOCK. So in an environment with a lot of concurrent sessions, the V$LOCK information will be insufficient to track down the culprit blocking your operation.
The compilation of package will hang on Library Cache Lock and Library Cache Pin if any users are executing a procedure/function defined in the same package.
1. 由于访问的表, DML操作被夯住正在更改(ALTER TABLE)。根据表的大小和修改的类型,这可能会花费很长时间(例如,ALTER TABLE x MODIFY(具有数千条记录的表上的col1 CHAR(200)))。
2. 如果任何用户正在执行同一程序包中定义的相同的存储过程/功能,则程序包的编译将夯住在库高速缓存锁和库高速缓存销上。
显然不是这两个原因,具体原因具体分析,一味的套support文档容易引起思路错误。
结论:
由于数据库自带的定时任务收集(auto optimizer stats collection ,auto space advisor,sql tuning advisor )信息,导致pga进程内存以及临时内存不足,引起的大量的libarary cache lock。
问题处理:
关掉不必要的sql tuning advisor(其实也可以关掉auto space advisor),除了统计信息必须收集之外。
SELECT * FROM DBA_AUTOTASK_CLIENT;
SELECT * FROM DBA_AUTOTASK_WINDOW_CLIENTS;
begin
DBMS_AUTO_TASK_ADMIN.DISABLE('SQL TUNING ADVISOR',NULL, NULL);
DBMS_AUTO_TASK_ADMIN.disable( client_name =>'sql tuning advisor',operation => NULL, window_name =>'MONDAY_WINDOW');
DBMS_AUTO_TASK_ADMIN.disable( client_name =>'sql tuning advisor',operation => NULL, window_name =>'TUESDAY_WINDOW');
DBMS_AUTO_TASK_ADMIN.disable( client_name =>'sql tuning advisor',operation => NULL, window_name =>'WEDNESDAY_WINDOW');
DBMS_AUTO_TASK_ADMIN.disable( client_name =>'sql tuning advisor',operation => NULL, window_name =>'THURSDAY_WINDOW');
DBMS_AUTO_TASK_ADMIN.disable( client_name =>'sql tuning advisor',operation => NULL, window_name =>'FRIDAY_WINDOW');
DBMS_AUTO_TASK_ADMIN.disable( client_name =>'sql tuning advisor',operation => NULL, window_name =>'SATURDAY_WINDOW');
DBMS_AUTO_TASK_ADMIN.disable( client_name =>'sql tuning advisor',operation => NULL, window_name =>'SUNDAY_WINDOW');
end;
/
select * from dba_autotask_client_history order by 3 desc;