一 背景需求
Nginx是一个非常优秀的web服务器,往往Nginx服务会作为项目的访问入口,那么,nginx的性能保障就会变得非常重要,如果nginx的运行出现了问题就会对项目有较大的影响,所以,我们需要对nginx的运行有监控措施,实时掌握Nginx的运行情况,那就需要收集Nginx的运行指标和分析Nginx的运行日志了
业务流程
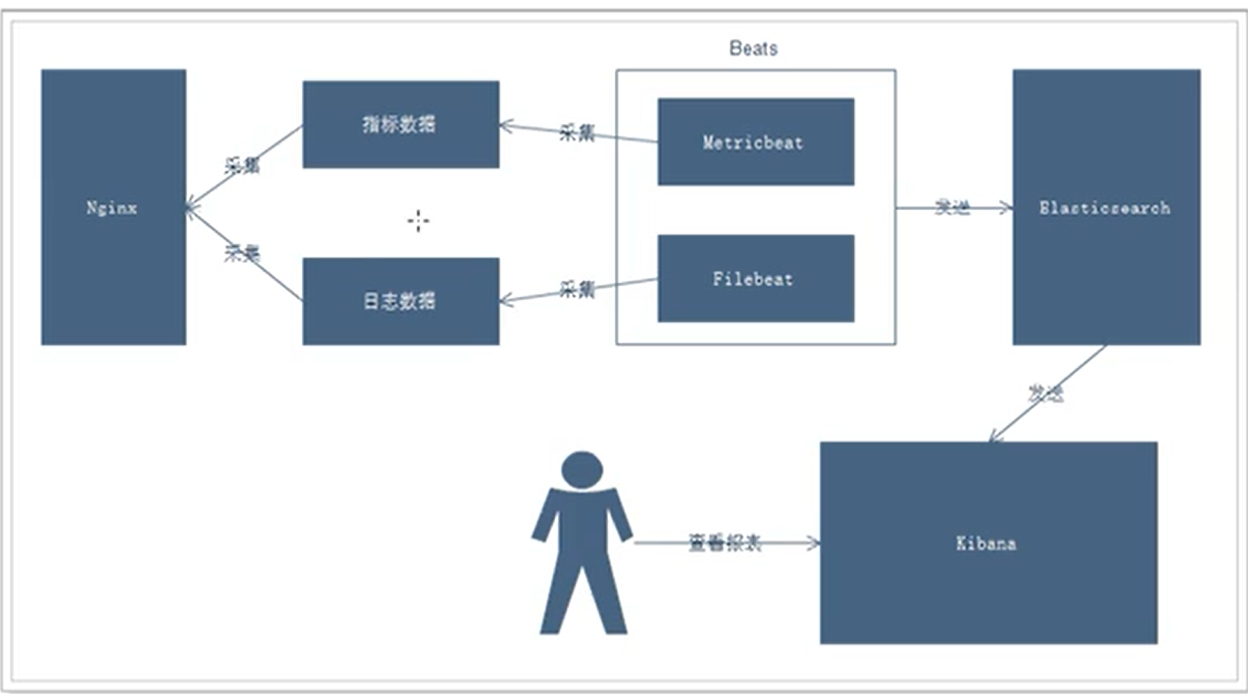
说明
通过beats采集Nginx的指标数据和日志数据
Beats采集到数据后发送到Elasticsearch中
kibana读取数据进行分析
用户通过Kibana进行查看分析报表
安装一个nginx,实验使用,最简单安装就可以
[root@node4 ~]# cd /usr/local/src/
[root@node4 src]# wget http://nginx.org/download/nginx-1.16.1.tar.gz
[root@node4 src]# yum -y install pcre-devel zlib-devel
[root@node4 src]# tar -xf nginx-1.16.1.tar.gz
[root@node4 src]# cd nginx-1.16.1
[root@node4 nginx-1.16.1]# ./configure
[root@node4 nginx-1.16.1]# make && make install
[root@node4 nginx-1.16.1]# ll /usr/local/nginx/
[root@node4 nginx-1.16.1]# ln -s /usr/local/nginx/sbin/nginx /usr/bin/
启动nginx
[root@node4 nginx-1.16.1]# nginx
[root@node4 nginx-1.16.1]# netstat -ntlp
tcp 0 0 0.0.0.0:80 0.0.0.0:* LISTEN 14721/nginx: master
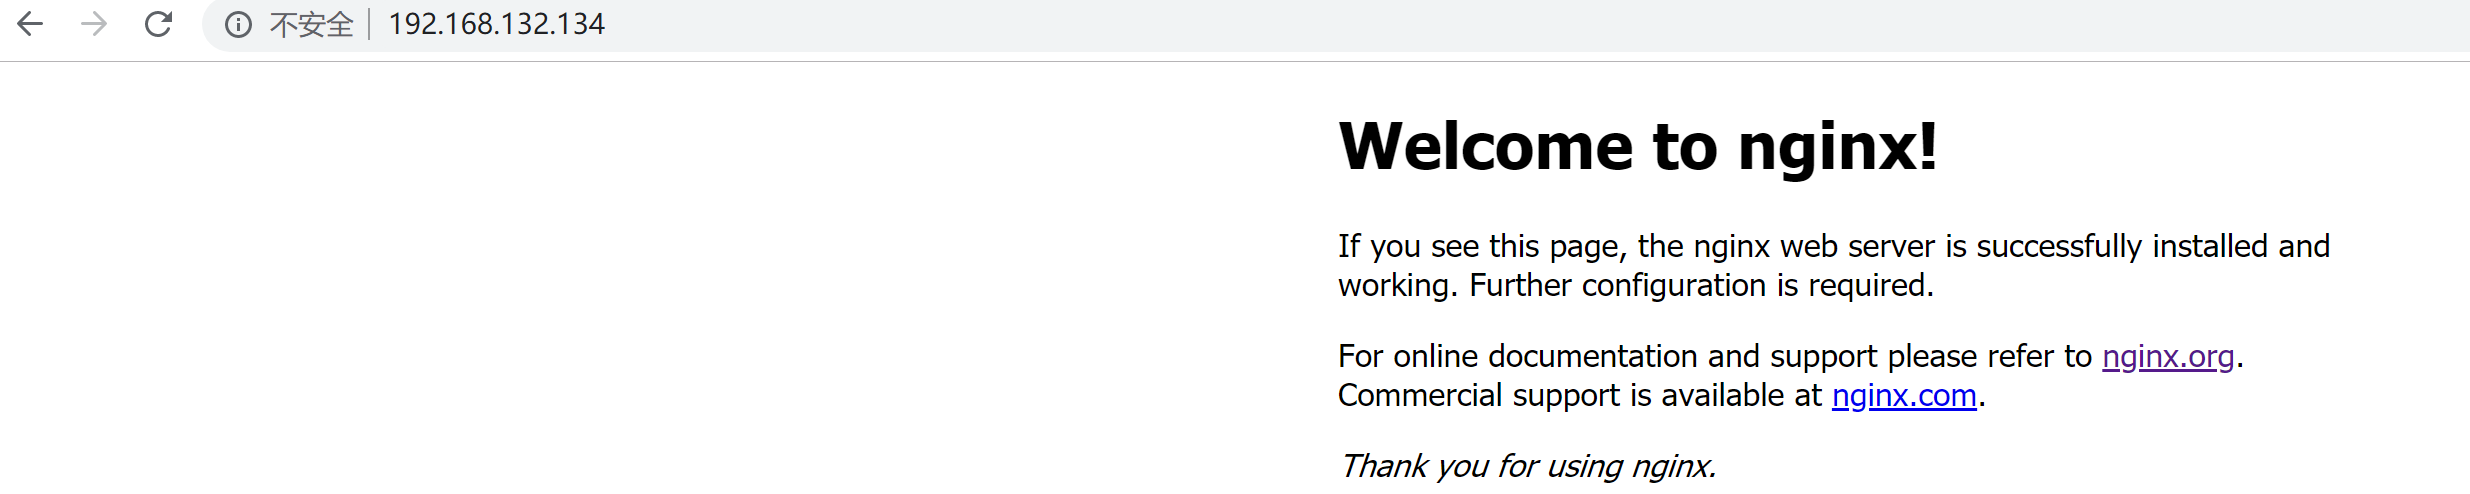
访问
查看实时日志
[root@node4 ~]# tail -f /usr/local/nginx/logs/access.log
192.168.132.1 - - [24/Nov/2019:03:15:12 -0500] "GET / HTTP/1.1" 304 0 "-" "Mozilla/5.0 (Windows NT 10.0; Win64; x64) AppleWebKit/537.36 (KHTML, like Gecko) Chrome/78.0.3904.108 Safari/537.36"
192.168.132.1 - - [24/Nov/2019:03:15:13 -0500] "GET / HTTP/1.1" 304 0 "-" "Mozilla/5.0 (Windows NT 10.0; Win64; x64) AppleWebKit/537.36 (KHTML, like Gecko) Chrome/78.0.3904.108 Safari/537.36"
二 beats简介
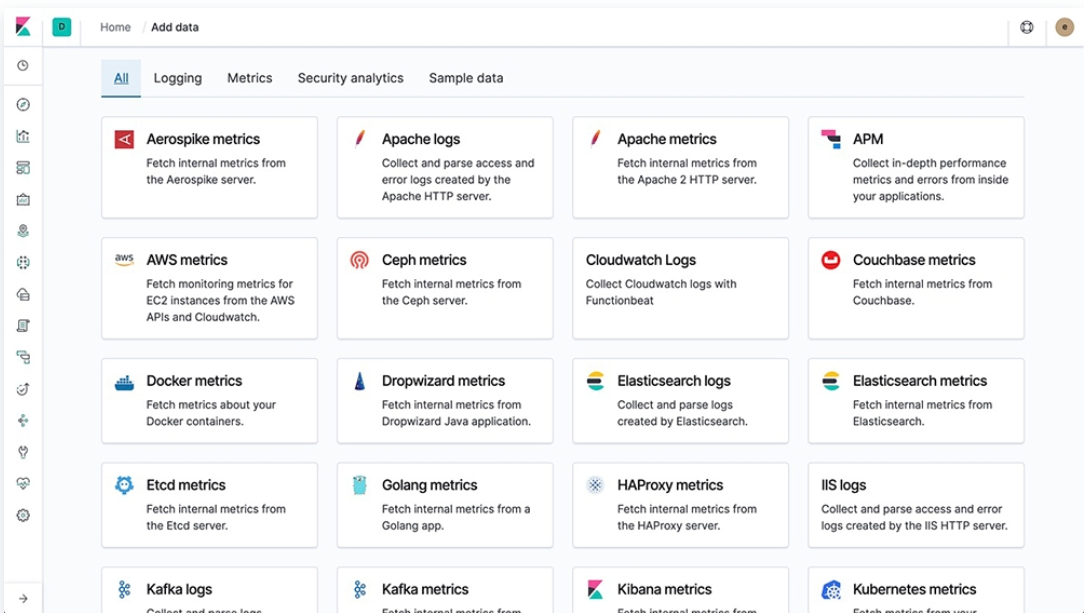
2.1 借助模块加速数据可视化体验
Filebeat 和 Metricbeat 内部集成了一系列模块,用以简化常见日志格式(例如 NGINX、Apache 或诸如 Redis 或 Docker 等系统指标)的收集、解析和可视化过程。只需运行一行命令,即可开始探索。
2.2 跟踪数据沿袭
Beats 从您的专属环境中收集日志和指标,然后通过来自主机、诸如 Docker 和 Kubernetes 等容器平台以及云服务提供商的必要元数据对这些内容进行记录,然后再传输到 Elastic Stack 中。从监测容器到从无需服务器的架构传输数据,我们确保您拥有所需的上下文。

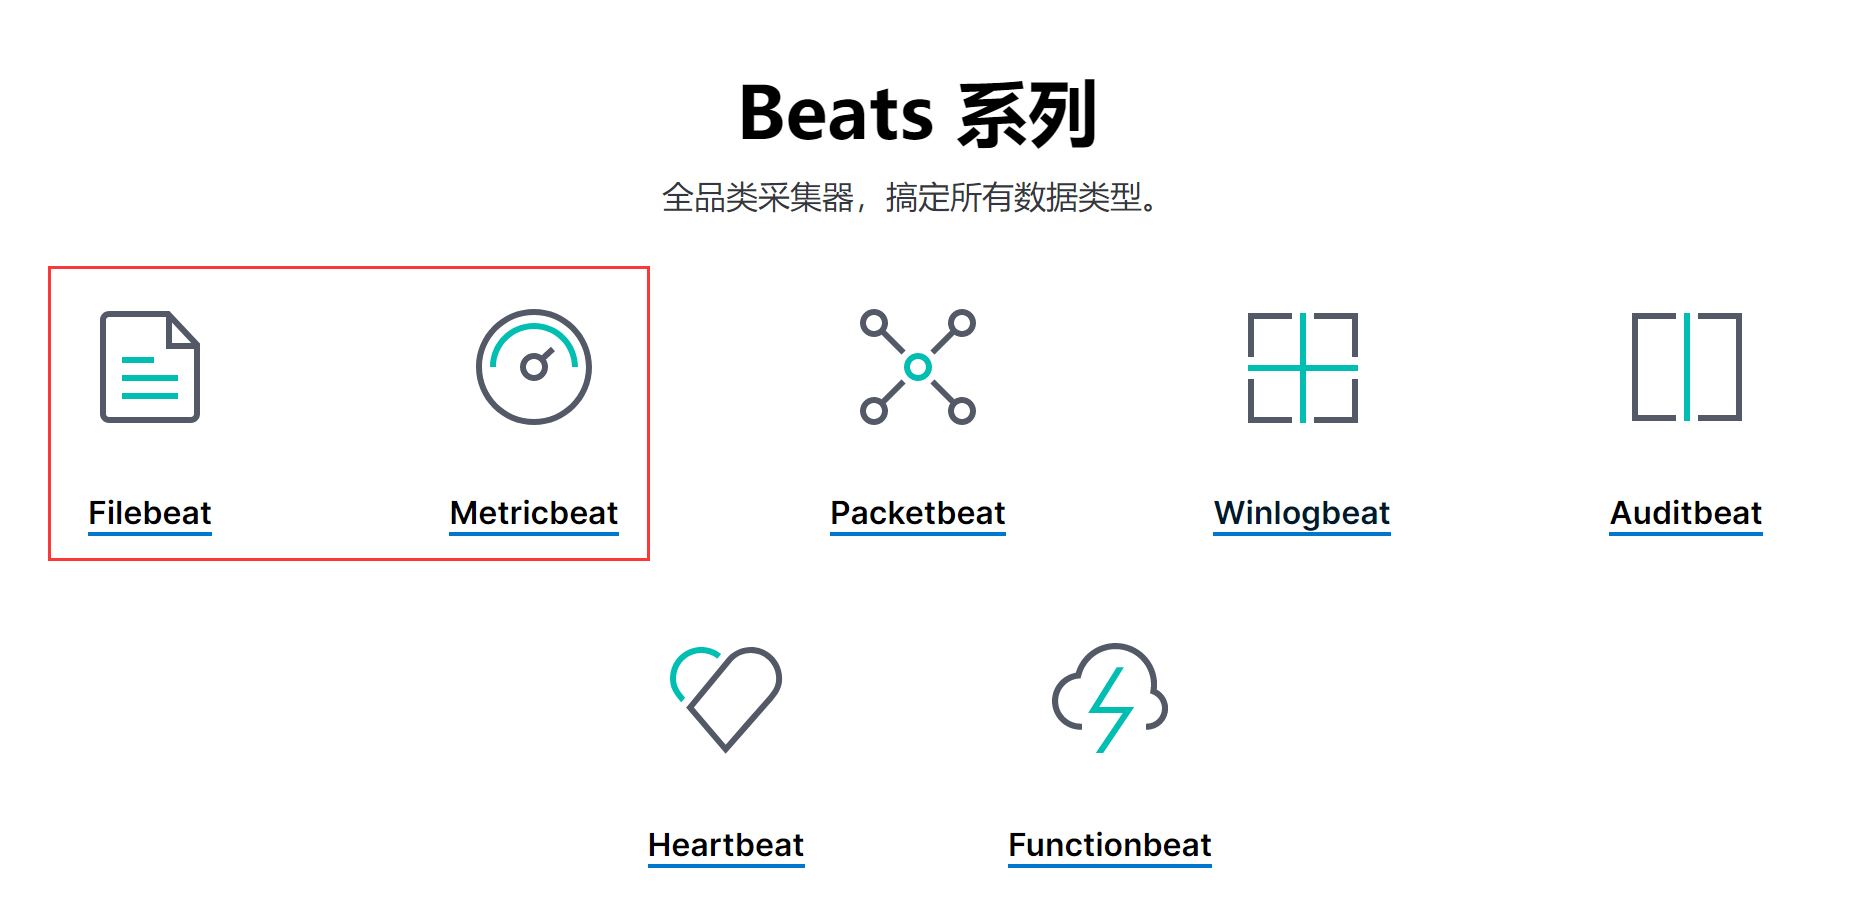
2.3 beats系列产品
三 filebeat
3.1 轻量型日志采集器
当您要面对成百上千、甚至成千上万的服务器、虚拟机和容器生成的日志时,请告别 SSH 吧。Filebeat 将为您提供一种轻量型方法,用于转发和汇总日志与文件,让简单的事情不再繁杂。
filebeat优点
- 无论在任何环境中,随时都潜伏着应用程序中断的风险。Filebeat 能够读取并转发日志行,如果出现中断,还会在一切恢复正常后,从中断前停止的位置继续开始。
- Filebeat 内置有多种模块(auditd、Apache、NGINX、System、MySQL 等等),可针对常见格式的日志大大简化收集、解析和可视化过程,只需一条命令即可。之所以能实现这一点,是因为它将自动默认路径(因操作系统而异)与 Elasticsearch 采集节点管道的定义和 Kibana 仪表板组合在一起。不仅如此,数个 Filebeat 模块还包括预配置的 Machine Learning 任务。
- 正在对所有内容进行容器化,或者正在云端环境中运行?通过 Elastic Stack,可以轻松地监测容器和云服务。在 Kubernetes、Docker 或云端部署中部署 Filebeat,即可获得所有的日志流:信息十分完整,包括日志流的 pod、容器、节点、VM、主机以及自动关联时用到的其他元数据。此外,Beats Autodiscover 功能可检测到新容器,并使用恰当的 Filebeat 模块对这些容器进行自适应监测。
- 当将数据发送到 Logstash 或 Elasticsearch 时,Filebeat 使用背压敏感协议,以应对更多的数据量。如果 Logstash 正在忙于处理数据,则会告诉 Filebeat 减慢读取速度。一旦拥堵得到解决,Filebeat 就会恢复到原来的步伐并继续传输数据。
- Filebeat 是 Elastic Stack 的一部分,因此能够与 Logstash、Elasticsearch 和 Kibana 无缝协作。无论您要使用 Logstash 转换或充实日志和文件,还是在 Elasticsearch 中随意处理一些数据分析,亦或在 Kibana 中构建和分享仪表板,Filebeat 都能轻松地将您的数据发送至最关键的地方。
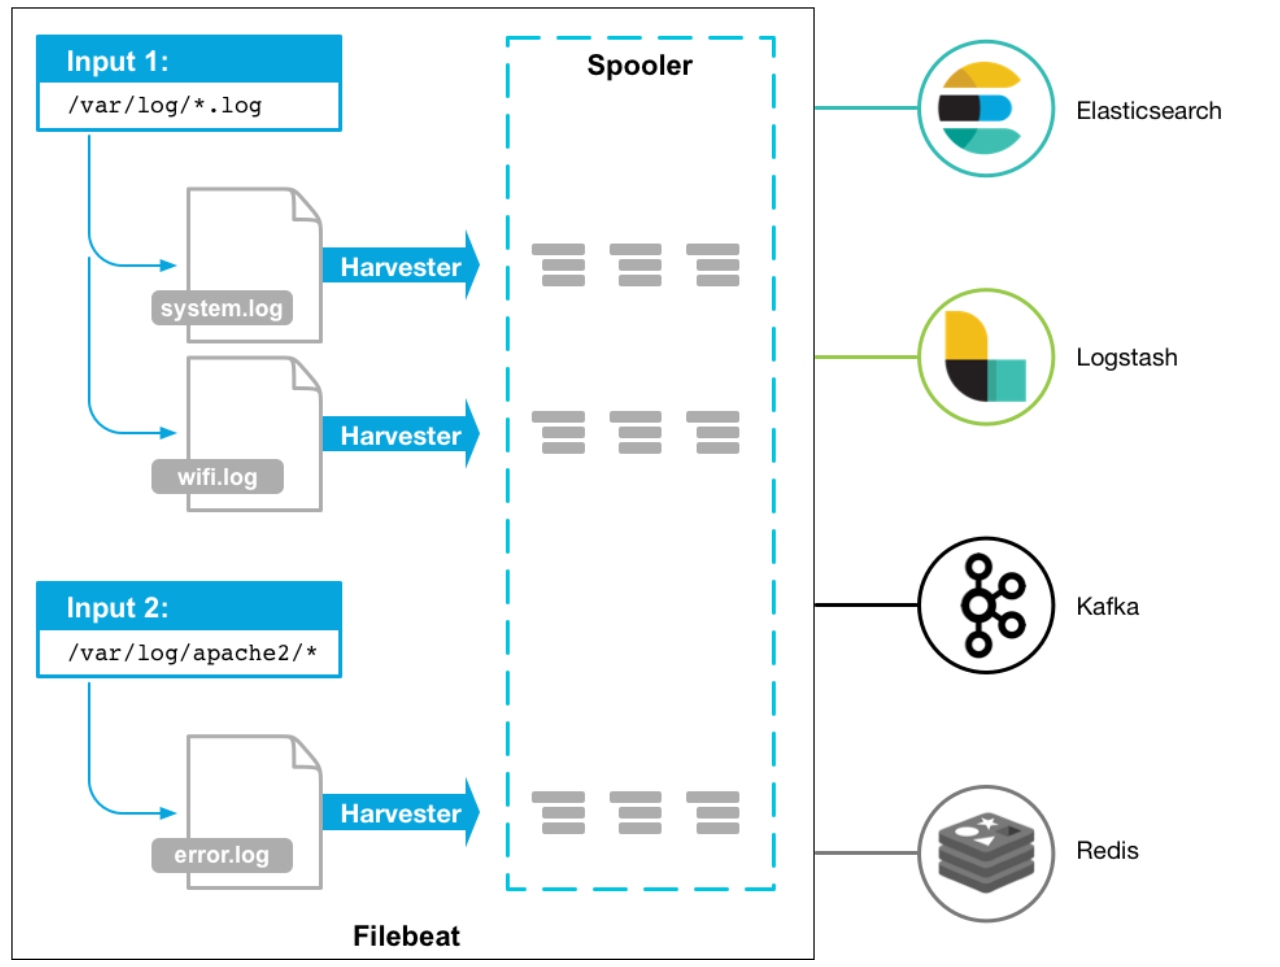
3.1 架构
3.2 部署filebeat
[root@node4 ~]# cd /usr/local/src/
[root@node4 src]# wget https://artifacts.elastic.co/downloads/beats/filebeat/filebeat-7.4.2-linux-x86_64.tar.gz
[root@node4 src]# tar -xf filebeat-7.4.2-linux-x86_64.tar.gz
[root@node4 src]# mv filebeat-7.4.2-linux-x86_64 /usr/local/filebeat
[root@node4 src]# cd /usr/local/filebeat
[root@node4 filebeat]# vi darrentest.yml
filebeat.inputs:
- type: stdin
  enabled: true
setup.template.settings:
  index.number_of_shards: 3
output.console:                  #表示输出到控制台
  pretty: true
  enable: true
3.3 启动
[root@node4 filebeat]# ./filebeat -e -c darrentest.yml
输入一个hello
hello
{
  "@timestamp": "2019-11-24T08:41:55.256Z",
  "@metadata": {
    "beat": "filebeat",
    "type": "_doc",
    "version": "7.4.2"
  },
  "host": {
    "name": "node4"
  },
  "agent": {
    "ephemeral_id": "615a3c81-396c-49db-a322-3d2c94446500",
    "hostname": "node4",
    "id": "e4d0d55f-9fd7-45bc-8443-606c9ac55552",
    "version": "7.4.2",
    "type": "filebeat"
  },
  "log": {
    "file": {
      "path": ""
    },
    "offset": 0
  },
  "message": "hello",
  "input": {
    "type": "stdin"
  },
  "ecs": {
    "version": "1.1.0"
  }
}
四 filebeat读取文件
4.1 控制台简单输出日志文件
配置一个yml文件
[root@node4 filebeat]# cp darrentest.yml darren-log.yml
[root@node4 filebeat]# vi darren-log.yml
filebeat.inputs:
- type: log
  enabled: true
  paths:
    - /opt/logs/*.log
setup.template.settings:
  index.number_of_shards: 3
output.console:
  pretty: true
  enable: true
[root@node4 filebeat]# ./filebeat -e -c darrent-log.yml

[root@node4 ~]# mkdir /opt/logs
[root@node4 ~]# touch /opt/logs/a.log
[root@node4 ~]# echo "hello.I'm darren" > /opt/logs/a.log
{
  "@timestamp": "2019-11-24T09:03:31.027Z",
  "@metadata": {
    "beat": "filebeat",
    "type": "_doc",
    "version": "7.4.2"
  },
  "log": {
    "offset": 0,
    "file": {
      "path": "/opt/logs/a.log"
    }
  },
  "message": "hello.I'm darren",
  "input": {
    "type": "log"
  },
  "host": {
    "name": "node4"
  },
  "agent": {
    "id": "2832793b-3bb6-4081-b05f-1955815440d0",
    "version": "7.4.2",
    "type": "filebeat",
    "ephemeral_id": "40c00976-1a62-4db5-9ead-876a28aad6a6",
    "hostname": "node4"
  },
  "ecs": {
    "version": "1.1.0"
  }
}
[root@node4 ~]# echo "345" > /opt/logs/a.log
{
  "@timestamp": "2019-11-24T09:22:41.161Z",
  "@metadata": {
    "beat": "filebeat",
    "type": "_doc",
    "version": "7.4.2"
  },
  "agent": {
    "id": "2832793b-3bb6-4081-b05f-1955815440d0",
    "version": "7.4.2",
    "type": "filebeat",
    "ephemeral_id": "40c00976-1a62-4db5-9ead-876a28aad6a6",
    "hostname": "node4"
  },
  "log": {
    "file": {
      "path": "/opt/logs/a.log"
    },
    "offset": 0
  },
  "message": "345",
  "input": {
    "type": "log"
  },
  "ecs": {
    "version": "1.1.0"
  },
  "host": {
    "name": "node4"
  }
}
4.2 添加一个tag,输出日志
[root@node4 filebeat]# vi darren-log.yml
filebeat.inputs:
- type: log
  enabled: true
  paths:
    - /opt/logs/a.log
  tags: ["web","test"]
setup.template.settings:
  index.number_of_shards: 3
output.console:
  pretty: true
  enable: true
[root@node4 filebeat]# ./filebeat -e -c darren-log.yml
[root@node4 ~]# echo "34567" > /opt/logs/a.log
输出
{
  "@timestamp": "2019-11-24T09:27:29.553Z",
  "@metadata": {
    "beat": "filebeat",
    "type": "_doc",
    "version": "7.4.2"
  },
  "input": {
    "type": "log"
  },
  "agent": {
    "type": "filebeat",
    "ephemeral_id": "5f74afa4-42a5-47de-a3c6-82c1563ed44d",
    "hostname": "node4",
    "id": "2832793b-3bb6-4081-b05f-1955815440d0",
    "version": "7.4.2"
  },
  "ecs": {
    "version": "1.1.0"
  },
  "host": {
    "name": "node4"
  },
  "log": {
    "offset": 0,
    "file": {
      "path": "/opt/logs/a.log"
    }
  },
  "message": "34567",
  "tags": [
    "web",
    "test"
  ]
}
4.3 添加自定义字段输出日志
[root@node4 filebeat]# vi darren-log.yml
ilebeat.inputs:
- type: log
  enabled: true
  paths:
    - /opt/logs/a.log
  tags: ["web","test"]                #添加tag
  fields:                             #自定义字段
    from: test-web
  fields_under_root: true             #设为true为添加到根节点
setup.template.settings:
  index.number_of_shards: 3
output.console:
  pretty: true
  enable: true
[root@node4 filebeat]# ./filebeat -e -c darren-log.yml
[root@node4 ~]# echo "345678910" > /opt/logs/a.log
输出
{
  "@timestamp": "2019-11-24T09:40:27.804Z",
  "@metadata": {
    "beat": "filebeat",
    "type": "_doc",
    "version": "7.4.2"
  },
  "message": "34567891011",
  "tags": [
    "web",
    "test"
  ],
  "input": {
    "type": "log"
  },
  "from": "test-web",
  "ecs": {
    "version": "1.1.0"
  },
  "host": {
    "name": "node4"
  },
  "agent": {
    "ephemeral_id": "28e91024-d253-4f8f-b4e6-0b26db1a1087",
    "hostname": "node4",
    "id": "2832793b-3bb6-4081-b05f-1955815440d0",
    "version": "7.4.2",
    "type": "filebeat"
  },
  "log": {
    "file": {
      "path": "/opt/logs/a.log"
    },
    "offset": 12
  }
}
4.4 输出到elasticsearch
修改yml文件
[root@node4 filebeat]# vi darren-log.yml
filebeat.inputs:
- type: log
  enabled: true
  paths:
    - /opt/logs/a.log
  tags: ["web","test"]
  fields:
    from: test-web
  fields_under_root: true
setup.template.settings:
  index.number_of_shards: 3
output.elasticsearch:
  hosts: ["192.168.132.131","192.168.132.132","192.168.132.133"]
#output.console:
#  pretty: true
#  enable: true
启动
[root@node4 filebeat]# ./filebeat -e -c darren-log.yml
输入三个数据
[root@node4 ~]# echo "123" >> /opt/logs/a.log
[root@node4 ~]# echo "345" >> /opt/logs/a.log
[root@node4 ~]# echo "4456" >> /opt/logs/a.log
4.5 Elasticsearch输出
查看elasticsearch
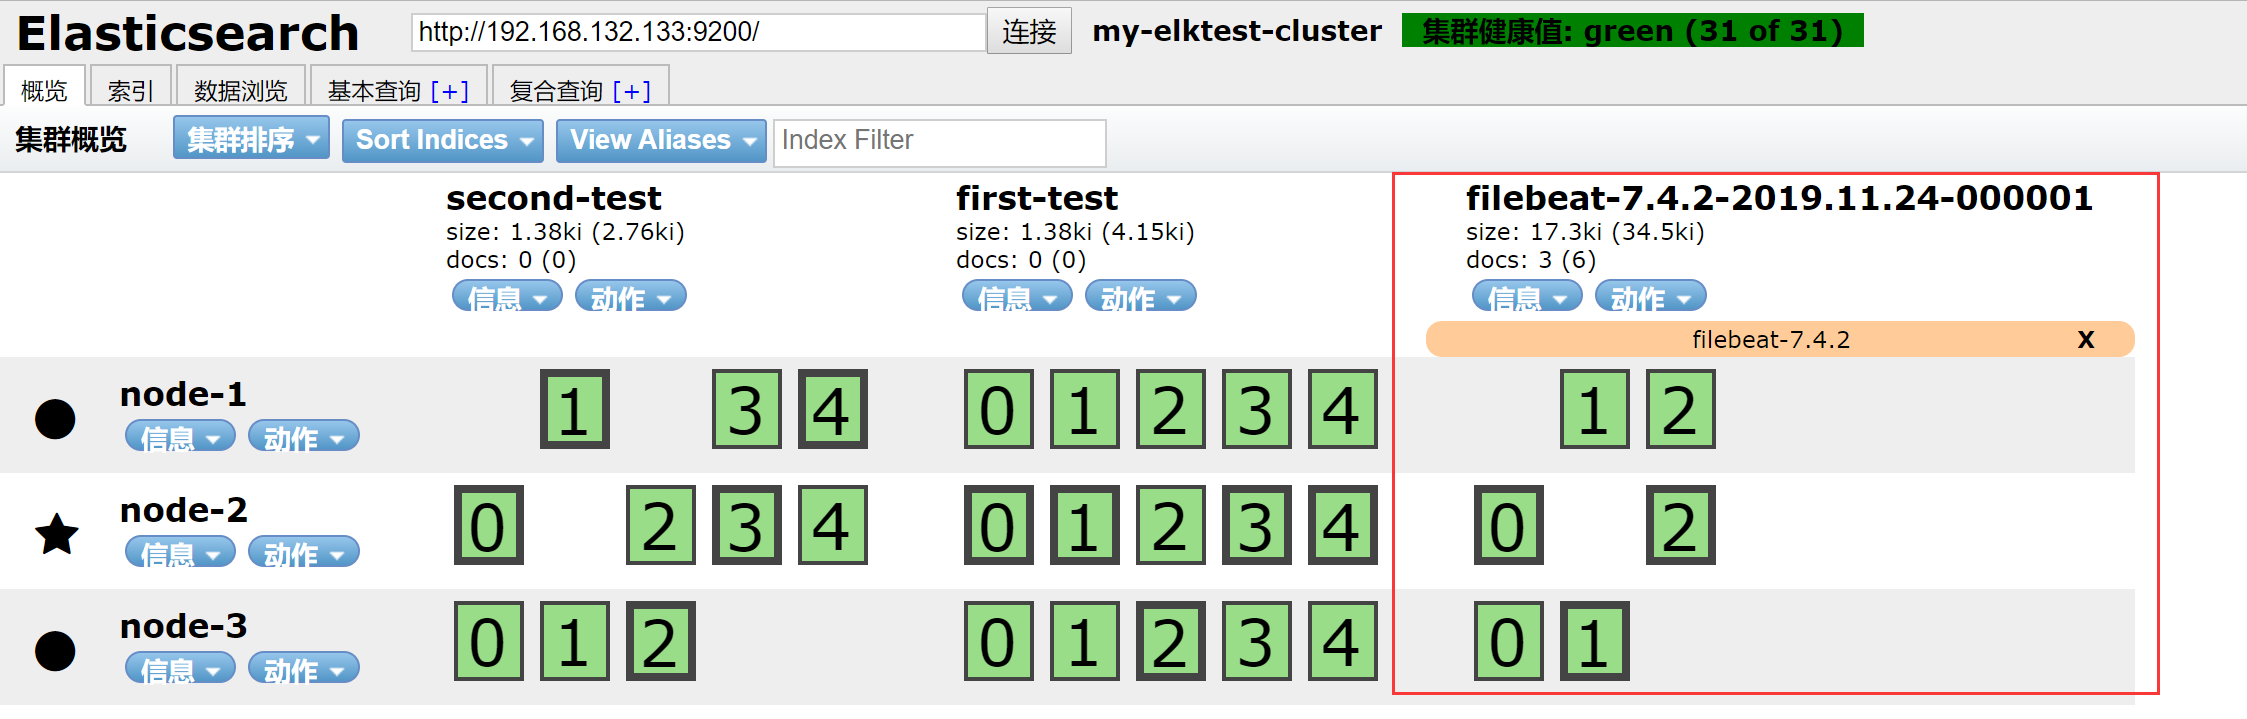
查看数据
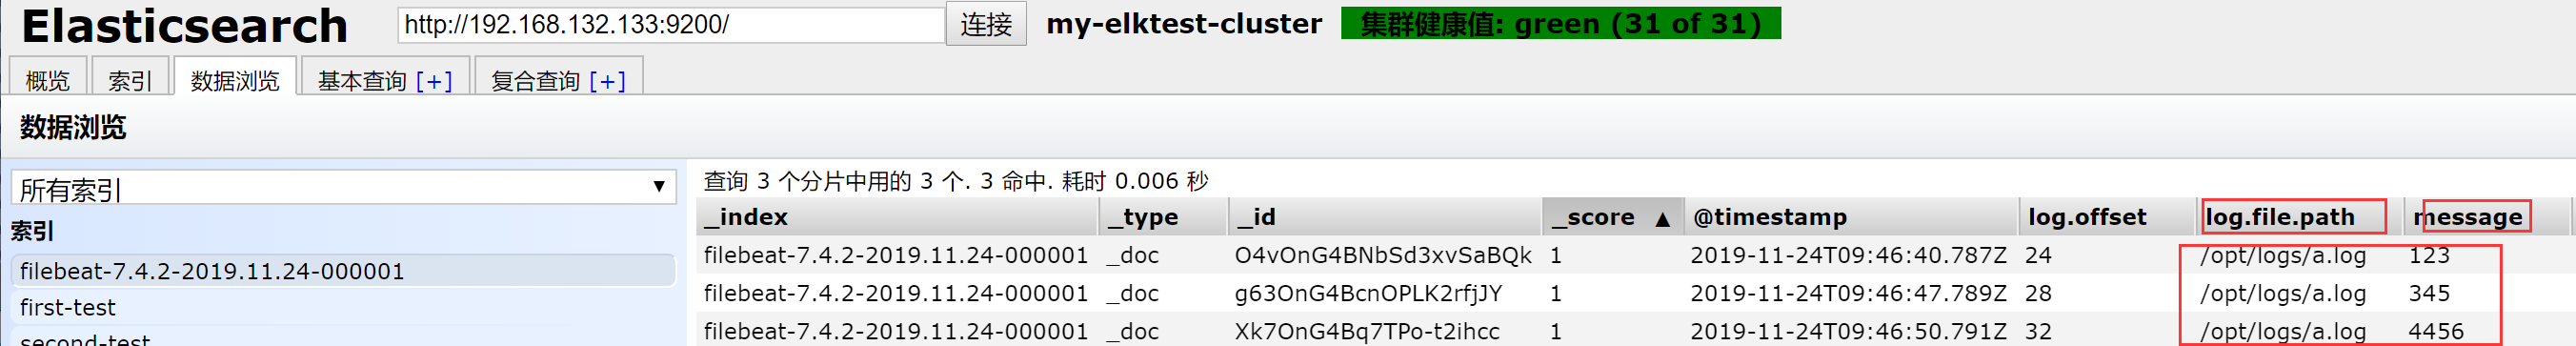
数据已经读取到
filebeat的简单使用实验先做到这里