Prometheus的安装还是比较简单的
下载地址如下
https://prometheus.io/download/
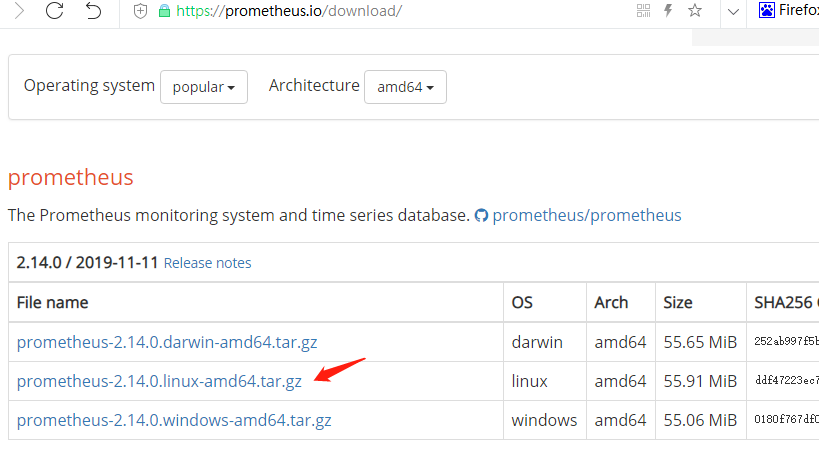
解压,修改配置,运行。默认监听9090端口
[root@localhost ~]# tar -xvf prometheus-2.14.0.linux-amd64.tar.gz
[root@localhost ~]# cd prometheus-2.14.0.linux-amd64
[root@localhost prometheus-2.14.0.linux-amd64]# cat prometheus.yml |grep 9090    #因为我需要在外部访问,所以把以下部分的localhost修改为服务器IP
    - targets: ['192.168.100.128:9090']
[root@localhost prometheus-2.14.0.linux-amd64]# ./prometheus
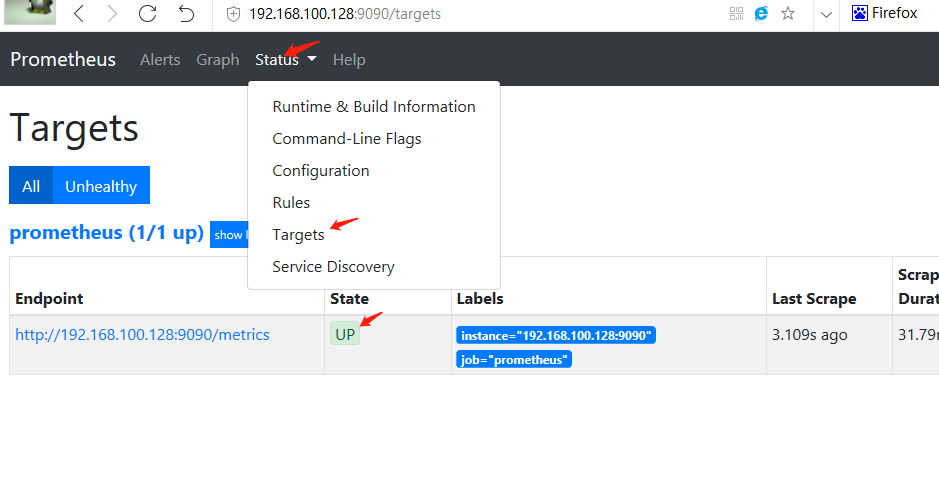
访问WEB
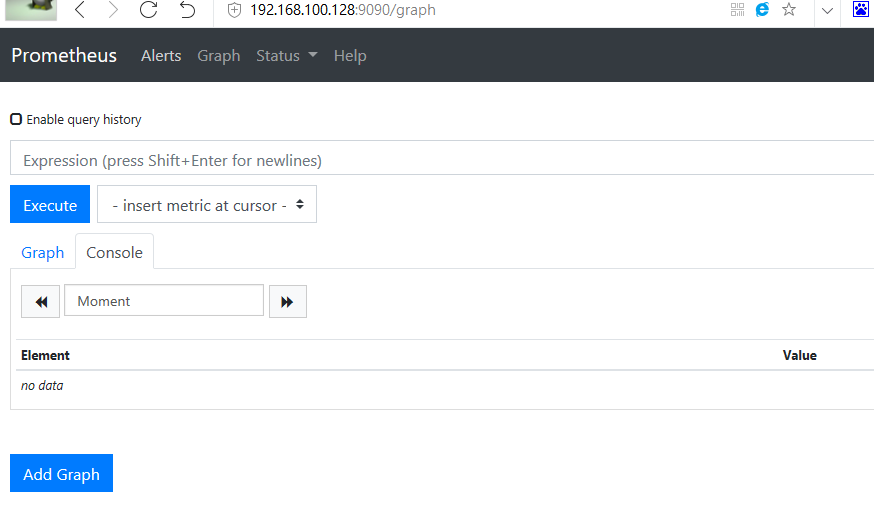
查看能否正常监控到数据。state为up则为监控正常
下面我们尝试监控MySQL
部署安装配置MySQL的步骤就滤过了。都是老生常谈。数据库账号密码root/123456
下载mysqld_exporter
https://prometheus.io/download/#mysqld_exporter
解压,配置连接MySQL的信息,运行。默认监听9104端口
[root@localhost ~]# tar -xvf mysqld_exporter-0.ar.gz
[root@localhost ~]# cat /root/.my.cnf
[client]
host=127.0.0.1
user=root
password=123456
[root@localhost ~]# cd mysqld_exporter-0.12.1.linux-amd64
[root@localhost mysqld_exporter-0.12.1.linux-amd64]#mysqld_exporter
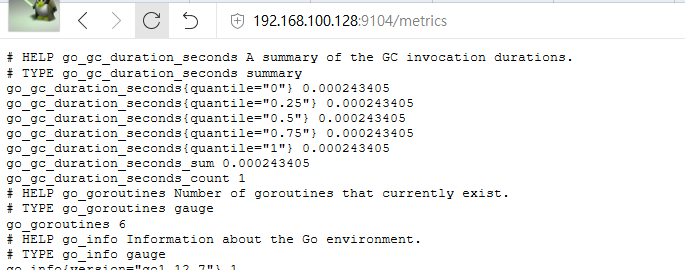
访问9104端口,看能否正常访问到
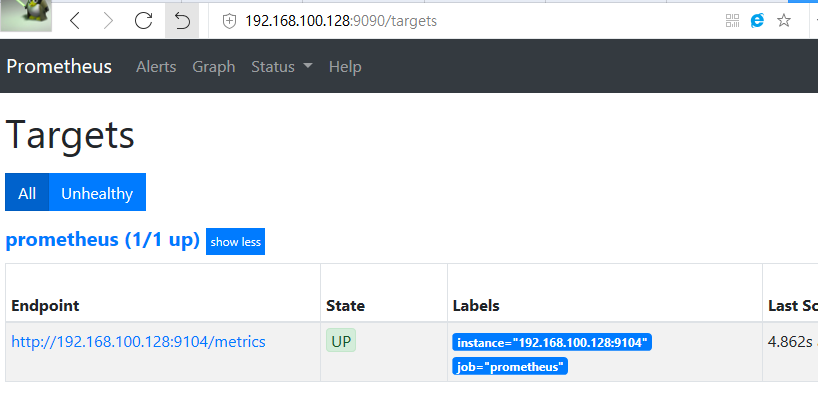
现在我们让Prometheus监控MySQL。只需修改yml文件,把9090修改为9104端口即可
[root@localhost prometheus-2.14.0.linux-amd64]# grep 9104 prometheus.yml
    - targets: ['192.168.100.128:9104']
[root@localhost prometheus-2.14.0.linux-amd64]#
修改以上配置后重启Prometheus。页面刷新后自动修改为监控9104端口了
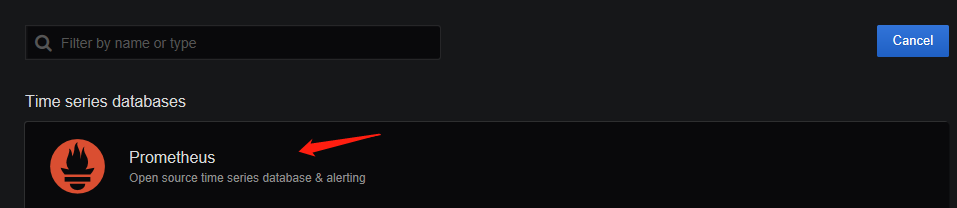
配置grafana
安装并启动grafana。默认监听3000端口
wget https://dl.grafana.com/oss/release/grafana-6.4.4-1.x86_64.rpm
yum install grafana-6.4.4-1.x86_64.rpm
systemctl start grafana-server
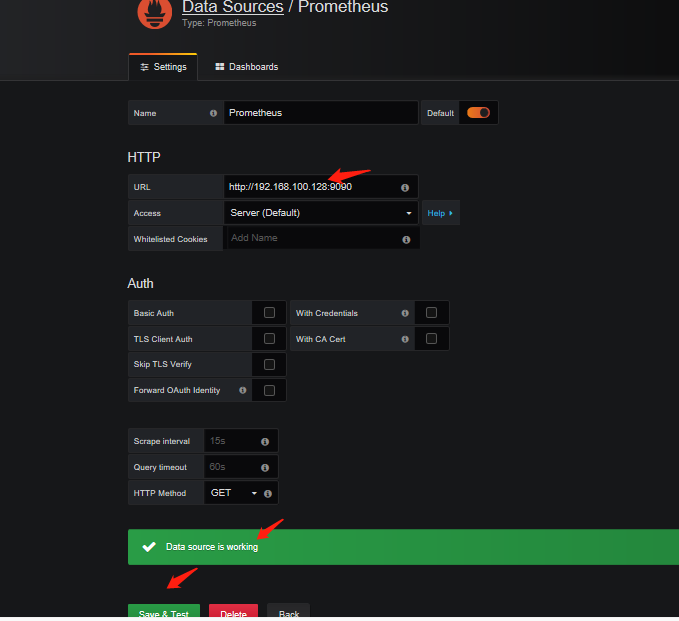
配置grafana显示Prometheus数据