Blackbox_exporter 主动监测主机与服务状态
Prometheus 官方提供的 exporter 之一,可以提供 http、dns、tcp、icmp 的监控数据采集
官方github: https://github.com/prometheus/blackbox_exporter
部署Blackbox_exporter
[sss@prometheus01 ]$ cd /usr/local/blackbox_exporter/
[sss@prometheus01 ]$ wget https://github.com/prometheus/blackbox_exporter/releases/download/v0.12.0/blackbox_exporter-0.12.0.linux-amd64.tar.gz
[sss@prometheus01 ]$ tar zxvf blackbox_exporter-0.12.0.linux-amd64.tar.gz
[sss@prometheus01 blackbox_exporter-0.12.0.linux-amd64]$ cd blackbox_exporter-0.12.0.linux-amd64
[sss@prometheus01 blackbox_exporter-0.12.0.linux-amd64]$ ll
total 15720
-rwxr-xr-x. 1 1000 1000 16074005 Feb 27  2018 blackbox_exporter
-rw-rw-r--. 1 1000 1000      932 Nov 21 16:05 blackbox.yml
-rw-rw-r--. 1 1000 1000    11357 Feb 27  2018 LICENSE
-rw-rw-r--. 1 1000 1000       94 Feb 27  2018 NOTICE
[sss@prometheus01 blackbox_exporter-0.12.0.linux-amd64]$cp -r blackbox_exporter /usr/local/bin
[sss@prometheus01 blackbox_exporter-0.12.0.linux-amd64]$ cat /etc/supervisord.conf|grep blackbox -A 20
[program:blackbox_exporter]
command=/usr/local/bin/blackbox_exporter   --config.file=/usr/local/prometheus/blackbox_exporter/blackbox_exporter-0.12.0.linux-amd64/blackbox.yml
stdout_logfile=/tmp/prometheus/blackbox_exporter.log
autostart=true
autorestart=true
startsecs=5
priority=1
user=root
stopasgroup=true
killasgroup=true
[sss@prometheus01 blackbox_exporter-0.12.0.linux-amd64]$ supervisorctl  status |grep blackbox
blackbox_exporter                RUNNING   pid 25343, uptime 0:19:25
blackbox.yml 文件
- 通过 blackbox.yml 定义模块详细信息
- 在 Prometheus 配置文件中引用该模块以及配置被监控目标主机
modules:
  http_2xx:
    prober: http
    timeout: 10s
    http:
      preferred_ip_protocol: "ip4" ##如果http监测是使用ipv4 就要写上,目前国内使用ipv6很少。
  http_post_2xx_query: ##用于post请求使用的模块)由于每个接口传参不同 可以定义多个module 用于不同接口(例如此命名为http_post_2xx_query 用于监测query.action接口
    prober: http
    timeout: 15s
    http:
      preferred_ip_protocol: "ip4" ##使用ipv4
      method: POST
      headers:
        Content-Type: application/json ##header头
      body: '{"hmac":"","params":{"publicFundsKeyWords":"xxx"}}' ##传参
  tcp_connect:
    prober: tcp
  pop3s_banner:
    prober: tcp
    tcp:
      query_response:
      - expect: "^+OK"
      tls: true
      tls_config:
        insecure_skip_verify: false
  ssh_banner:
    prober: tcp
    tcp:
      query_response:
      - expect: "^SSH-2.0-"
  irc_banner:
    prober: tcp
    tcp:
      query_response:
      - send: "NICK prober"
      - send: "USER prober prober prober :prober"
      - expect: "PING :([^ ]+)"
        send: "PONG ${1}"
      - expect: "^:[^ ]+ 001"
  icmp:
    prober: icmp
    timeout: 5s
    icmp:
Blackbox_exporter 应用场景
HTTP 测试
定义 Request Header 信息
判断 Http status / Http Respones Header / Http Body 内容
TCP 测试
业务组件端口状态监听
应用层协议定义与监听
ICMP 测试
主机探活机制
POST 测试
接口联通性
SSL 证书过期时间HTTP 测试
相关代码块添加到 Prometheus 文件内
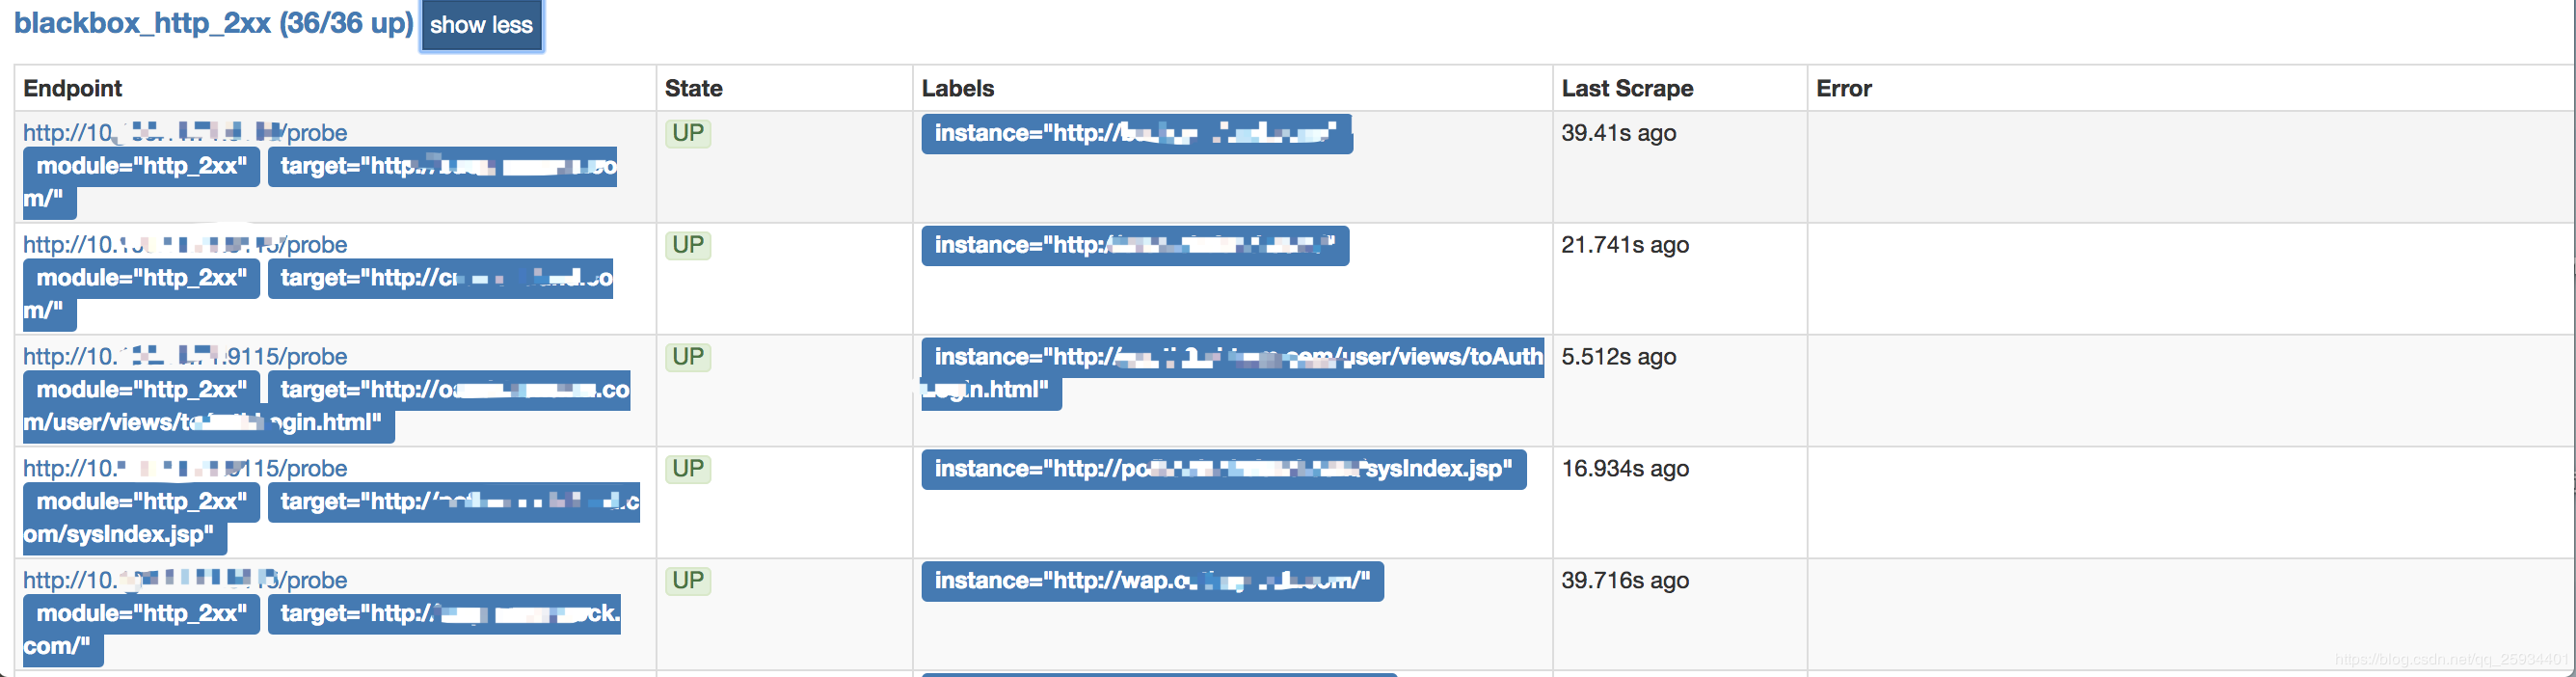
对应 blackbox.yml文件的 http_2xx 模块- job_name: 'blackbox_http_2xx' scrape_interval: 45s metrics_path: /probe params: module: [http_2xx] # Look for a HTTP 200 response. static_configs: - targets: - https://www.baidu.com/ - 172.0.0.1:9090 relabel_configs: - source_labels: [__address__] target_label: __param_target - source_labels: [__param_target] target_label: instance - target_label: __address__ replacement: 10.XXX.XX.XX:9115 # The blackbox exporter's real hostname:port.
http截图
TCP 测试
- 监听 业务端口地址,用来判断服务是否在线,我觉的和telnet 差不多
- 相关代码块添加到 Prometheus 文件内
- 对应 blackbox.yml文件的 tcp_connect 模块
-
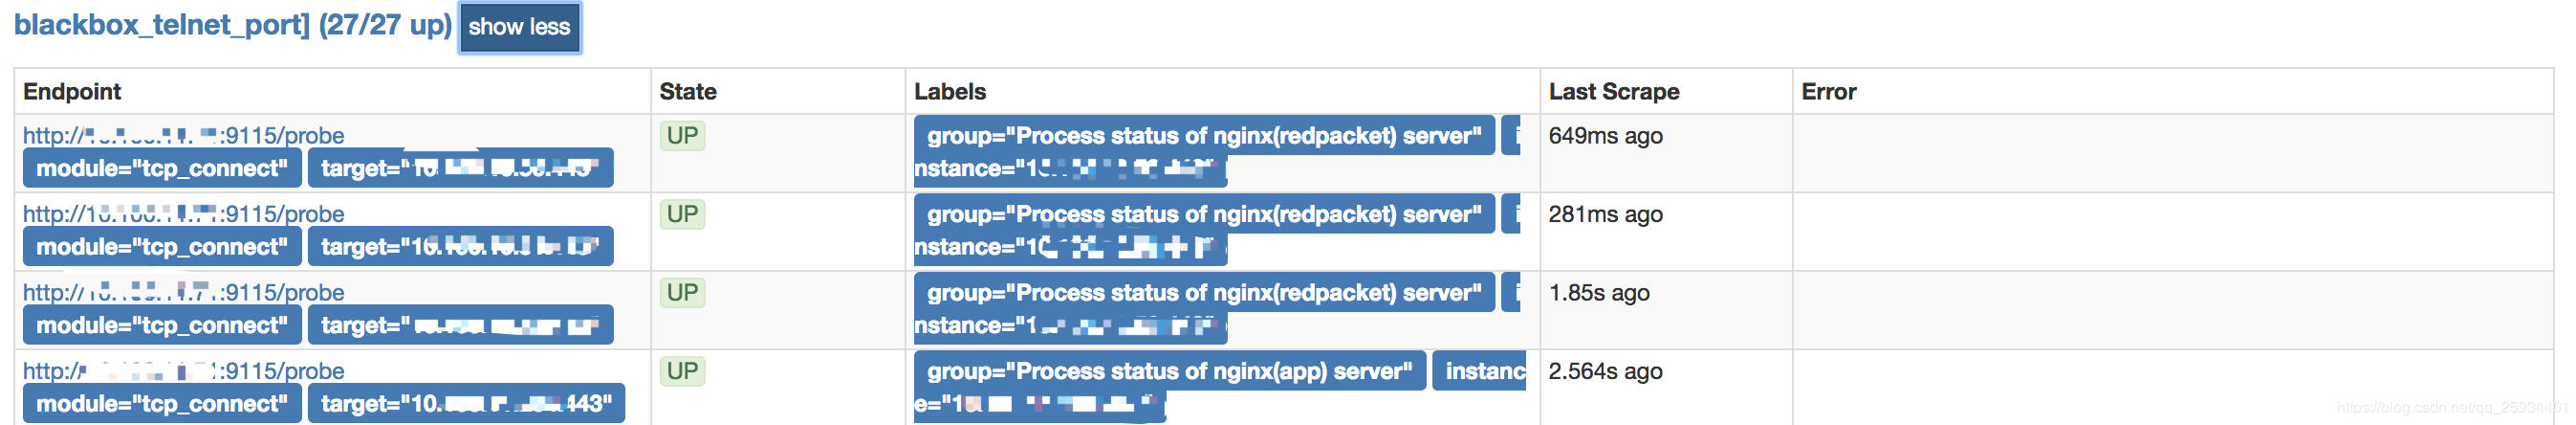
- job_name: "blackbox_telnet_port]"
  scrape_interval: 5s
  metrics_path: /probe
  params:
    module: [tcp_connect]
  static_configs:
      - targets: [ '1x3.x1.xx.xx4:443' ]
        labels:
          group: 'xxxidc机房ip监控'
      - targets: ['10.xx.xx.xxx:443']
        labels:
          group: 'Process status of nginx(main) server'
  relabel_configs:
      - source_labels: [__address__]
        target_label: __param_target
      - source_labels: [__param_target]
        target_label: instance
      - target_label: __address__
        replacement: 10.xxx.xx.xx:9115
tcp_connect截图
ICMP 测试
- 相关代码块添加到 Prometheus 配置文件内
- 对应 blackbox.yml文件的 icmp 模块
-
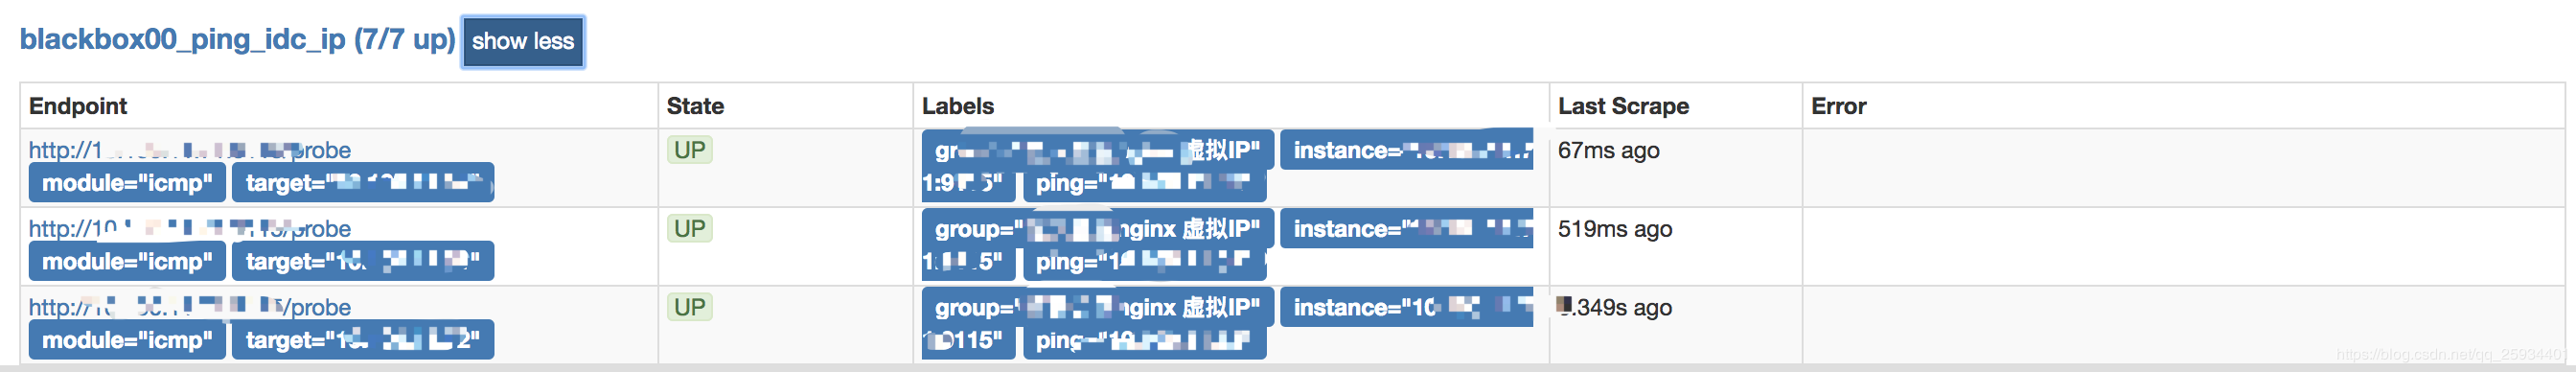
- job_name: 'blackbox00_ping_idc_ip'
  scrape_interval: 10s
  metrics_path: /probe
  params:
    module: [icmp]  #ping
  static_configs:
      - targets: [ '1x.xx.xx.xx' ]
        labels:
          group: 'xxnginx 虚拟IP'
  relabel_configs:
      - source_labels: [__address__]
        regex: (.*)(:80)?
        target_label: __param_target
        replacement: ${1}
      - source_labels: [__param_target]
        regex: (.*)
        target_label: ping
        replacement: ${1}
      - source_labels: []
        regex: .*
        target_label: __address__
        replacement: 1x.xxx.xx.xx:9115
icmp截图
POST 测试
- 监听业务接口地址,用来判断接口是否在线
- 相关代码块添加到 Prometheus 文件内
- 对应 blackbox.yml文件的 http_post_2xx_query 模块(监听query.action这个接口)
-
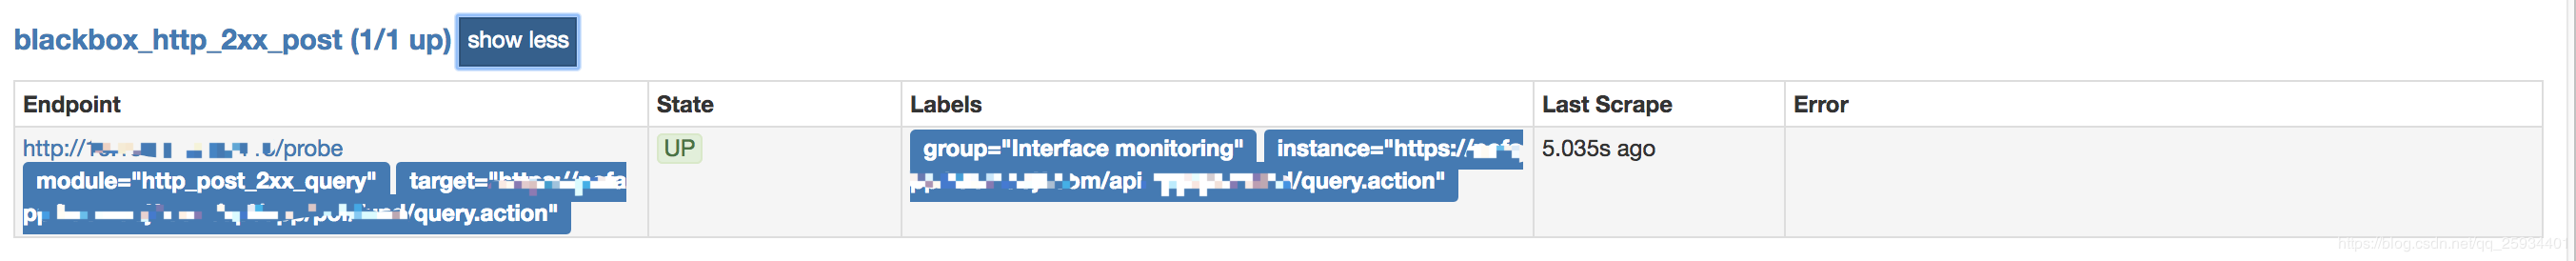
- job_name: 'blackbox_http_2xx_post'
  scrape_interval: 10s
  metrics_path: /probe
  params:
    module: [http_post_2xx_query]
  static_configs:
      - targets:
        - https://xx.xxx.com/api/xx/xx/fund/query.action
        labels:
          group: 'Interface monitoring'
  relabel_configs:
      - source_labels: [__address__]
        target_label: __param_target
      - source_labels: [__param_target]
        target_label: instance
      - target_label: __address__
        replacement: 1x.xx.xx.xx:9115  # The blackbox exporter's real hostname:port.
POST截图
查看监听过程
类似于
-
curl http://172.16.10.65:9115/probe?target=prometheus.io&module=http_2xx&debug=true
告警应用测试
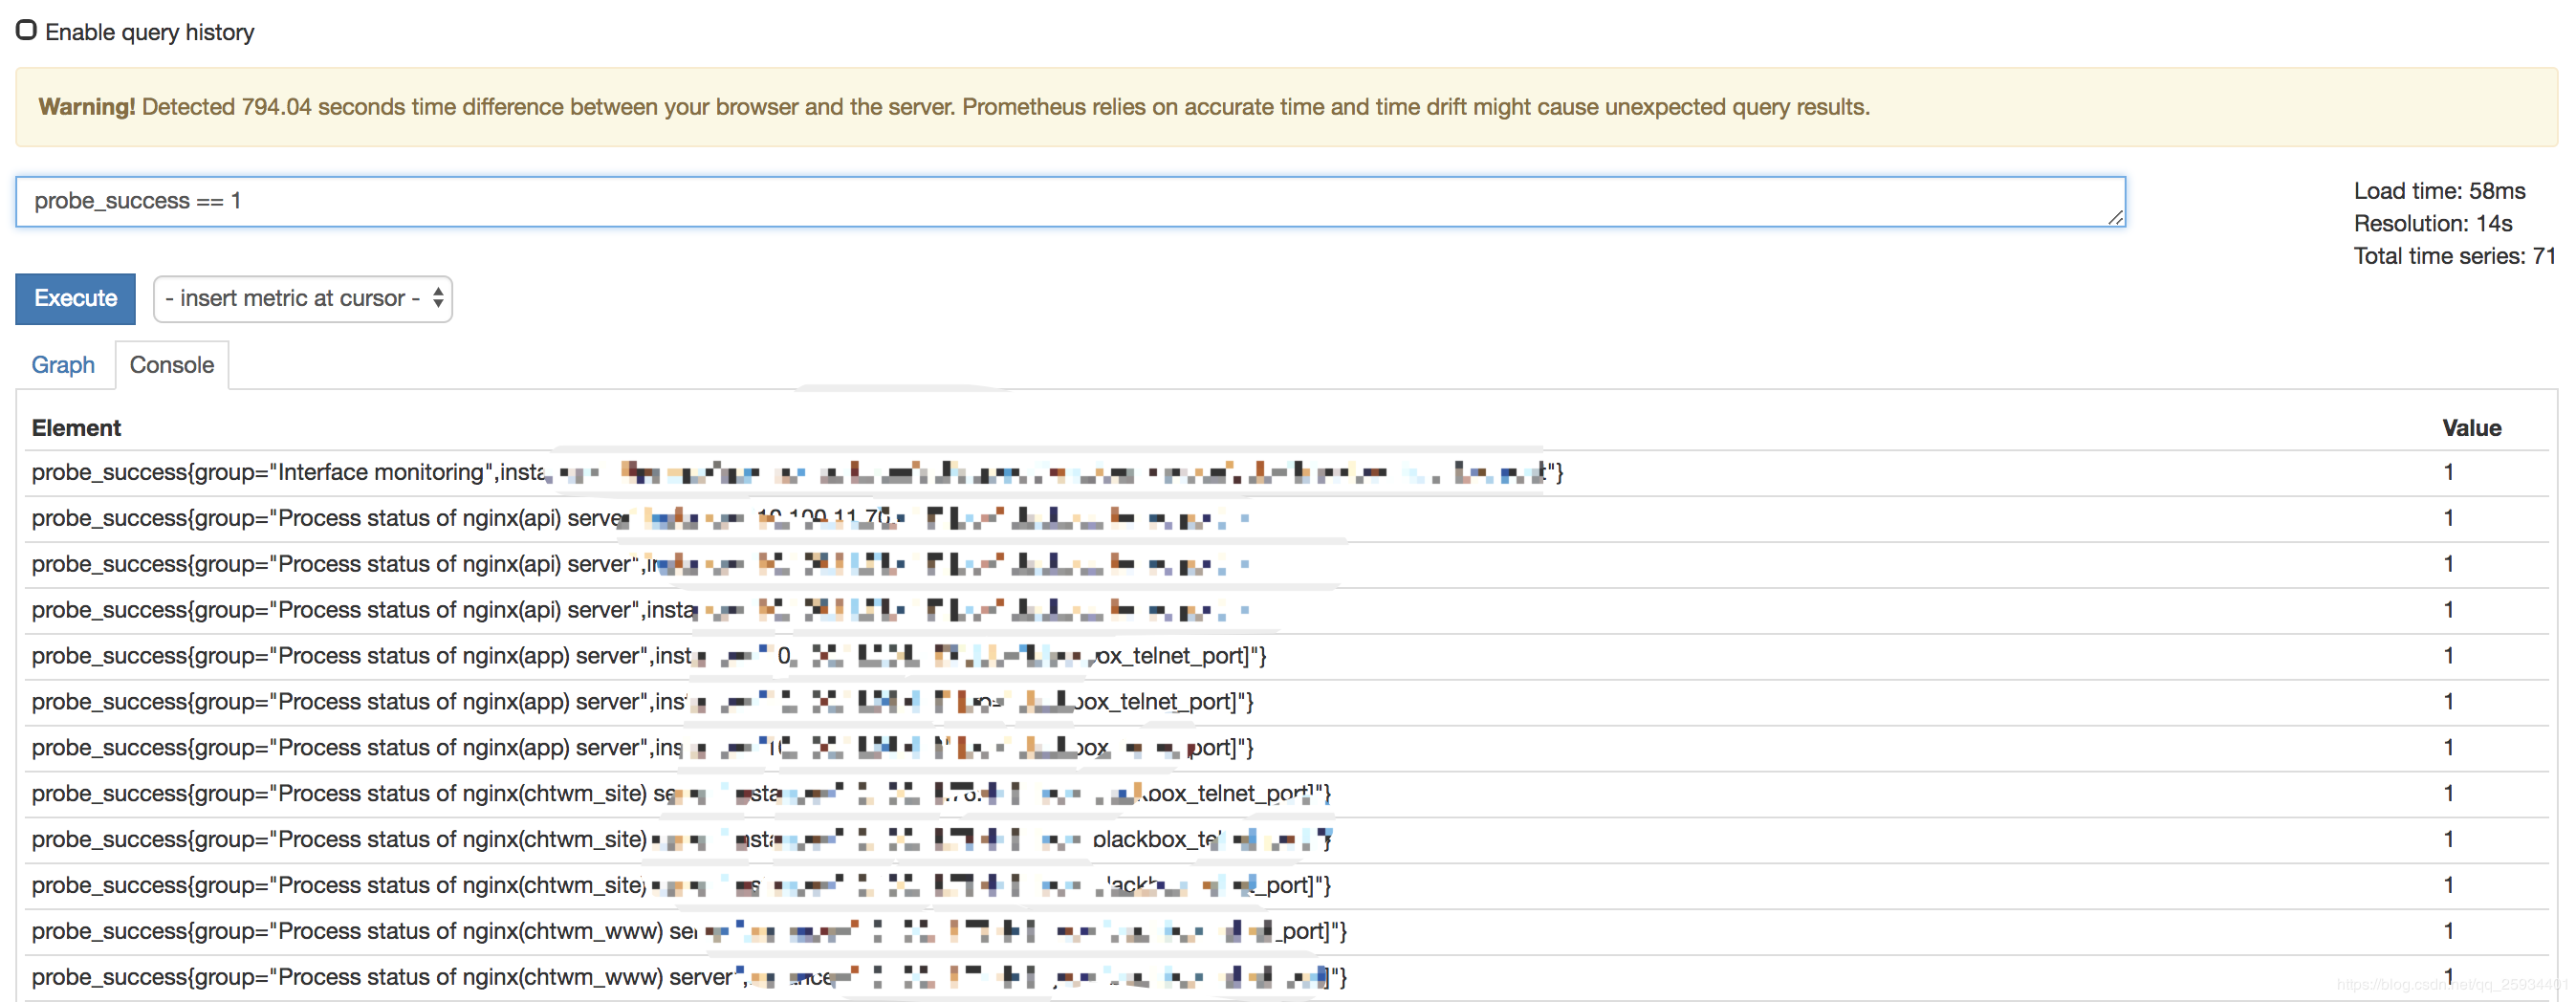
icmp、tcp、http、post 监测是否正常可以观察probe_success 这一指标
probe_success == 0 ##联通性异常
probe_success == 1 ##联通性正常
告警也是判断这个指标是否等于0,如等于0 则触发异常报警 -
[sss@prometheus01 prometheus]$ cat rules/blackbox-alert.rules
groups:
- name: blackbox_network_stats
  rules:
  - alert: blackbox_network_stats
    expr: probe_success == 0
    for: 1m
    labels:
      severity: critical
    annotations:
      summary: "Instance {{ $labels.instance }}  is down"
      description: "This requires immediate action!"
SSL 证书过期时间监测
cat << 'EOF' > prometheus.yml
rule_files:
  - ssl_expiry.rules
scrape_configs:
  - job_name: 'blackbox'
    metrics_path: /probe
    params:
      module: [http_2xx]  # Look for a HTTP 200 response.
    static_configs:
      - targets:
        - example.com  # Target to probe
    relabel_configs:
      - source_labels: [__address__]
        target_label: __param_target
      - source_labels: [__param_target]
        target_label: instance
      - target_label: __address__
        replacement: 127.0.0.1:9115  # Blackbox exporter.
        EOF
cat << 'EOF' > ssl_expiry.rules
groups:
  - name: ssl_expiry.rules
    rules:
      - alert: SSLCertExpiringSoon
        expr: probe_ssl_earliest_cert_expiry{job="blackbox"} - time() < 86400 * 30
        for: 10m
EOF