
代码:
%% ------------------------------------------------------------------------
%% Output Info about this m-file
fprintf('\n***********************************************************\n');
fprintf(' <DSP using MATLAB> Problem 8.43 \n\n');
banner();
%% ------------------------------------------------------------------------
% Digital Highpass Filter Specifications:
wphp = 0.4*pi; % digital passband freq in rad
wshp = 0.3*pi; % digital stopband freq in rad
Rp = 1.0; % passband ripple in dB
As = 40; % stopband attenuation in dB
Ripple = 10 ^ (-Rp/20) % passband ripple in absolute
Attn = 10 ^ (-As/20) % stopband attenuation in absolute
fprintf('\n*******Digital Highpass, Coefficients of DIRECT-form***********\n');
%[bhp, ahp] = butthpf(wphp, wshp, Rp, As)
%[bhp, ahp] = cheb1hpf(wphp, wshp, Rp, As)
%[bhp, ahp] = cheb2hpf(wphp, wshp, Rp, As)
[bhp, ahp] = eliphpf(wphp, wshp, Rp, As);
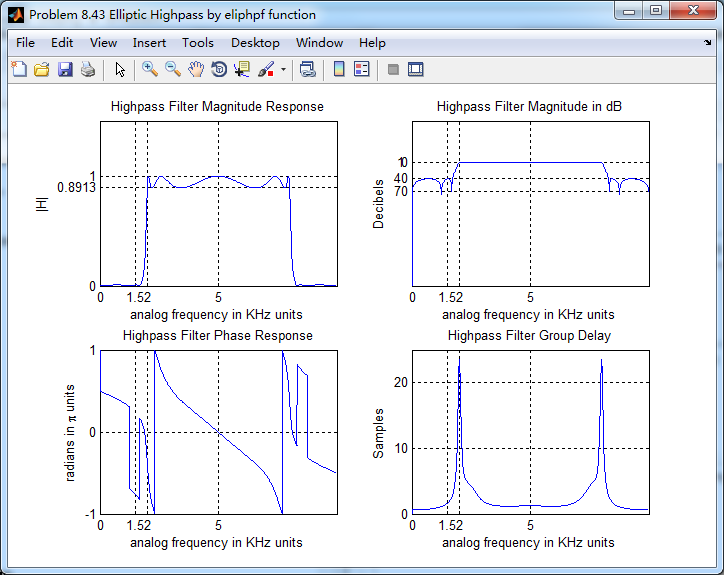
[C, B, A] = dir2cas(bhp, ahp)
% Calculation of Frequency Response:
%[dblp, maglp, phalp, grdlp, wwlp] = freqz_m(blp, alp);
[dbhp, maghp, phahp, grdhp, wwhp] = freqz_m(bhp, ahp);
% ---------------------------------------------------------------
% find Actual Passband Ripple and Min Stopband attenuation
% ---------------------------------------------------------------
delta_w = 2*pi/1000;
Rp_hp = -(min(dbhp(ceil(wphp/delta_w+1):1:501))); % Actual Passband Ripple
fprintf('\nActual Passband Ripple is %.4f dB.\n', Rp_hp);
As_hp = -round(max(dbhp(1:1:ceil(wshp/delta_w)+1))); % Min Stopband attenuation
fprintf('\nMin Stopband attenuation is %.4f dB.\n\n', As_hp);
%% -----------------------------------------------------------------
%% Plot
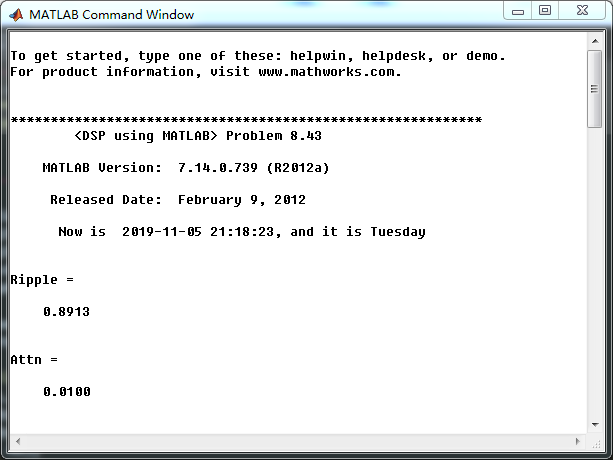
%% overall analog filter over the [0, 5KHz] inteval
%% -----------------------------------------------------------------
figure('NumberTitle', 'off', 'Name', 'Problem 8.43 Elliptic Highpass by eliphpf function')
set(gcf,'Color','white');
M = 1; % Omega max
Fs = 10; % sampling rate of 10 KHz
subplot(2,2,1); plot(wwhp*Fs/(2*pi), maghp); grid on;%axis([0, M, 0, 1.2]);
%xlabel('Digital frequency in \pi units');
xlabel('analog frequency in KHz units');
ylabel('|H|'); title('Highpass Filter Magnitude Response');
set(gca, 'XTickMode', 'manual', 'XTick', [0, 0.3, 0.4, M]*Fs/2);
set(gca, 'YTickMode', 'manual', 'YTick', [0, 0.8913, 1]);
subplot(2,2,2); plot(wwhp*Fs/(2*pi), dbhp); grid on;%axis([0, M, -100, 2]);
%xlabel('Digital frequency in \pi units');
xlabel('analog frequency in KHz units');
ylabel('Decibels'); title('Highpass Filter Magnitude in dB');
set(gca, 'XTickMode', 'manual', 'XTick', [0, 0.3, 0.4, M]*Fs/2);
set(gca, 'YTickMode', 'manual', 'YTick', [-70, -40, -1, 0]);
set(gca,'YTickLabelMode','manual','YTickLabel',['70'; '40';'1 ';' 0']);
subplot(2,2,3); plot(wwhp*Fs/(2*pi), phahp/pi); grid on; %axis([0, M, -1.1, 1.1]);
%xlabel('Digital frequency in \pi nuits');
xlabel('analog frequency in KHz units');
ylabel('radians in \pi units'); title('Highpass Filter Phase Response');
set(gca, 'XTickMode', 'manual', 'XTick', [0, 0.3, 0.4, M]*Fs/2);
set(gca, 'YTickMode', 'manual', 'YTick', [-1:1:1]);
subplot(2,2,4); plot(wwhp*Fs/(2*pi), grdhp); grid on; %axis([0, M, 0, 25]);
%xlabel('Digital frequency in \pi units');
xlabel('analog frequency in KHz units');
ylabel('Samples'); title('Highpass Filter Group Delay');
set(gca, 'XTickMode', 'manual', 'XTick', [0, 0.3, 0.4, M]*Fs/2);
set(gca, 'YTickMode', 'manual', 'YTick', [0:10:25]);
% ----------------------------------------------------------
% Part 2 digital prototype lowpass filter
% ----------------------------------------------------------
% Digital lowpass Filter Specifications:
[wpLP, wsLP, alpha] = hp2lpfre(wphp, wshp);
% Calculation of Elliptic lp filter parameters:
[N, wn] = ellipord(wpLP/pi, wsLP/pi, Rp, As);
fprintf('\n********** Elliptic Filter Order = %3.0f \n', N)
% Digital Elliptic lowpass Filter Design:
[blp, alp] = ellip(N, Rp, As, wn, 'low');
[C, B, A] = dir2cas(blp, alp)
% Calculation of Frequency Response:
[dblp, maglp, phalp, grdlp, wwlp] = freqz_m(blp, alp);
% ---------------------------------------------------------------
% find Actual Passband Ripple and Min Stopband attenuation
% ---------------------------------------------------------------
delta_w = 2*pi/1000;
Rp_lp = -(min(dblp(1:1:ceil(wpLP/delta_w+1)+1))); % Actual Passband Ripple
fprintf('\nActual Passband Ripple is %.4f dB.\n', Rp_lp);
As_lp = -round(max(dblp(ceil(wsLP/delta_w)+1):1:501)); % Min Stopband attenuation
fprintf('\nMin Stopband attenuation is %.4f dB.\n\n', As_lp);
%% -----------------------------------------------------------------
%% Plot
%% -----------------------------------------------------------------
figure('NumberTitle', 'off', 'Name', 'Problem 8.43 Elliptic Prototype Lowpass by ellip function')
set(gcf,'Color','white');
M = 1; % Omega max
subplot(2,2,1); plot(wwlp/pi, maglp); axis([0, M, 0, 1.2]); grid on;
xlabel('Digital frequency in \pi units'); ylabel('|H|');
title('lowpass Filter Magnitude Response');
set(gca, 'XTickMode', 'manual', 'XTick', [0, wpLP, wsLP, pi]/pi);
set(gca, 'YTickMode', 'manual', 'YTick', [0, 0.8913, 1]);
subplot(2,2,2); plot(wwlp/pi, dblp); axis([0, M, -100, 2]); grid on;
xlabel('Digital frequency in \pi units'); ylabel('Decibels');
title('lowpass Filter Magnitude in dB');
set(gca, 'XTickMode', 'manual', 'XTick', [0, wpLP, wsLP, pi]/pi);
set(gca, 'YTickMode', 'manual', 'YTick', [-70, -40, -1, 0]);
set(gca,'YTickLabelMode','manual','YTickLabel',['70'; '40';'1 ';' 0']);
subplot(2,2,3); plot(wwlp/pi, phalp/pi); axis([0, M, -1.1, 1.1]); grid on;
xlabel('Digital frequency in \pi nuits'); ylabel('radians in \pi units');
title('lowpass Filter Phase Response');
set(gca, 'XTickMode', 'manual', 'XTick', [0, wpLP, wsLP, pi]/pi);
set(gca, 'YTickMode', 'manual', 'YTick', [-1:1:1]);
subplot(2,2,4); plot(wwlp/pi, grdlp); axis([0, M, 0, 25]); grid on;
xlabel('Digital frequency in \pi units'); ylabel('Samples');
title('lowpass Filter Group Delay');
set(gca, 'XTickMode', 'manual', 'XTick', [0, wpLP, wsLP, pi]/pi);
set(gca, 'YTickMode', 'manual', 'YTick', [0:5:25]);
% -----------------------------------------------------
% Part 3 ellip function
% -----------------------------------------------------
% Calculation of Elliptic hp filter parameters:
[N, wn] = ellipord(wphp/pi, wshp/pi, Rp, As);
fprintf('\n********** Elliptic Filter Order = %3.0f \n', N)
% Digital Elliptic Highpass Filter Design:
[bhp, ahp] = ellip(N, Rp, As, wn, 'high');
[C, B, A] = dir2cas(bhp, ahp)
% Calculation of Frequency Response:
%[dblp, maglp, phalp, grdlp, wwlp] = freqz_m(blp, alp);
[dbhp, maghp, phahp, grdhp, wwhp] = freqz_m(bhp, ahp);
% ---------------------------------------------------------------
% find Actual Passband Ripple and Min Stopband attenuation
% ---------------------------------------------------------------
delta_w = 2*pi/1000;
Rp_hp = -(min(dbhp(ceil(wphp/delta_w+1):1:501))); % Actual Passband Ripple
fprintf('\nActual Passband Ripple is %.4f dB.\n', Rp_hp);
As_hp = -round(max(dbhp(1:1:ceil(wshp/delta_w)+1))); % Min Stopband attenuation
fprintf('\nMin Stopband attenuation is %.4f dB.\n\n', As_hp);
%% -----------------------------------------------------------------
%% Plot
%% -----------------------------------------------------------------
figure('NumberTitle', 'off', 'Name', 'Problem 8.43 Elliptic Highpass by ellip function')
set(gcf,'Color','white');
M = 1; % Omega max
subplot(2,2,1); plot(wwhp/pi, maghp); axis([0, M, 0, 1.2]); grid on;
xlabel('Digital frequency in \pi units'); ylabel('|H|'); title('Highpass Filter Magnitude Response');
set(gca, 'XTickMode', 'manual', 'XTick', [0, 0.3, 0.4, M]);
set(gca, 'YTickMode', 'manual', 'YTick', [0, 0.8913, 1]);
subplot(2,2,2); plot(wwhp/pi, dbhp); axis([0, M, -100, 2]); grid on;
xlabel('Digital frequency in \pi units'); ylabel('Decibels'); title('Highpass Filter Magnitude in dB');
set(gca, 'XTickMode', 'manual', 'XTick', [0, 0.3, 0.4, M]);
set(gca, 'YTickMode', 'manual', 'YTick', [-70, -40, -1, 0]);
set(gca,'YTickLabelMode','manual','YTickLabel',['70'; '40';'1 ';' 0']);
subplot(2,2,3); plot(wwhp/pi, phahp/pi); axis([0, M, -1.1, 1.1]); grid on;
xlabel('Digital frequency in \pi nuits'); ylabel('radians in \pi units'); title('Highpass Filter Phase Response');
set(gca, 'XTickMode', 'manual', 'XTick', [0, 0.3, 0.4, M]);
set(gca, 'YTickMode', 'manual', 'YTick', [-1:1:1]);
subplot(2,2,4); plot(wwhp/pi, grdhp); axis([0, M, 0, 25]); grid on;
xlabel('Digital frequency in \pi units'); ylabel('Samples'); title('Highpass Filter Group Delay');
set(gca, 'XTickMode', 'manual', 'XTick', [0, 0.3, 0.4, M]);
set(gca, 'YTickMode', 'manual', 'YTick', [0:5:25]);
运行结果:
通带、阻带设计指标,绝对值单位
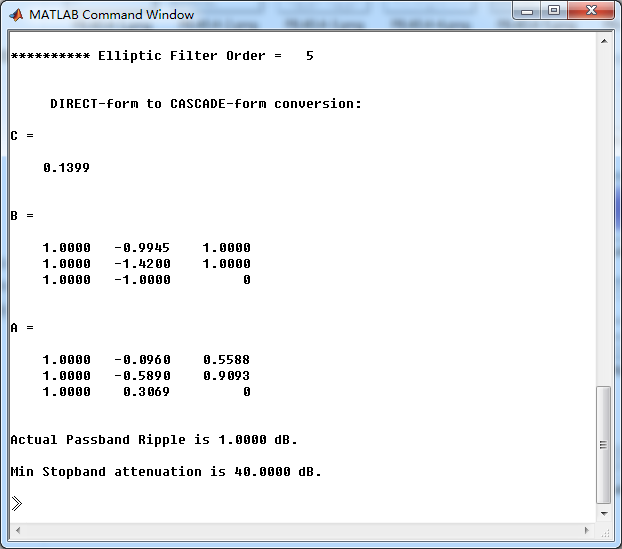
Elliptic型数字高通,滤波器系统函数串联形式的系数如下,阶数是5阶

采用eliphpf函数,设计的Elliptic型数字高通,幅度谱、相位谱和群延迟响应
扫描二维码关注公众号,回复:
7813102 查看本文章

第2小题,要画出数字低通原型的幅度谱。
Elliptic型数字低通滤波器,系统函数串联形式系数如下

采用ellip函数(MATLAB工具箱函数),设计的Elliptic型数字高通滤波器,系统函数串联形式系数如下,
幅度谱、相位谱和群延迟响应如下
