##########
https://www.cnblogs.com/keithtt/p/8542987.html
zabbix使用percona插件监控mysql
1、添加percona仓库。
# yum install -y https://mirrors.tuna.tsinghua.edu.cn/percona/yum/percona-release-latest.noarch.rpm2、安装插件。
# yum -y install percona-zabbix-templates
# rpm -ql percona-zabbix-templates
/var/lib/zabbix/percona
/var/lib/zabbix/percona/scripts
/var/lib/zabbix/percona/scripts/get_mysql_stats_wrapper.sh /var/lib/zabbix/percona/scripts/ss_get_mysql_stats.php /var/lib/zabbix/percona/templates /var/lib/zabbix/percona/templates/userparameter_percona_mysql.conf /var/lib/zabbix/percona/templates/zabbix_agent_template_percona_mysql_server_ht_2.0.9-sver1.1.8.xml
3、这个项目是php写的,需要安装php和php-mysql。(这个在官网有说明)
# yum install -y php php-mysql4、拷贝配置文件到配置目录,并重启zabbix-agent。
# cp -a /var/lib/zabbix/percona/templates/userparameter_percona_mysql.conf /etc/zabbix/zabbix_agentd.d/
# rm -f /etc/zabbix/zabbix_agentd.d/userparameter_mysql.conf
# service zabbix-agent restart
5、授权监控用户,使其能获取数据。
# mysql -uroot -p
> grant all privileges on *.* to zabbix@localhost identified by 'PASS'; > flush privileges; > quit;
6、修改程序里面的用户密码,使其能连接到mysql。
# vim /var/lib/zabbix/percona/scripts/ss_get_mysql_stats.php
$mysql_user = 'zabbix'; $mysql_pass = 'PASS';
7、修改监控脚本。脚本里面是直接执行mysql命令获取数据的,但是没有指定用户名和密码,导致连不上数据库。为mysql命令加上用户名密码参数即可。
# vim /var/lib/zabbix/percona/scripts/get_mysql_stats_wrapper.sh
RES=`HOME=~zabbix mysql -uzabbix -pPASS -e 'SHOW SLAVE STATUS\G' 2> /dev/null | egrep '(Slave_IO_Running|Slave_SQL_Running):' | awk -F: '{print $2}' | tr '\n' ','`
或者更简单一点,直接添加一个mysql的客户端验证配置。
# vim ~zabbix/.my.cnf
[client]
user = zabbix
password = PASS
8、测试脚本是否能获取到数据。
# /var/lib/zabbix/percona/scripts/get_mysql_stats_wrapper.sh gg
16
# /var/lib/zabbix/percona/scripts/get_mysql_stats_wrapper.sh jg
0
# sudo -u zabbix -H /var/lib/zabbix/percona/scripts/get_mysql_stats_wrapper.sh running-slave 1 # sudo -u zabbix zabbix_get -s 10.0.1.61 -k 'proc.num[mysqld]' 1 # sudo -u zabbix zabbix_get -s 10.0.1.61 -k 'mysql.ping' 1
9、导入模板。在这里踩到坑,安装包提供的插件版本是1.1.8,导入过程中报错。经过一番查询,可以使用1.1.6。
可以从这里下载1.1.6版本的文件:https://www.percona.com/downloads/percona-monitoring-plugins/
按理说,导入模板之后,链接到主机就可以查看到数据了。不过,等了很久一直没数据,又是经过一番查询...
插件创建了一个状态文件,然后从中读取数据,但是这个文件第一次启动的时候所属用户是root,而zabbix的启动用户是zabbix,没有权限读取这个文件,所以页面上一直没有数据。
解决办法很简单,删除这个文件即可,程序会自动创建一个权限正确的新文件。
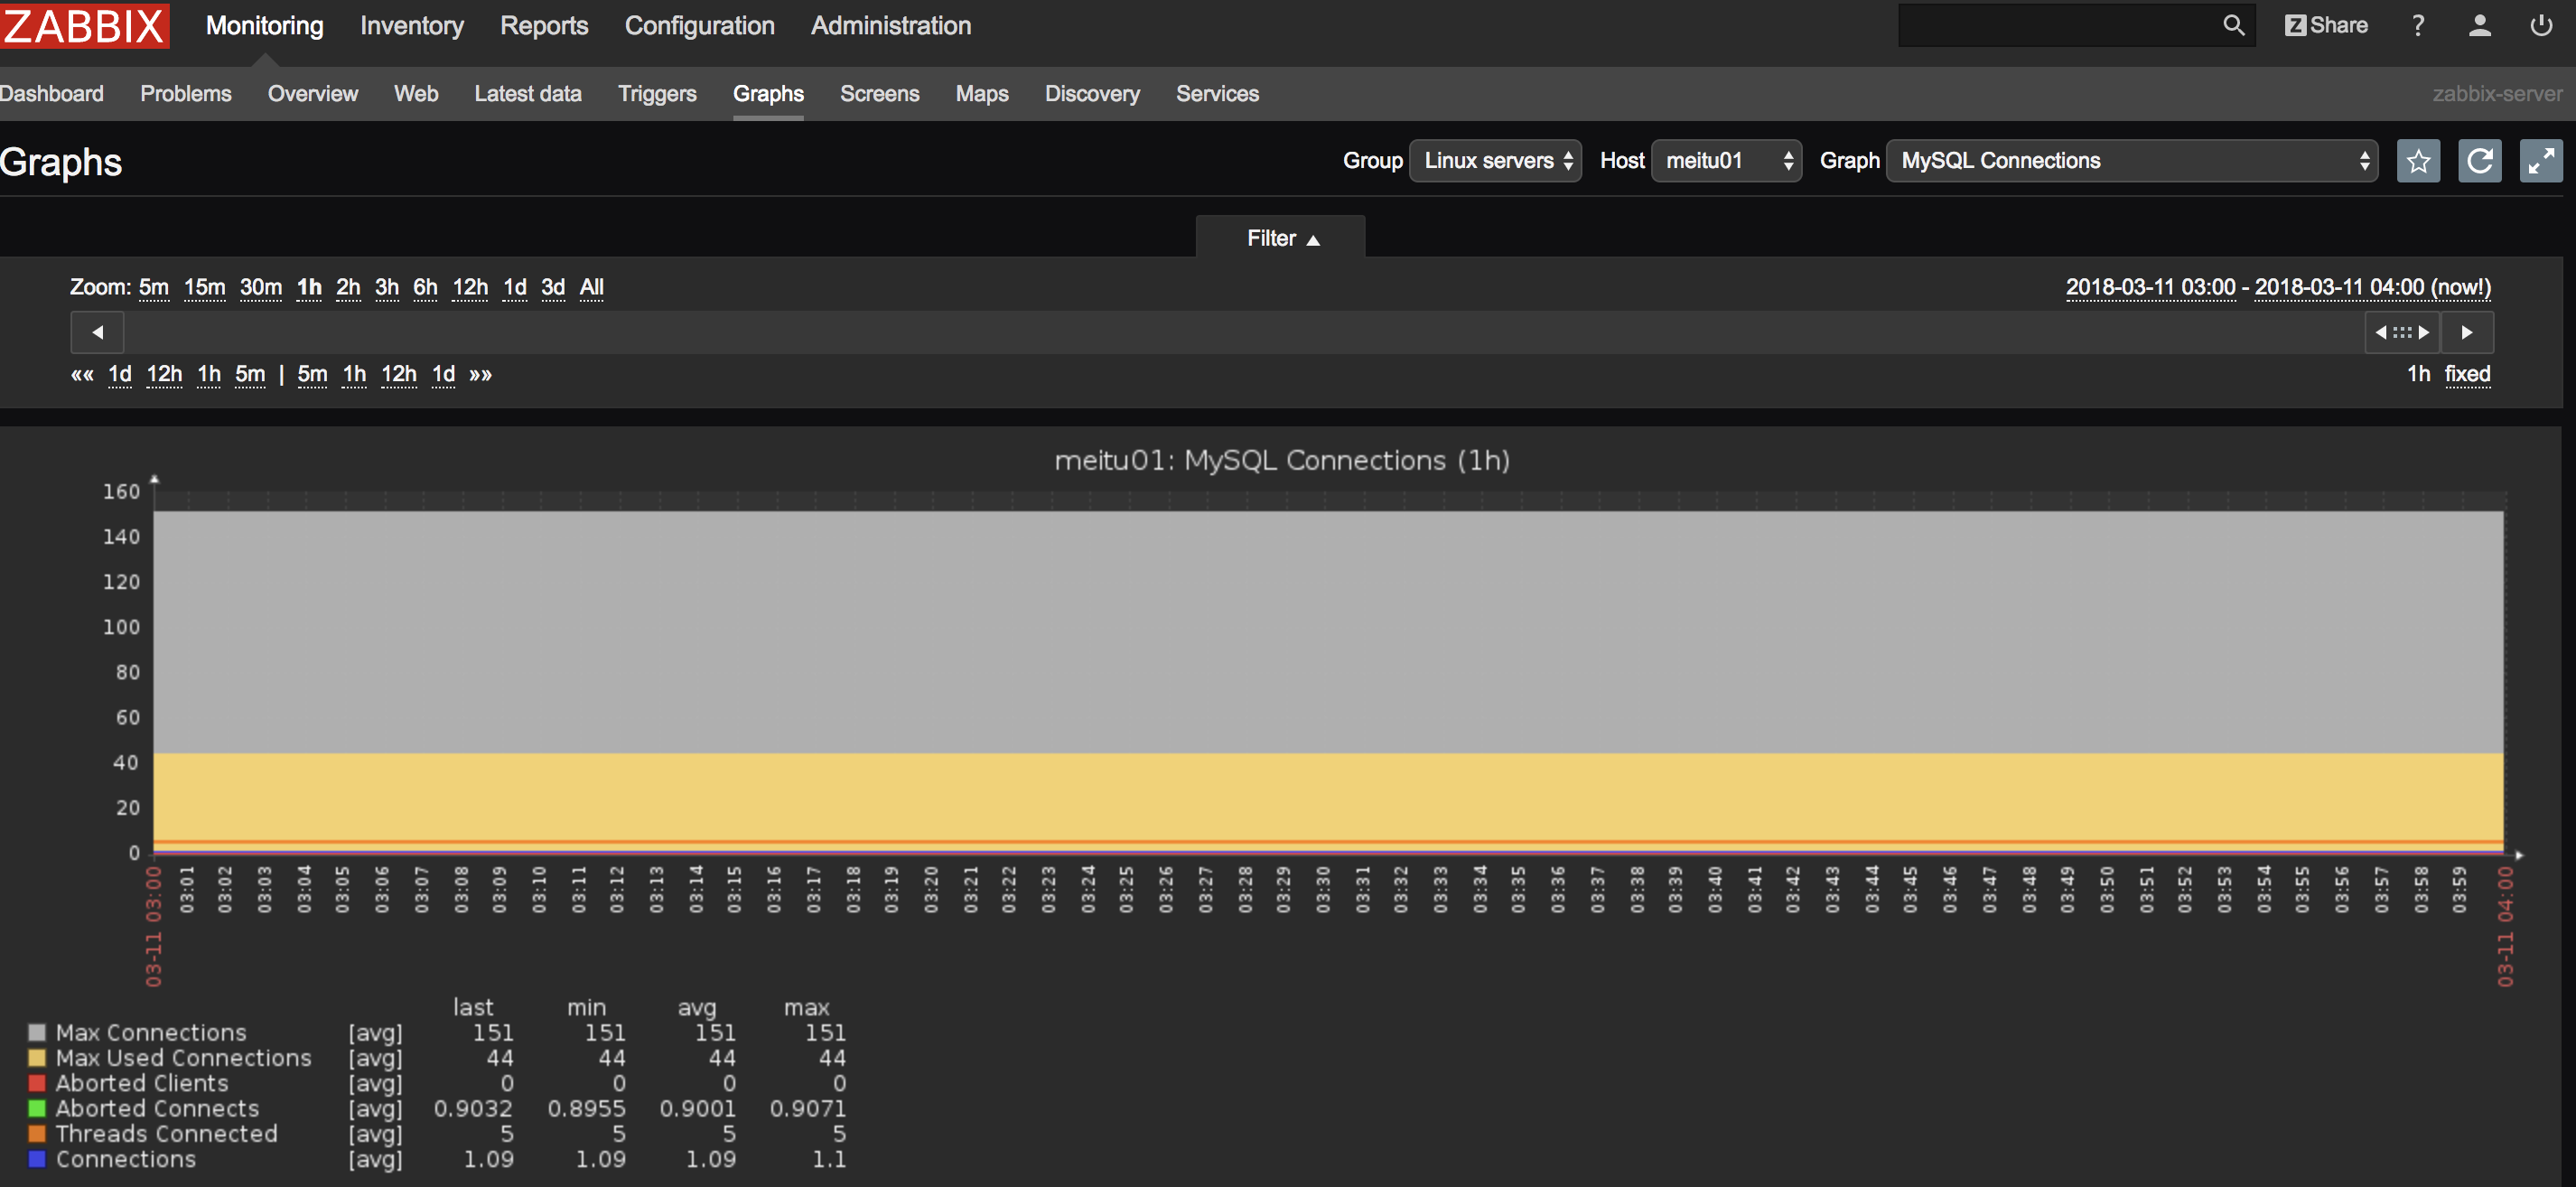
# rm -f /tmp/localhost-mysql_cacti_stats.txt10、到这里就可以看到数据了。
补充:
如果把默认端口3306改成了别的端口,也会造成报错读取不到数据。
在/var/lib/zabbix/percona/scripts目录下有两个脚本,经过仔细查看,发现get_mysql_stats_wrapper.sh在指定读取的状态文件时路径是写的是CACHEFILE="/tmp/$HOST-mysql_cacti_stats.txt",而在/tmp/目录下是一个带端口的文件localhost-mysql_cacti_stats.txt:3310,这样肯定就读不到了。然后去找文件是在哪里生成的,查看另一个php脚本,果然做了判断处理,端口不是3306的话就在文件名后面加上端口号。
问题找到了,将源码中的判断部分去掉就好了。
# vim /var/lib/zabbix/percona/scripts/ss_get_mysql_stats.php
$cache_file = "$cache_dir/$sanitized_host-mysql_cacti_stats.txt" . ($port != 3306 ? ":$port" : ''); 改成: $cache_file = "$cache_dir/$sanitized_host-mysql_cacti_stats.txt";
参考:
https://www.percona.com/doc/percona-monitoring-plugins/LATEST/zabbix/index.html
https://blog.csdn.net/liang_operations/article/details/81868668
############
https://blog.csdn.net/u011731378/article/details/79092259
-
Dear All,
All of my Windows hosts (Windows Server 2008 R2 & Windows Server 2012) both have no zabbix_agentd.log file at all. I don't know why. Below is configuration of one host:
# This is a config file for Zabbix Agent (Windows)
# To get more information about Zabbix, go to http://www.zabbix.com
############ GENERAL PARAMETERS #################
### Option: LogFile
# Name of log file.
# If not set, Windows Event Log is used.
#
# Mandatory: no
# Default:
# LogFile=
LogFile=C:\Program Files\Zabbix Agent\Zabbix_agentd.log
### Option: LogFileSize
# Maximum size of log file in MB.
# 0 - disable automatic log rotation.
#
# Mandatory: no
# Range: 0-1024
# Default:
# LogFileSize=1
### Option: DebugLevel
# Specifies debug level
# 0 - no debug
# 1 - critical information
# 2 - error information
# 3 - warnings
# 4 - for debugging (produces lots of information)
#
# Mandatory: no
# Range: 0-4
# Default:
# DebugLevel=3
DebugLevel=0
### Option: SourceIP
# Source IP address for outgoing connections.
#
# Mandatory: no
# Default:
# SourceIP=
### Option: EnableRemoteCommands
# Whether remote commands from Zabbix server are allowed.
# 0 - not allowed
# 1 - allowed
#
# Mandatory: no
# Default:
EnableRemoteCommands=1
### Option: LogRemoteCommands
# Enable logging of executed shell commands as warnings.
# 0 - disabled
# 1 - enabled
#
# Mandatory: no
# Default:
# LogRemoteCommands=0
##### Passive checks related
### Option: Server
# List of comma delimited IP addresses (or hostnames) of Zabbix servers.
# Incoming connections will be accepted only from the hosts listed here.
# No spaces allowed.
# If IPv6 support is enabled then '127.0.0.1', '::127.0.0.1', '::ffff:127.0.0.1' are treated equally.
#
# Mandatory: no
# Default:
# Server=
Server=10.10.20.85
### Option: ListenPort
# Agent will listen on this port for connections from the server.
#
# Mandatory: no
# Range: 1024-32767
# Default:
ListenPort=10050
### Option: ListenIP
# List of comma delimited IP addresses that the agent should listen on.
# First IP address is sent to Zabbix server if connecting to it to retrieve list of active checks.
#
# Mandatory: no
# Default:
# ListenIP=0.0.0.0
### Option: StartAgents
# Number of pre-forked instances of zabbix_agentd that process passive checks.
# If set to 0, disables passive checks and the agent will not listen on any TCP port.
#
# Mandatory: no
# Range: 0-100
# Default:
# StartAgents=3
##### Active checks related
### Option: ServerActive
# List of comma delimited IP ort (or hostname
ort) pairs of Zabbix servers for active checks.
ort (or hostname
ort) pairs of Zabbix servers for active checks.
# If port is not specified, default port is used.
# IPv6 addresses must be enclosed in square brackets if port for that host is specified.
# If port is not specified, square brackets for IPv6 addresses are optional.
# If this parameter is not specified, active checks are disabled.
# Example: ServerActive=127.0.0.1:20051,zabbix.domain,[::1]:30051,::1,[12fc::1]
#
# Mandatory: no
# Default:
# ServerActive=
ServerActive=127.0.0.1
### Option: Hostname
# Unique, case sensitive hostname.
# Required for active checks and must match hostname as configured on the server.
# Value is acquired from HostnameItem if undefined.
#
# Mandatory: no
# Default:
Hostname=NI-HOST01
### Option: HostnameItem
# Item used for generating Hostname if it is undefined.
# Ignored if Hostname is defined.
#
# Mandatory: no
# Default:
# HostnameItem=system.hostname
### Option: RefreshActiveChecks
# How often list of active checks is refreshed, in seconds.
#
# Mandatory: no
# Range: 60-3600
# Default:
# RefreshActiveChecks=120
### Option: BufferSend
# Do not keep data longer than N seconds in buffer.
#
# Mandatory: no
# Range: 1-3600
# Default:
# BufferSend=5
### Option: BufferSize
# Maximum number of values in a memory buffer. The agent will send
# all collected data to Zabbix server or Proxy if the buffer is full.
#
# Mandatory: no
# Range: 2-65535
# Default:
# BufferSize=100
### Option: MaxLinesPerSecond
# Maximum number of new lines the agent will send per second to Zabbix Server
# or Proxy processing 'log', 'logrt' and 'eventlog' active checks.
# The provided value will be overridden by the parameter 'maxlines',
# provided in 'log', 'logrt' or 'eventlog' item keys.
#
# Mandatory: no
# Range: 1-1000
# Default:
# MaxLinesPerSecond=100
############ ADVANCED PARAMETERS #################
### Option: Alias
# Sets an alias for parameter. It can be useful to substitute long and complex parameter name with a smaller and simpler one.
# For example, if you wish to retrieve paging file usage in percents from the server,
# you may use parameter "perf_counter[\Paging File(_Total)\% Usage]", or you may define an alias by adding the following line to configuration file
# Alias = pg_usageerf_counter[\Paging File(_Total)\% Usage]
# After that you can use parameter name "pg_usage" to retrieve the same information.
# You can specify as many "Alias" records as you wish.
# Aliases cannot be used for parameters defined in "PerfCounter" configuration file records.
#
# Mandatory: no
# Range:
# Default:
### Option: Timeout
# Spend no more than Timeout seconds on processing
#
# Mandatory: no
# Range: 1-30
# Default:
# Timeout=3
### Option: PerfCounter
# Syntax: <parameter_name>,"<perf_counter_path>",<period>
# Defines new parameter <parameter_name> which is an average value for system performance counter <perf_counter_path> for the specified time period <period> (in seconds).
# For example, if you wish to receive average number of processor interrupts per second for last minute, you can define new parameter "interrupts" as following:
# PerfCounter = interrupts,"\Processor(0)\Interrupts/sec",60
# Please note double quotes around performance counter path.
# Samples for calculating average value will be taken every second.
# You may run "typeperf -qx" to get list of all performance counters available in Windows.
#
# Mandatory: no
# Range:
# Default:
### Option: Include
# You may include individual files in the configuration file.
#
# Mandatory: no
# Default:
# Include=
# Include=c:\zabbix\zabbix_agentd.userparams.conf
# Include=c:\zabbix\zabbix_agentd\
####### USER-DEFINED MONITORED PARAMETERS #######
### Option: UnsafeUserParameters
# Allow all characters to be passed in arguments to user-defined parameters.
# 0 - do not allow
# 1 - allow
#
# Mandatory: no
# Range: 0-1
# Default:
# UnsafeUserParameters=0
### Option: UserParameter
# User-defined parameter to monitor. There can be several user-defined parameters.
# Format: UserParameter=<key>,<shell command>
# Note that shell command must not return empty string or EOL only.
# Example: UserParameter=system.test,echo 1
#UserParameter=system.test,echo 1 -
Believe it or not, Zabbix is case sensitive, even on Windows. So your log directory and file name: C:\Program Files\Zabbix Agent\Zabbix_agentd.log need to be cased appropriately.
I don't know if that is your issue or not, but I ran into that when I was first starting out with Zabbix.
And you have DebugLevel=0 Put that at 3 and you will start seeing a log, I suspect.Last edited by tchjts1; 18-06-2013, 07:27. -
Thanks. The problem is solved with set value for parameter DebugLevelOriginally posted by tchjts1 View Post

1、添加percona仓库。
# yum install -y https://mirrors.tuna.tsinghua.edu.cn/percona/yum/percona-release-latest.noarch.rpm2、安装插件。
# yum -y install percona-zabbix-templates
# rpm -ql percona-zabbix-templates
/var/lib/zabbix/percona
/var/lib/zabbix/percona/scripts
/var/lib/zabbix/percona/scripts/get_mysql_stats_wrapper.sh /var/lib/zabbix/percona/scripts/ss_get_mysql_stats.php /var/lib/zabbix/percona/templates /var/lib/zabbix/percona/templates/userparameter_percona_mysql.conf /var/lib/zabbix/percona/templates/zabbix_agent_template_percona_mysql_server_ht_2.0.9-sver1.1.8.xml
3、这个项目是php写的,需要安装php和php-mysql。(这个在官网有说明)
# yum install -y php php-mysql4、拷贝配置文件到配置目录,并重启zabbix-agent。
# cp -a /var/lib/zabbix/percona/templates/userparameter_percona_mysql.conf /etc/zabbix/zabbix_agentd.d/
# rm -f /etc/zabbix/zabbix_agentd.d/userparameter_mysql.conf
# service zabbix-agent restart
5、授权监控用户,使其能获取数据。
# mysql -uroot -p
> grant all privileges on *.* to zabbix@localhost identified by 'PASS'; > flush privileges; > quit;
6、修改程序里面的用户密码,使其能连接到mysql。
# vim /var/lib/zabbix/percona/scripts/ss_get_mysql_stats.php
$mysql_user = 'zabbix'; $mysql_pass = 'PASS';
7、修改监控脚本。脚本里面是直接执行mysql命令获取数据的,但是没有指定用户名和密码,导致连不上数据库。为mysql命令加上用户名密码参数即可。
# vim /var/lib/zabbix/percona/scripts/get_mysql_stats_wrapper.sh
RES=`HOME=~zabbix mysql -uzabbix -pPASS -e 'SHOW SLAVE STATUS\G' 2> /dev/null | egrep '(Slave_IO_Running|Slave_SQL_Running):' | awk -F: '{print $2}' | tr '\n' ','`
或者更简单一点,直接添加一个mysql的客户端验证配置。
# vim ~zabbix/.my.cnf
[client]
user = zabbix
password = PASS
8、测试脚本是否能获取到数据。
# /var/lib/zabbix/percona/scripts/get_mysql_stats_wrapper.sh gg
16
# /var/lib/zabbix/percona/scripts/get_mysql_stats_wrapper.sh jg
0
# sudo -u zabbix -H /var/lib/zabbix/percona/scripts/get_mysql_stats_wrapper.sh running-slave 1 # sudo -u zabbix zabbix_get -s 10.0.1.61 -k 'proc.num[mysqld]' 1 # sudo -u zabbix zabbix_get -s 10.0.1.61 -k 'mysql.ping' 1
9、导入模板。在这里踩到坑,安装包提供的插件版本是1.1.8,导入过程中报错。经过一番查询,可以使用1.1.6。
可以从这里下载1.1.6版本的文件:https://www.percona.com/downloads/percona-monitoring-plugins/
按理说,导入模板之后,链接到主机就可以查看到数据了。不过,等了很久一直没数据,又是经过一番查询...
插件创建了一个状态文件,然后从中读取数据,但是这个文件第一次启动的时候所属用户是root,而zabbix的启动用户是zabbix,没有权限读取这个文件,所以页面上一直没有数据。
解决办法很简单,删除这个文件即可,程序会自动创建一个权限正确的新文件。
# rm -f /tmp/localhost-mysql_cacti_stats.txt10、到这里就可以看到数据了。
补充:
如果把默认端口3306改成了别的端口,也会造成报错读取不到数据。
在/var/lib/zabbix/percona/scripts目录下有两个脚本,经过仔细查看,发现get_mysql_stats_wrapper.sh在指定读取的状态文件时路径是写的是CACHEFILE="/tmp/$HOST-mysql_cacti_stats.txt",而在/tmp/目录下是一个带端口的文件localhost-mysql_cacti_stats.txt:3310,这样肯定就读不到了。然后去找文件是在哪里生成的,查看另一个php脚本,果然做了判断处理,端口不是3306的话就在文件名后面加上端口号。
问题找到了,将源码中的判断部分去掉就好了。
# vim /var/lib/zabbix/percona/scripts/ss_get_mysql_stats.php
$cache_file = "$cache_dir/$sanitized_host-mysql_cacti_stats.txt" . ($port != 3306 ? ":$port" : ''); 改成: $cache_file = "$cache_dir/$sanitized_host-mysql_cacti_stats.txt";
参考:
https://www.percona.com/doc/percona-monitoring-plugins/LATEST/zabbix/index.html
https://blog.csdn.net/liang_operations/article/details/81868668