[原创]VSCode debug jest的配置

      重拾JS的路从修改JS源码开始,修改JS源码从源码自带的test code开始。源码的test code使用了jtest框架,从test code刚好可以看到要修改部分的 多种传值方式,以及函数输出结构。修改源码后,顺便修改jtest的snapshot, 刚好又可以重新利用test code,进行验证自己的修改是否达到预期,白盒测试十分轻巧方便!

      第一步,debug jest code, 我使用了VSCode做编辑器,要修改的js源码比较复杂,有多个工程,每个工程有自己的package.json, babelrc, yarn.lock,总之包管理很复杂。。我修改的部分只是其中一个工程,主要是debug这个工程下的jest文件。用习惯了ideal里本地debug Java的方式,希望在VSCode里也能这样去debug。(不是专业前端开始,在浏览器里进行大型debug用着不顺手)。

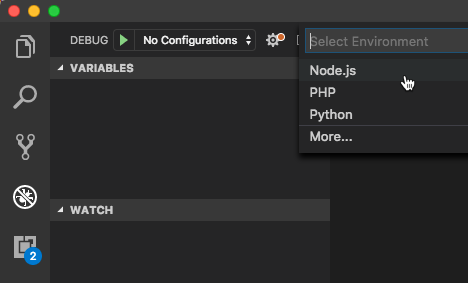
  要能debug, 主要需要在VSCode里创建launch.json文件,方法如下:(截图来自VSCode官网)在VSCode里打开工程目录,选择左侧工具栏的debug图标,然后在debug面板上选择小齿轮图标。

 VSCode会自动探测你的debug环境,如果探测失败的话,需要手工选择。

 至此,在你的工程目录下,就会自动生成launch.json文件,位于.vscode文件夹下,因为我们要调试jest文件,所以launch.json中的内容需要修改为jest的,(参考jest官网给的配置),下面是我的launch.json。

{
// Use IntelliSense to learn about possible attributes.
// Hover to view descriptions of existing attributes.
// For more information, visit: https://go.microsoft.com/fwlink/?linkid=830387
"version": "0.2.0",
"configurations": [
{
"name": "Debug Jest Tests",
"type": "node",
"request": "launch",
"runtimeArgs": [
"--inspect-brk",
"${workspaceRoot}/node_modules/jest/bin/jest.js",
"--runInBand"
],
//"sourceMaps": true,
"trace": true,
"console": "integratedTerminal",
"internalConsoleOptions": "neverOpen",
"port": 9229
}
]
}
 
到此,就可以在VSCode里debug jest了,选择你要debug的jest文件,右键选择debug jest即可。
 

参考链接:

https://code.visualstudio.com/docs/editor/debugging

https://jestjs.io/docs/en/troubleshooting.html#debugging-in-vs-code

扫描二维码关注公众号,回复: 7751500 查看本文章

https://blog.csdn.net/qq_17371033/article/details/79503136 

猜你喜欢

转载自www.cnblogs.com/sanmuqingliang/p/11797470.html
今日推荐