概述
HikariCP提供了一些监控指标,他的监控指标都是基于MicroMeter提供出来的,然后支持Prometheus和Dropwizard。本次我们将讨论一下HikariCp的监控指标有哪些,为什么提供这些指标,以及咱们如何去做监控。
监控指标
就像com.zaxxer.hikari.metrics.PoolStats提供的那样,几个重要的指标都存储在poolState中。
totalConnections
总连接数,包括空闲的连接和使用中的连接。idleConnections 空闲连接数
activeConnections
活跃连接数
totalConnections = activeConnection + idleConnections
pendingThreads
正在等待连接的线程数量。排查性能问题时,这个指标是一个重要的参考指标,如果正在等待连接的线程在相当一段时间内数量较多,可以考虑扩大数据库连接池的size。(即HikariCP的maxPoolSize)maxConnections
最大连接数,统计指标,统计到目前为止连接的最大数量。minConnections
最小连接数,统计指标,统计到目前为止连接的最小数量。usageTime
每个连接使用的时间,当连接被回收的时候会记录此指标:com.zaxxer.hikari.pool.HikariPool#recycleacquireTime
获取每个连接需要等待时间,一个请求获取数据库连接后或者因为超时失败后,会记录此指标。connectionCreateTime
连接创建时间
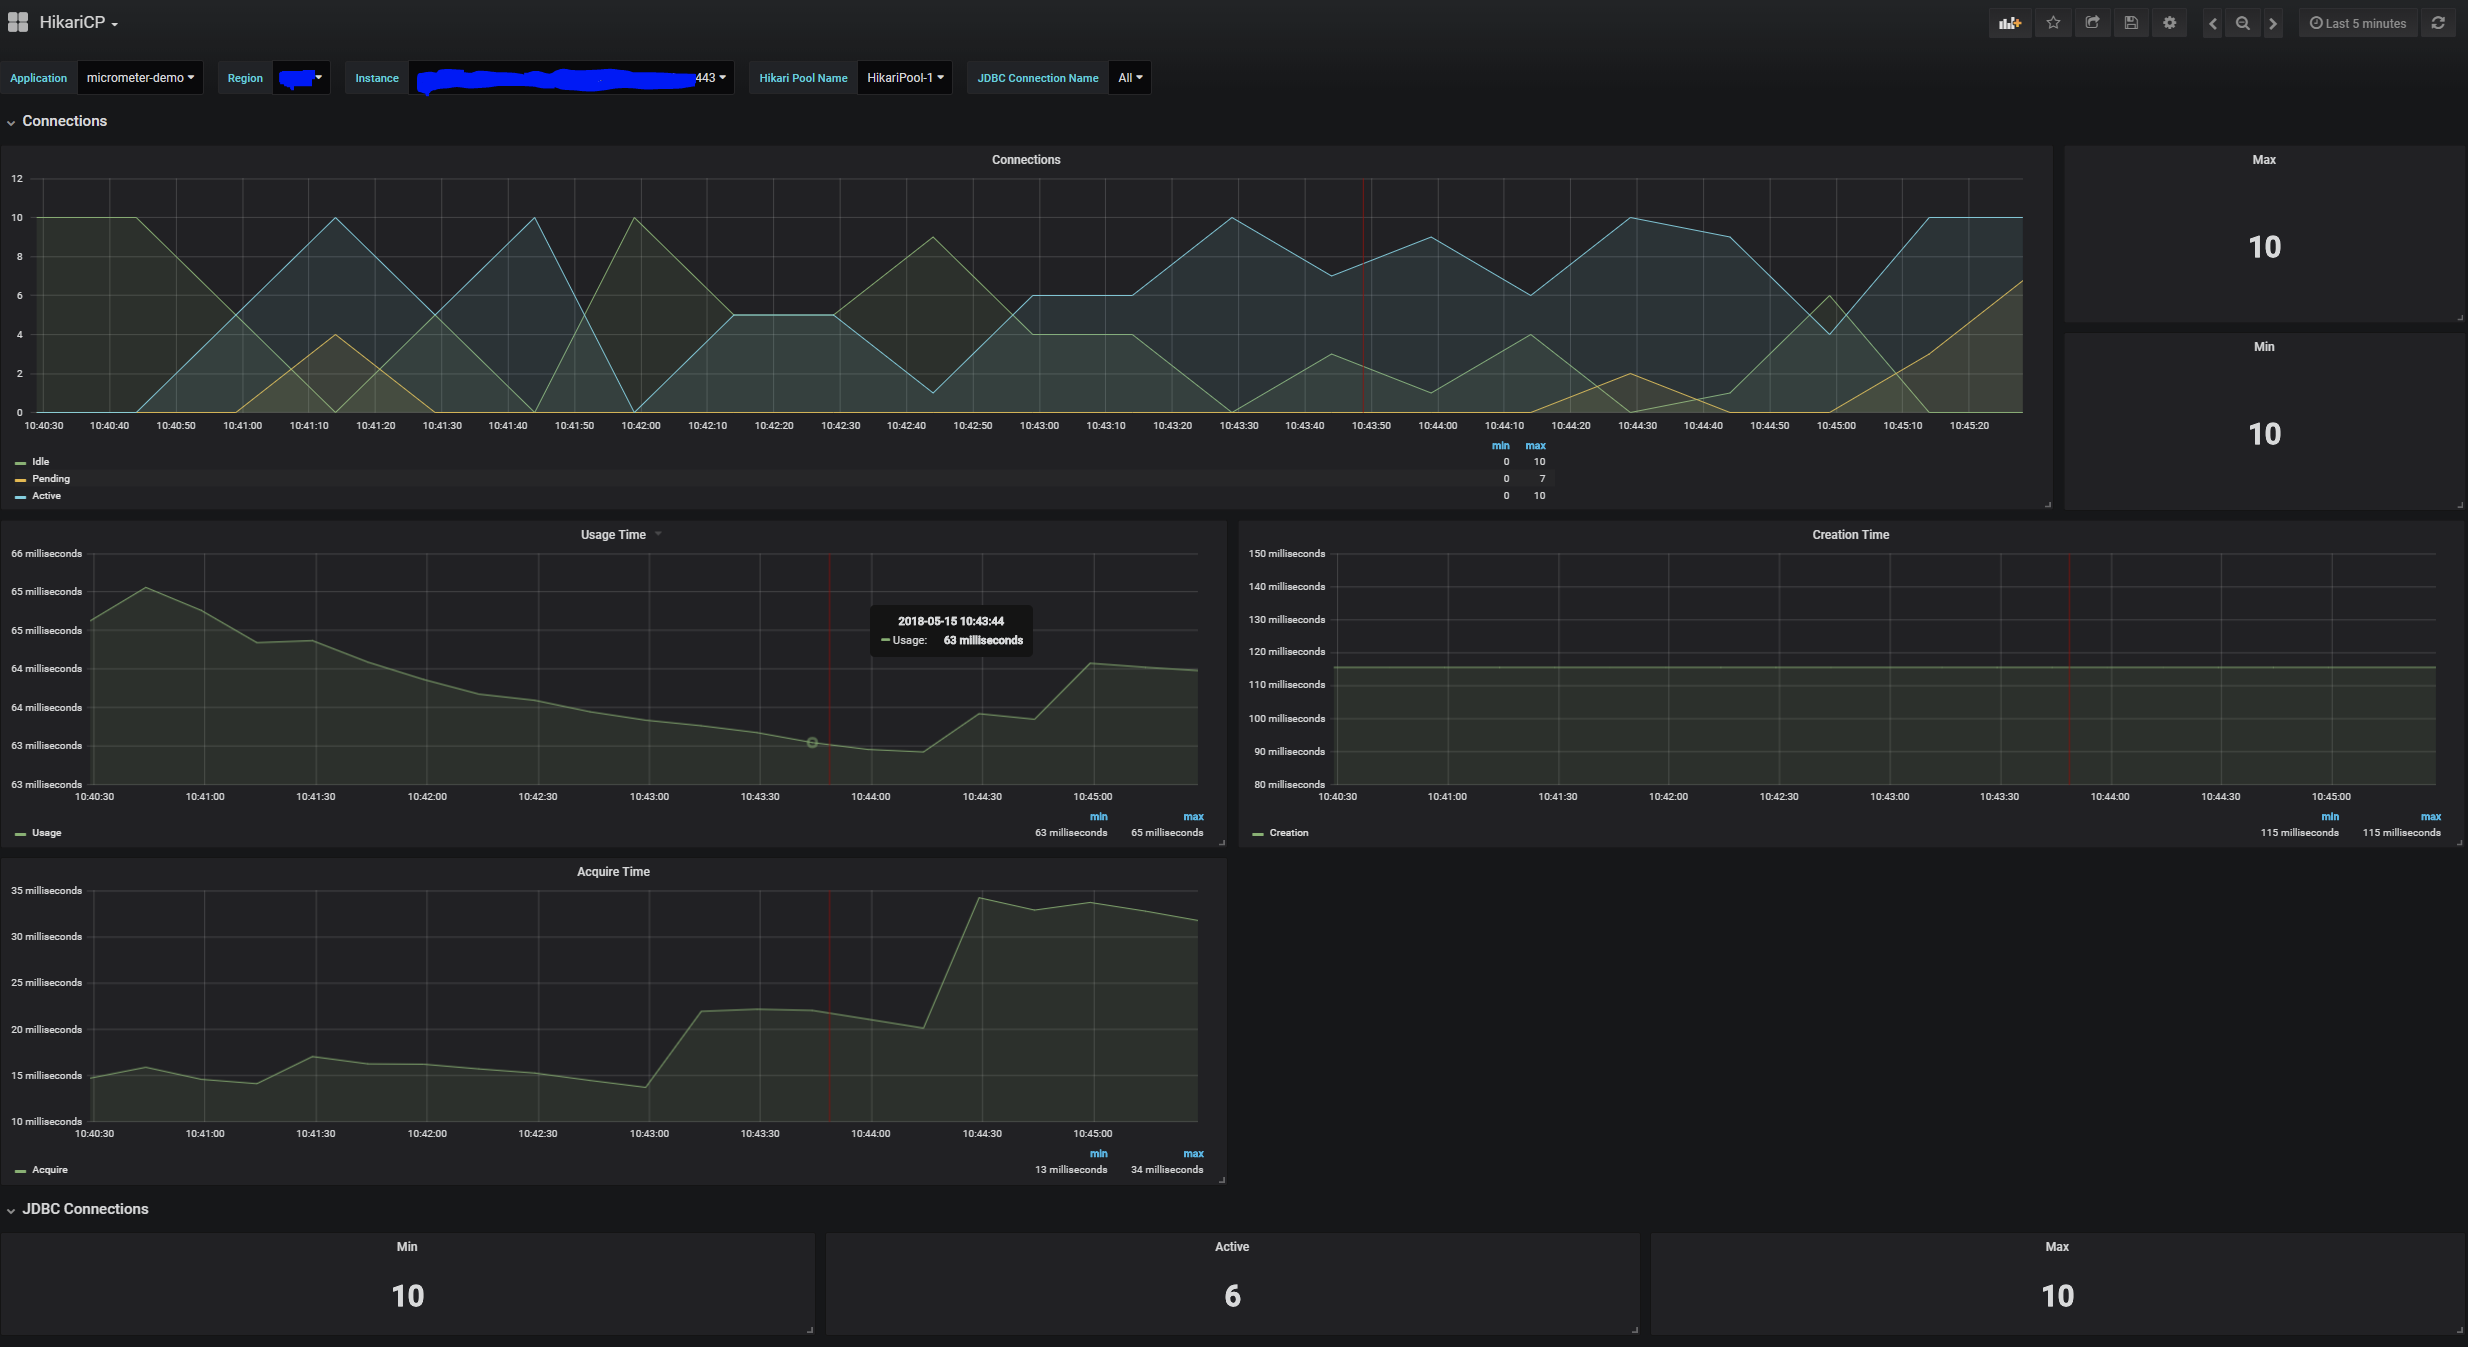
如何监控
这里拿我们比较熟悉的SpringBoot项目为例,同时使用prometheus和grafana,项目中加入promethues的依赖:
    implementation 'org.springframework.boot:spring-boot-starter-actuator'
    implementation 'io.micrometer:micrometer-registry-prometheus:1.3.0'
同时在SpringBoot项目的application.properties配置文件中加入以下参数:
management.endpoints.web.exposure.include=prometheus 暴露prometheus格式化的指标,这样可以被promethues服务器抓取接下来我们需要启动一个prometheus的服务,https://prometheus.io/download/ 然后更改下peometheus服务的默认配置再启动,追加配置如下:
  - job_name: 'prometheus-test' # job名称
    scrape_interval: 5s # 抓取时间间隔,这里每5s像数据源请求一次
    metrics_path: '/actuator/prometheus'
    static_configs:
- targets: ['127.0.0.1:8080'] # 这里是springBoot项目的地址接着启动一个grafana的服务,https://grafana.com/get 启动后添加prometheus数据源,制作仪表盘等。
扩展知识
Micrometer
Vendor-neutral application metrics facade(与供应商无关的应用程序指标外观)。我们可以把它类比于日志框架中的slf4j。把promethues类比于logback。应用程序直接依赖Micrometer来暴露指标。Micrometer比较受欢迎,已经作为SpringBoot2.0内置的指标门面库。Dropwizard
一个Java框架,类似于SpringBoot,但国内使用较少。其中有提供metrics相关的功能。Prometheus
一个监控器的实现,基于pull模型,定时像prometheus数据源拉取指标信息。做分析、处理和展示。