背景信息
最近在重新看一些关于windows 性能的书籍,对于我这样一个原来使用SCOM监控的懒人来说,Zabbix 上自带的windows OS template 的模板实在是不够用,因为之前SCOM监控包(微软出的,把所有工作都做了,我只需要按需启用规则和告警即可)。
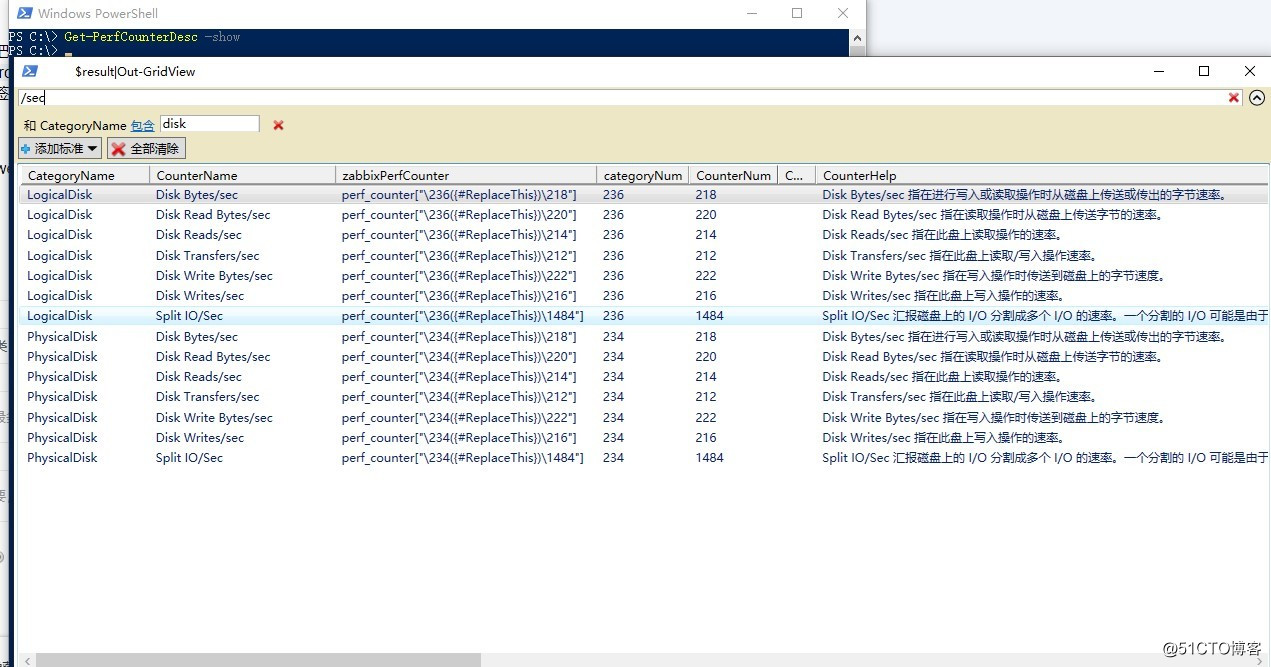
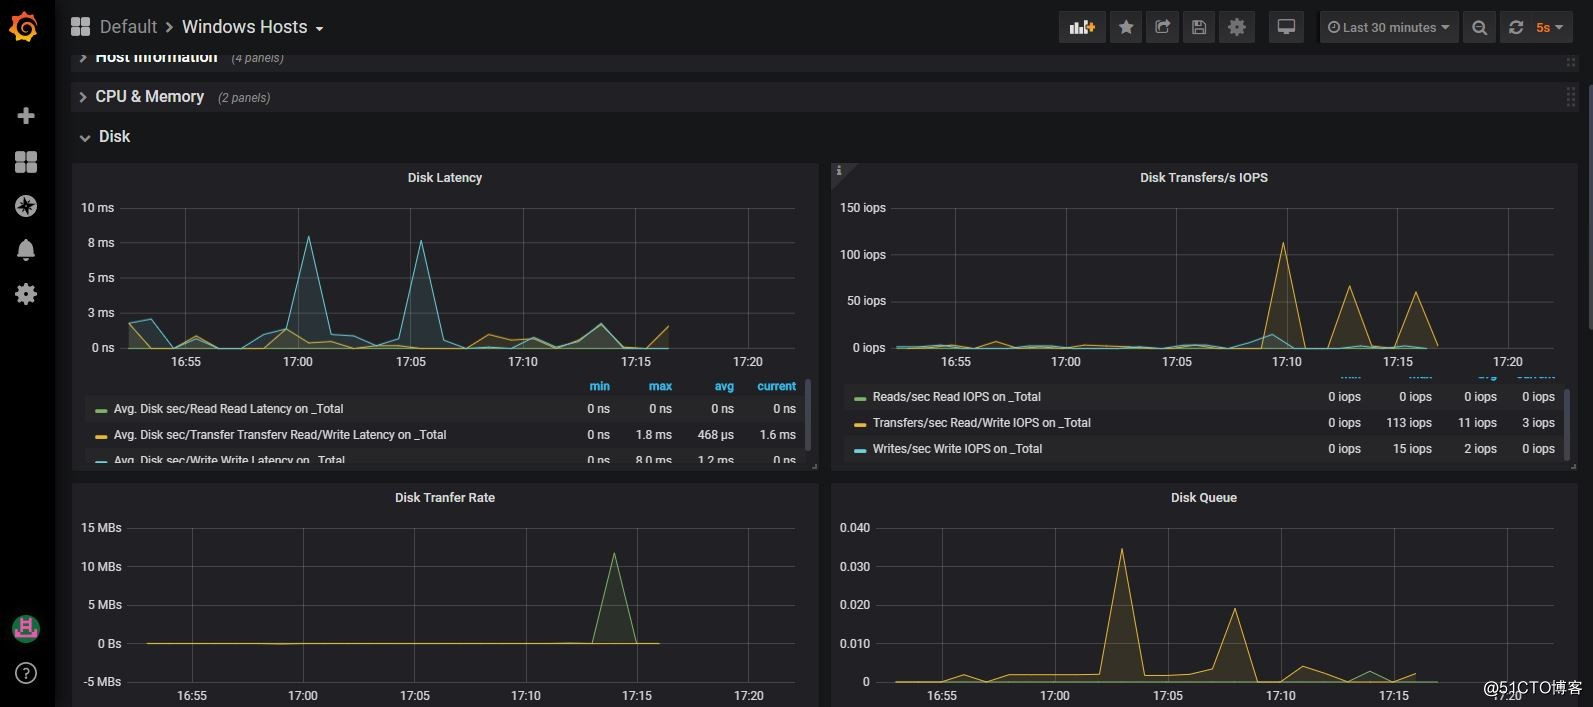
默认的Zabbix 性能数据只有Avg Latency,平均的数据也不准,想看下磁盘的Latency以及IOPS要自己动手,看了下zabbix 中windows performance Counter 的语法,我略有退缩了。全是用数字表示的性能计数器的CounterCategory 以及 CounterName。
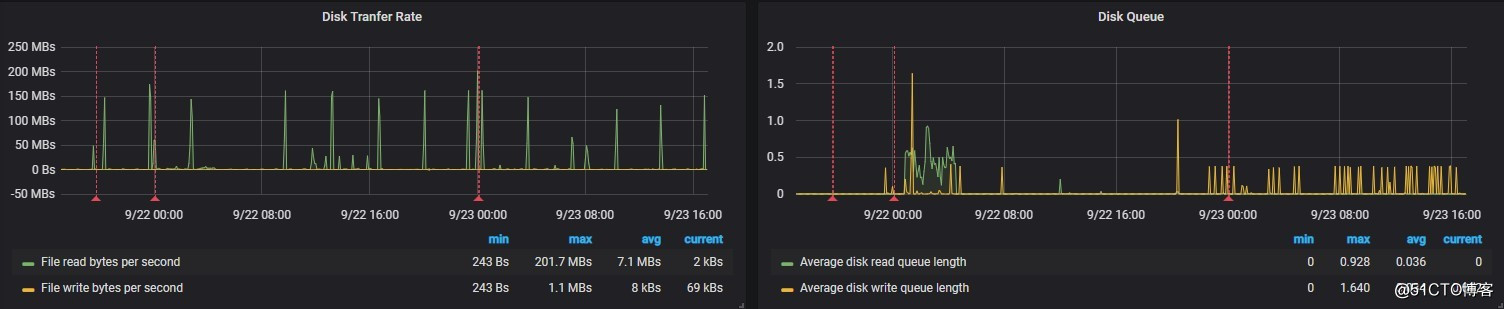
自带磁盘相关的统计只有传输速度,以及平均延迟。
如果要监控其他的性能计数器,它们的名称是什么,作用是什么?能否有个清单可以快速搜索?
操刀解决
好在powershell 书写比较顺手,写了下面一个函数,整合了zabbix 的性能计数器的语法。
function Get-PerfCounterDesc{
    [cmdletbinding()]
    param(
        [switch]$show
    )

    $Categories = [System.Diagnostics.PerformanceCounterCategory]::GetCategories()
    $SingleInstanceCategories = $Categories | Where-Object {$_.CategoryType -eq "SingleInstance"}
    $MultiInstanceCategories =  $Categories| Where-Object {$_.CategoryType -eq "MultiInstance"}

    $SingleInstanceCounters = $SingleInstanceCategories | ForEach-Object {
        (new-object System.Diagnostics.PerformanceCounterCategory($_.CategoryName)).GetCounters()
    }
    $MultiInstanceCounters = $MultiInstanceCategories | ForEach-Object {
        $category=new-object System.Diagnostics.PerformanceCounterCategory($_.CategoryName)
        if($category.InstanceExists('_Total')){
            $category.GetCounters('_Total')
        }elseif($category.InstanceExists('Total')){
            $category.GetCounters('Total')
        }else{
            $instanceNames=$category.GetInstanceNames()
            if($instanceNames.count -gt 0){
                $category.GetCounters($instanceNames[0])
            }
        }
    }

    $AllCounters = $MultiInstanceCounters + $SingleInstanceCounters
    $key="HKLM:\SOFTWARE\Microsoft\Windows NT\CurrentVersion\Perflib\009"

    $counters=Get-ItemPropertyValue -Path $key -Name "counter"
    $Dict=@{}

    for ($i=0;$i -lt $counters.count;$i=$i+2){
        if($counters[$i+1] -and -not $Dict.ContainsKey($counters[$i+1])){
            $Dict.add($counters[$i+1],$counters[$i])
        }
    }
    Write-Debug $dict.keys.count
    $result=$AllCounters | Sort-Object Categoryname,Countername|
            Select-Object CategoryName,
            Countername,
            @{n="zabbixPerfCounter";e={'perf_counter["\{0}({{#ReplaceThis}})\{1}"]' -f $dict[$_.CategoryName],$dict[$_.Countername]}},
            @{n="categoryNum";e={$Dict[$_.CategoryName]}},
            @{n="CounterNum";e={$Dict[$_.Countername]}},
            CategoryHelp,
            CounterHelp

    if($show){
        $result|Out-GridView
    }else{
        $result
    }
}
怎么用呢?把上面函数直接加到个人的powershell 配置文件,也就是在powershell 控制台notepad $profile ,把内容粘贴进去,然后保存,然后设置set-executionpolicy remotesigned以让自定义非签名的脚本可以运行。
新起一个powershell ,直接敲Get-PerfCounterDesc -show, 可以对结果进行各种过滤。其中zabbixPerfCounter 列,就是生成的zabbix 上使用的key,其中的{#replaceThis} 请替换成计数器的实例名称。比如_total.
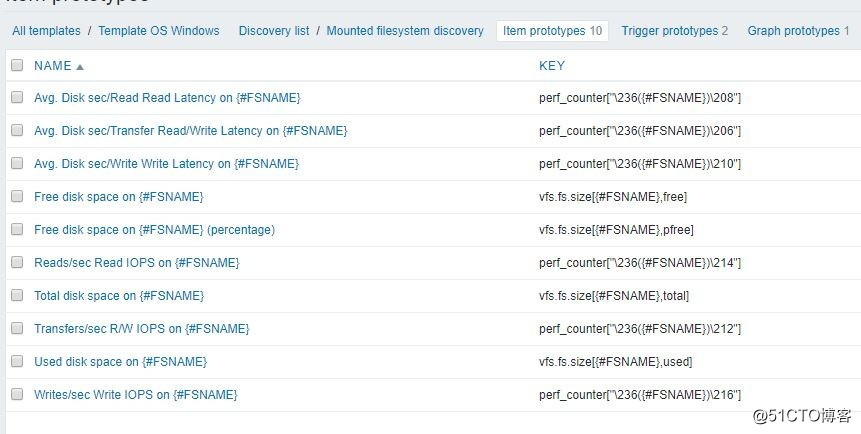
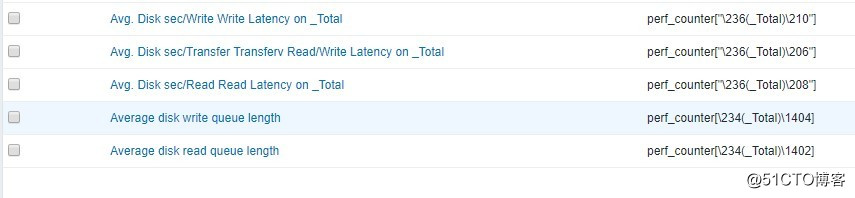
然后我在zabbix 模板中加入了下面的计数器来显示磁盘IOPS 以及Latency
item prototype
items
还需要对应更改Grafana
## 附带资源及参考