Linux Top command
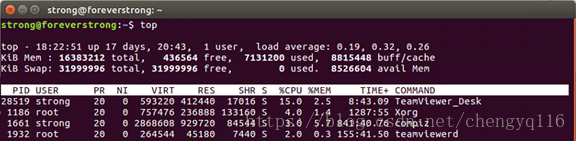
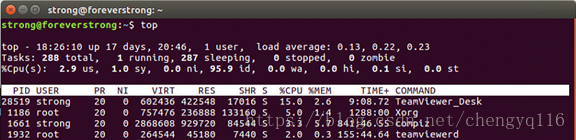
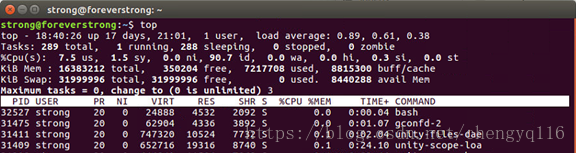
top 命令是 Linux 下常用的性能分析工具,能够实时显示系统中各个进程的资源占用状况,常用于服务端性能分析。To view the top CPU consuming processes use the top command. To start top, type top (shown below) in a terminal window. The top command then displays a text screen listing the current processes, arranged in the order of CPU usage, along with various other information, such as memory and swap-space usage.
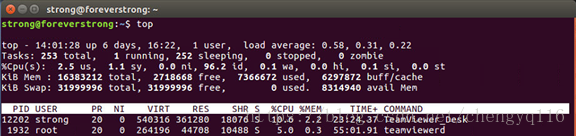
统计信息:前 5 行是系统整体的统计信息。
进程信息:统计信息下方表格区域显示的是各个进程的详细信息,默认 5 秒刷新一次。
The first line shows the current time, how long the system has been up, how many users are logged in, and three load averages - the average number of processes ready to run during the last 1, 5, and 15 minutes.
第 1 行:top - 任务队列信息 (系统运行状态及平均负载),与 uptime 命令结果相同。
第 1 段:系统当前时间,例如:14:01:28。
第 2 段:系统运行时间,未重启的时间,时间越长,系统越稳定。格式:up xx days, HH:MM,例如:6 days, 16:22, 表示连续运行了 6 天 16 小时 22 分钟。
第 3 段:当前登录用户数,例如:1 user,表示当前只有 1 个用户登录。
第 4 段:系统负载,即任务队列的平均长度,3 个数值分别统计最近 1,5,15 分钟的系统平均负载。
系统平均负载:单核 CPU 情况下,0.00 表示没有任何负荷,1.00 表示刚好满负荷,超过 1 则表示超负荷,理想值是0.7。
多核 CPU 负载:CPU 核数 * 理想值 0.7 = 理想负荷,例如:4 核 CPU 负载不超过 2.8 表示没有出现高负载。
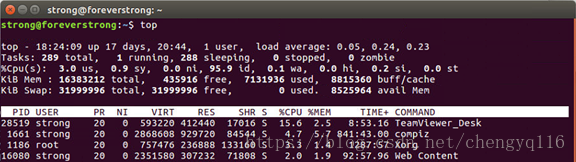
The second line lists the total number of processes and the status of these processes.
第 2 行:Tasks - 进程相关信息。
第 1 段:进程总数,例如:Tasks: 253 total,表示总共运行 253 个进程。
第 2 段:正在运行的进程数,例如:1 running。
第 3 段:睡眠的进程数,例如:252 sleeping。
第 4 段:停止的进程数,例如:0 stopped。
第 5 段:僵尸进程数,例如:0 zombie。
The third line shows CPU usage - what percentage of CPU time is used by user processes, what percentage by system (kernel) processes, and during what percentage of time the CPU is idle.
user,us
system,sy
idle,id
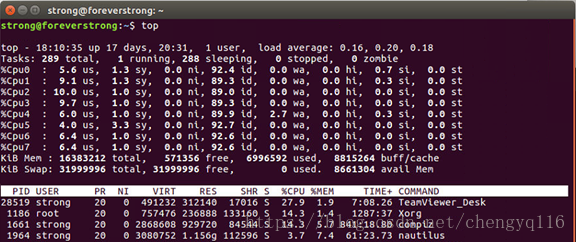
第 3 行:%Cpu(s) - CPU相关信息。
如果是多核 CPU,按数字 1 可显示各核 CPU 信息,此时 1 行将转为 Cpu 核数行,数字 1 可以来回切换。
第 1 段:us - 用户空间占用 CPU 百分比,例如:%Cpu(s): 2.5 % us。
第 2 段:sy - 内核空间占用 CPU 百分比,例如:1.1% sy。
第 3 段:ni - 用户进程空间内改变过优先级的进程占用 CPU 百分比,例如:0.0% ni。
第 4 段:id - 空闲 CPU 百分比,例如:96.2% id。
第 5 段:wa - 等待输入输出的 CPU 时间百分比,例如:0.1% wa。
第 6 段:hi - CPU服务于硬件中断所耗费的时间总额,例如:0.0% hi。
第 7 段:si - CPU服务软中断所耗费的时间总额,例如:0.1% si。
第 8 段:st - steal time 虚拟机被 hypervisor 偷去的 CPU 时间 (如果当前处于一个 hypervisor 下的 VM,实际上hypervisor 也是要消耗一部分 CPU 处理时间的)。
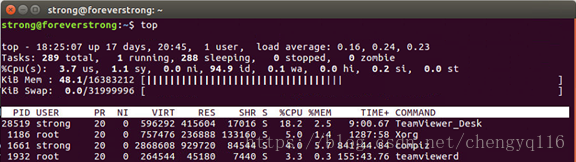
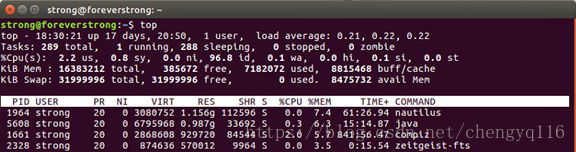
The fourth line shows how the physical memory is being used - the total amount, how much is used, how much is free, and how much is allocated to buffers (for reading from the hard drive, for example).
第 4 行:KiB Mem - 内存相关信息。
第 1 段:物理内存总量,例如:16383212 total。
第 2 段:空闲内存总量,例如:2718668 free。
第 3 段:使用的物理内存总量,例如:7366672 used。
第 4 段:用作内核缓存的内存量,例如:6297872 buff/cache。
The fifth line shows how the virtual memory (or swap space) is being used - the total amount of swap space, how much is used, how much is free, and how much is being cached.
第 5 行:KiB Swap - 交换分区相关信息。
第 1 段:交换区总量,例如:31999996 total。
第 2 段:空闲交换区总量,例如:31999996 free。
第 3 段:使用的交换区总量,例如:0 used。
第 4 段:缓冲的交换区总量,例如:8314940 avail Mem。
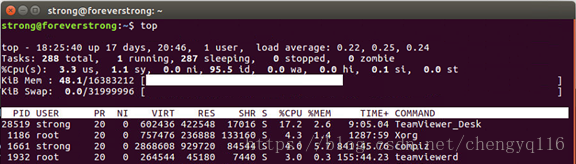
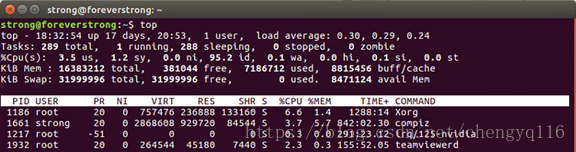
PID - The process ID of the process
USER - Username under which the process is running
PR - Priority of the process
NI - Nice value of the process - the value ranges from -20 (highest priority) to 19 (lowest priority) and the default is 0. (The nice value represents the relative priority of the process: the higher the value the lower the priority and the nicer the process - because it yields to other processes.)
VIRT - The total amount of virtual memory used by the process, in kilobytes
RES - Total physical memory used by a task (typically shown in kilobytes, but an m suffix indicates megabytes)
SHR - Amount of shared memory used by process
S - State of the process (S for sleeping, D for uninterruptible sleep, R for running, Z for zombies - processes that should be dead but are still running - or T for stopped)
%CPU - Percentage of CPU time used since last screen update
%MEM - Percentage of physical memory used by the process
TIME+ - Total CPU time the process has used since it started
COMMAND - Shortened form of the command that started the process
PID = (Process Id) 进程Id。
USER = (Effective User Name) 进程所有者的用户名。
PR = (Priority) 优先级。
NI = (Nice Value) Nice 值。负值表示高优先级,正值表示低优先级。
VIRT = (Virtual Image (KiB)) 进程使用的虚拟内存总量,单位 KiB。VIRT = SWAP + RES。
RES = (Resident Size (KiB)) 进程使用的未被换出的物理内存大小,单位 KiB。RES = CODE + DATA。
SHR = (Shared Memory (KiB)) 共享内存大小,单位 KiB。
S = (Process Status) 进程状态。D = 不可中断的睡眠状态,R = 运行,S = 睡眠,T = 跟踪/停止,Z = 僵尸进程。
%CPU = (CPU Usage) 上次更新到现在的 CPU 时间占用百分比。
%MEM = (Memory Usage (RES)) 进程使用的物理内存百分比。
TIME+ = (CPU Time, hundredths) 进程使用的CPU时间总计,单位 1/100 秒。
PPID = (Parent Process pid) 父进程Id。
RUSER = (Real User Name)。
UID = (Effective User Id) 进程所有者的用户Id。
GROUP = (Group Name) 进程所有者的组名。
TTY = (Controlling Tty) 启动进程的终端名。不是从终端启动的进程则显示为 ?。
P = (Last Used Cpu (SMP)) 最后使用的 CPU,仅在多 CPU 环境下有意义。
SWAP = (Swapped Size (KiB)) 进程使用的虚拟内存中,被换出的大小,单位 KiB。
TIME = (CPU Time) 进程使用的CPU时间总计,单位秒。
CODE = (Code Size (KiB)) 可执行代码占用的物理内存大小,单位KiB。
DATA = (Data+Stack (KiB)) 可执行代码以外的部分 (数据段 + 栈) 占用的物理内存大小,单位KiB。
Flags = (Task Flags <sched.h>) 任务标志,参考 <sched.h>。
WCHAN = (Sleeping in Function) 若该进程在睡眠,则显示睡眠中的系统函数名。
nDRT = (Dirty Pages Count) 最后一次写入到现在,被修改过的页面数。
COMMAND = (Command Name/Line) 命令名/命令行。
top 命令交互操作
1. 显示 CPU 详细信息,每核显示一行

q:退出 top
3. 隐藏/显示第 1 行负载信息
l:隐藏/显示第 1 行负载信息


M:根据驻留内存大小进行排序
P:根据 CPU 使用百分比大小进行排序

8. 根据时间/累计时间进行排序
T:根据时间/累计时间进行排序
9. 指定进程列表显示行数,默认为满屏行数
n:指定进程列表显示行数,默认为满屏行数
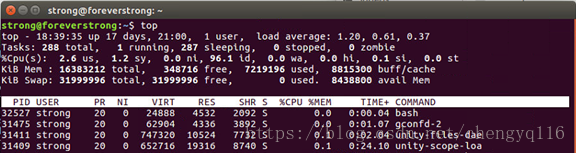
输入 n

Fields Management for window 1:Def, whose current sort field is %CPU
   Navigate with Up/Dn, Right selects for move then <Enter> or Left commits,
   'd' or <Space> toggles display, 's' sets sort.  Use 'q' or <Esc> to end!

* PID     = Process Id             nMaj    = Major Page Faults
* USER    = Effective User Name    nMin    = Minor Page Faults
* PR      = Priority               nDRT    = Dirty Pages Count
* NI      = Nice Value             WCHAN   = Sleeping in Function
* VIRT    = Virtual Image (KiB)    Flags   = Task Flags <sched.h>
* RES     = Resident Size (KiB)    CGROUPS = Control Groups
* SHR     = Shared Memory (KiB)    SUPGIDS = Supp Groups IDs
* S       = Process Status         SUPGRPS = Supp Groups Names
* %CPU    = CPU Usage              TGID    = Thread Group Id
* %MEM    = Memory Usage (RES)     ENVIRON = Environment vars
* TIME+   = CPU Time, hundredths   vMj     = Major Faults delta
* COMMAND = Command Name/Line      vMn     = Minor Faults delta
  PPID    = Parent Process pid     USED    = Res+Swap Size (KiB)
  UID     = Effective User Id      nsIPC   = IPC namespace Inode
  RUID    = Real User Id           nsMNT   = MNT namespace Inode
  RUSER   = Real User Name         nsNET   = NET namespace Inode
  SUID    = Saved User Id          nsPID   = PID namespace Inode
  SUSER   = Saved User Name        nsUSER  = USER namespace Inode
  GID     = Group Id               nsUTS   = UTS namespace Inode
  GROUP   = Group Name
  PGRP    = Process Group Id
  TTY     = Controlling Tty
  TPGID   = Tty Process Grp Id
  SID     = Session Id
  nTH     = Number of Threads
  P       = Last Used Cpu (SMP)
  TIME    = CPU Time
  SWAP    = Swapped Size (KiB)
  CODE    = Code Size (KiB)
  DATA    = Data+Stack (KiB)
References
http://www.teqlog.com/linux-commands-for-hardware-info-and-performance-monitoring.html