该案例主要目的是为了熟悉Keras基本用法,以及了解DNN基本流程。
示例代码:
import numpy as np
import matplotlib.pyplot as plt
from keras.models import Sequential
from keras.datasets import mnist
from keras.layers import Dense
from keras.utils.np_utils import to_categorical
#加载数据,训练60000条,测试10000条,X_train.shape=(60000,28,28)
(X_train, y_train), (X_test, y_test) = mnist.load_data()
#特征扁平化,缩放,标签独热
X_train_flat = X_train.reshape(60000, 28*28)
X_test_flat = X_test.reshape(10000, 28*28)
X_train_norm = X_train_flat / 255
X_test_norm = X_test_flat / 255
y_train_onehot = to_categorical(y_train, 10) #shape为(60000,10)
y_test_onehot = to_categorical(y_test, 10) #shape为(10000,10)
#构建模型
model = Sequential()
model.add(Dense(100, activation='relu', input_shape=(28*28,)))
model.add(Dense(50, activation='relu'))
model.add(Dense(10, activation='softmax'))
#模型配置和训练
model.compile(loss='categorical_crossentropy', optimizer='adam', metrics=['accuracy'])
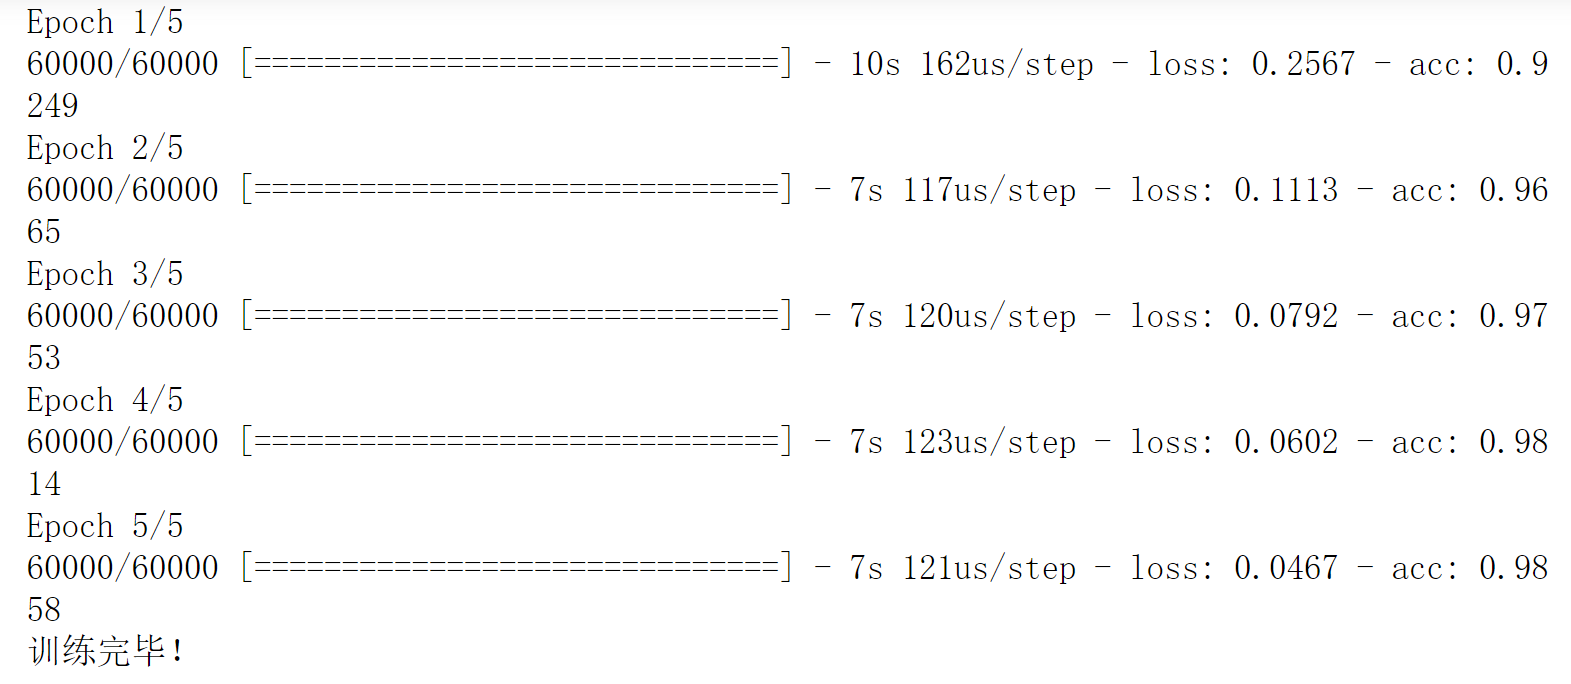
model.fit(X_train_norm, y_train_onehot, epochs=5, batch_size=32, verbose=1)
print("训练完毕!")训练结果为:
继续在测试集上评估模型。
#测试集上评估表现
score = model.evaluate(X_test_norm, y_test_onehot)
print("在测试集上评估完毕!")
print("在测试集上表现:Loss={:.4f}, Accuracy={:.4f}".format(score[0], score[1]))
#在测试集上预测
y_pred_class = model.predict_classes(X_test_norm) #shape=(10000,)
print("预测完毕!")
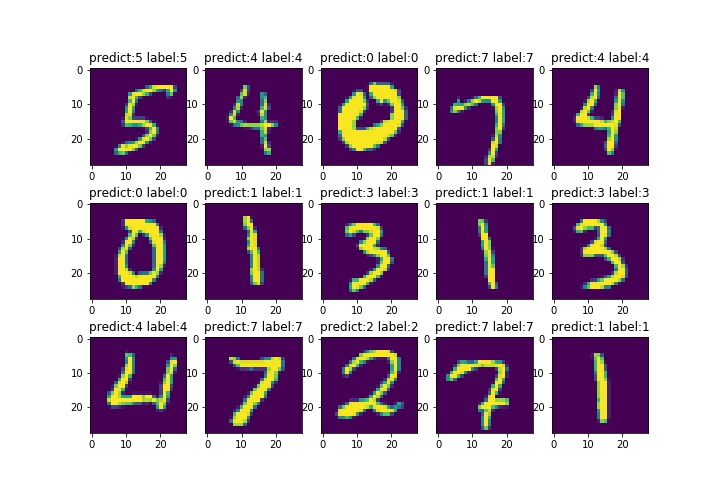
#查看预测效果,随机查看多张图片
idx = 22 #随机设置
count = 0
fig1 = plt.figure(figsize = (10,7))
for i in range(3):
for j in range(5):
count += 1
ax = plt.subplot(3,5,count)
plt.imshow(X_test[idx+count])
ax.set_title("predict:{} label:{}".format(y_pred_class[idx+count],
y_test[idx+count]))
fig1.savefig('images/look.jpg')运行结果为:

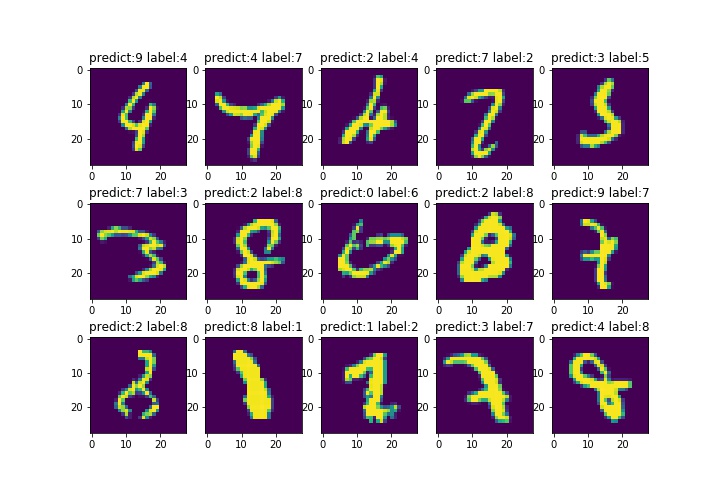
为了了解模型预测错误原因,可查看预测错误的图片。
#找出错误所在
X_test_err = X_test[y_test!=y_pred_class]  #(num_errors, 28, 28)
y_test_err = y_test[y_test!=y_pred_class]  #(num_errors,)
y_pred_class_err = y_pred_class[y_test!=y_pred_class]
#连续查看多张错误图片
idx = -1
count = 0
fig2 = plt.figure(figsize = (10,7))
for i in range(3):
    for j in range(5):
        count += 1
        ax = plt.subplot(3,5,count)
        plt.imshow(X_test_err[idx+count])
        ax.set_title("predict:{} label:{}".format(y_pred_class_err[idx+count],
                                                  y_test_err[idx+count]))
fig2.savefig('images/errors.jpg')
运行结果为: