MATLAB绘图及例子总结
二维图
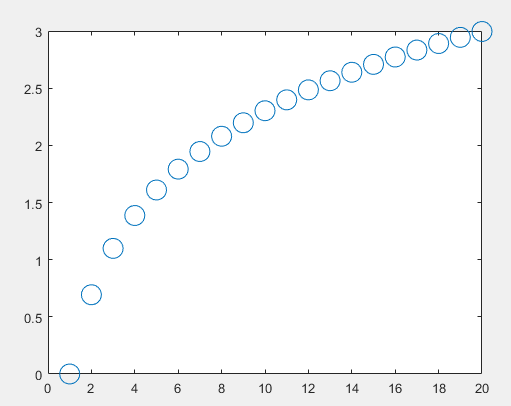
例 1
X1=[1,2,4,6,7,8,10,11,12,14,16,17,18,20];
Y1=[1,2,4,6,7,8,10,10,8,7,6,4,2,1];
figure(1)
plot(X1,Y1,'o','MarkerSize',15)
X2=1:20;
Y2=log(X2);
figure(2)
plot(X2,Y2,'o','MarkerSize',15)
结果:
例 2
X1=(0:12)*pi/6;
Y1=cos(3*X1);
X2=(0:360)*pi/180;
Y2=cos(3*X2);
figure(1)
subplot(2,2,1);
plot(X1,Y1,'o','MarkerSize',3); % 设置标准尺寸为3
xlim([0 2*pi]) % 补充知识点xlim
% x轴上下限设定xlim([a,b]);
% y轴上下限设定ylim([a,b])
subplot(2,2,2);
plot(X1,Y1,'LineWidth',2); % 设置线宽度为2
xlim([0 2*pi])
subplot(2,2,3);
plot(X2,Y2,'o','MarkerSize',3);
xlim([0 2*pi])
subplot(2,2,4);
plot(X2,Y2,'LineWidth',2);
xlim([0 2*pi])
结果:

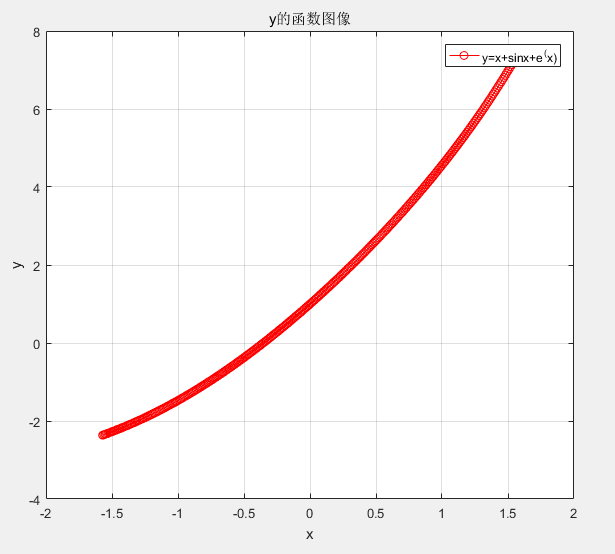
例 3
x=-pi/2:0.01:pi/2;
y=x+sin(x)+exp(x);
plot(x,y,'-ro'); % 颜色红色
grid on % 网格
title('y的函数图像');
xlabel('x');
ylabel('y');
legend('y=x+sinx+e^(x)');
结果:
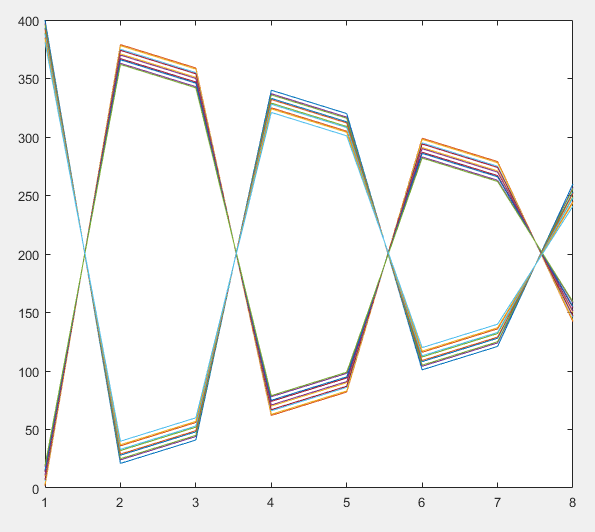
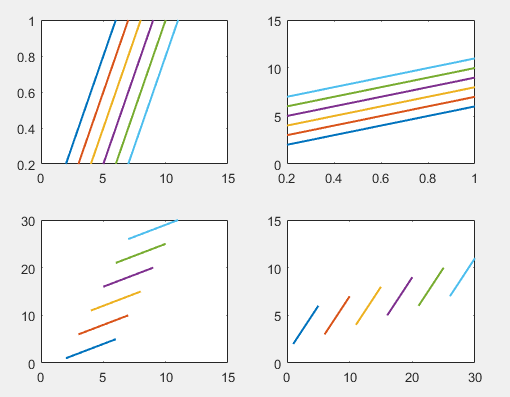
例 4
A=magic(20);
A(9:20,:)=[];
figure(1);
plot(A);
for i=1:5
    for j=1:6
        B(i,j)=i+j;
    end
end
x=0.2:0.2:1;
figure(2)
subplot(2,2,1);plot(B,x,'LineWidth',1.5);
subplot(2,2,2);plot(x,B,'LineWidth',1.5);
C=reshape(1:30,5,6); % 变换成特定维数5×6的矩阵
subplot(2,2,3);plot(B,C,'LineWidth',1.5);
subplot(2,2,4);plot(C,B,'LineWidth',1.5);
结果:
例 5
x=-pi:pi/10:pi;
y=tan(sin(x))-sin(tan(x));
plot(x,y,'--rs','LineWidth',2,'MarkerEdgeColor','k','MarkerFaceColor','g','MarkerSize',10);
% MarkerFaceColor:点符号填充颜色
% MarkerEdgeColor:点边框颜色
结果:

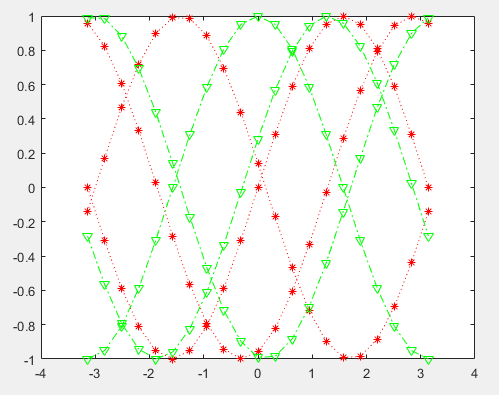
例 6
clear all
x=-pi:pi/10:pi;
y=[sin(x);sin(x+3);sin(x+5)];
z=[cos(x);cos(x+3);cos(x+5)];
figure;
plot(x,y,'r:*',x,z,'g-.v');
% r是红色,:是点线,*是星号标记
% g是绿色,-.是点画线,v是倒三角形
结果:
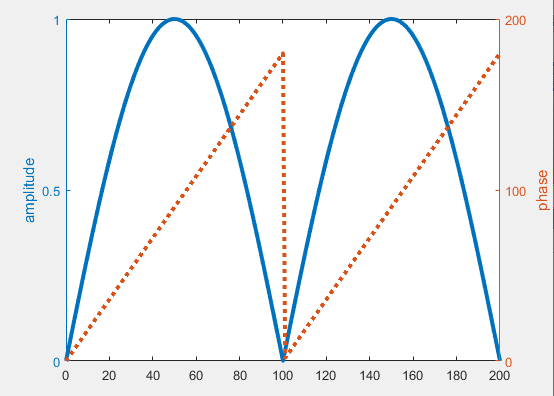
例 7
% 绘制双坐标轴
figure
angl=0:0.01*pi:2*pi;
ampl=sin(0:0.01*pi:2*pi);
z=ampl.*(cos(angl)+sqrt(-1)*sin(angl));
[AX,H1,H2]=plotyy(0:200,abs(z),0:200,angle(z)*180/pi);
% angle用来求复数矩阵相位角的弧度值,其取值为-pi到pi,z是一个复数,abs(z)是复数的模
set(get(AX(1),'Ylabel'),'String','amplitude') % amplitude振幅
set(get(AX(2),'Ylabel'),'String','phase')   % phase阶段
% get返回某些对象属性的当前值
set(H1,'LineWidth',3);
set(H2,'LineStyle',':','LineWidth',3)
结果:
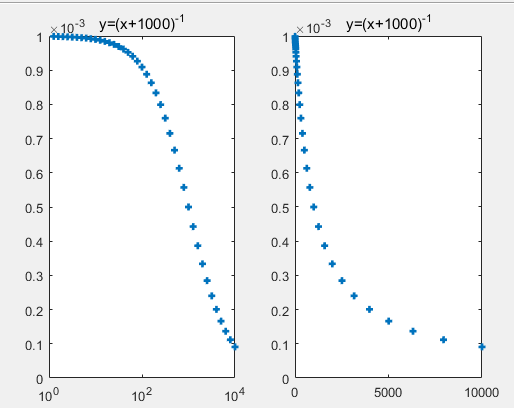
例 8
% x轴对数坐标
x=10.^(0.1:0.1:4);
y=1./(x+1000);
figure
subplot(1,2,1);
semilogx(x,y,'+','MarkerSize',5,'LineWidth',2);
title('y=(x+1000)^{-1}')
subplot(1,2,2);
plot(x,y,'+','MarkerSize',5,'LineWidth',2);
title('y=(x+1000)^{-1}')
% y轴对数坐标同理
结果1:
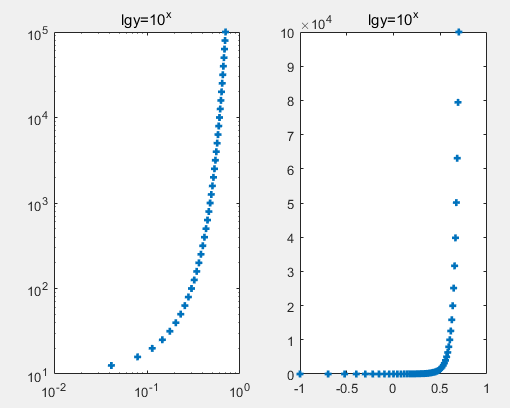
% x轴和y轴均为对数坐标
a=0.1:0.1:5;
x=log10(a);
y=10.^a;
figure
subplot(1,2,1)
loglog(x,y,'+','MarkerSize',5,'LineWidth',2)
title('lgy=10^x')
subplot(1,2,2)
plot(x,y,'+','MarkerSize',5,'LineWidth',2)
title('lgy=10^x')
结果2:
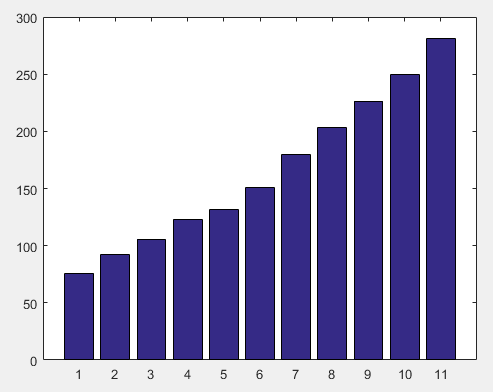
例 9
y=[75.995,91.972,105.711,123.203,131.669...
150.697,179.323,203.212,226.505,249.633,281.422];
figure;
bar(y);
结果:
例 10
x=-2:2;
Y=[6,8,7,4,5;4,8,1,12,0;4,6,21,1,3];
subplot(1,2,1),bar(x',Y','stacked')
xlabel('x'),ylabel('\Sigma y'),colormap(cool)
legend('因素 1','因素 2','因素 3')
subplot(1,2,2),barh(x',Y','grouped') % barh创建水平直方图
xlabel('y'),ylabel('x')
结果:

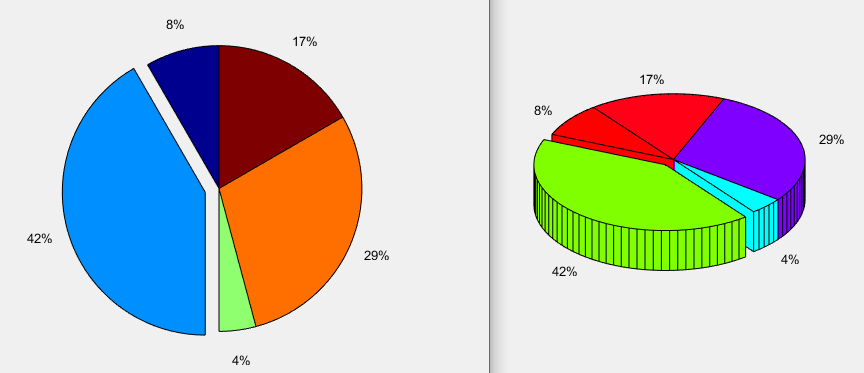
例 11
x=[1,5,0.5,3.5,2];
explode=[0,1,0,0,0];
pie(x,explode) % 饼图
colormap jet
figure
pie3(x,explode)
colormap hsv
结果:
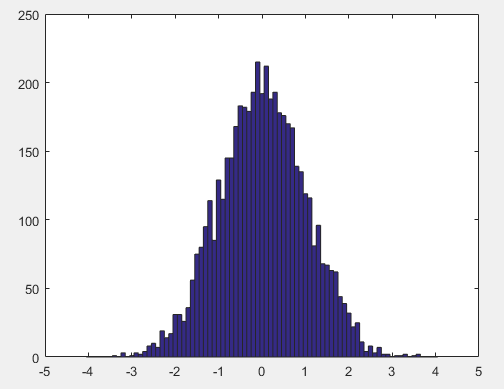
例 12
x=-4:0.1:4;
y=randn(5000,1);
hist(y,x) % 直方图
结果:
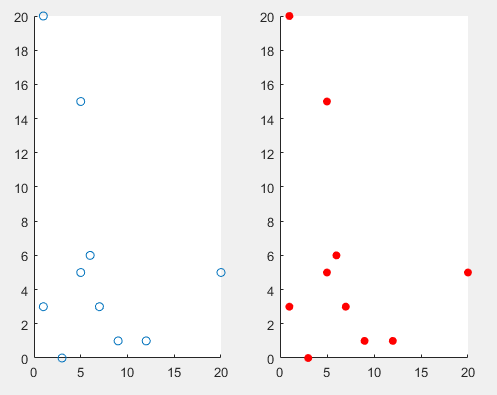
例 13
clear
figure;
x=[1,5,6,7,9,5,1,3,12,20];
y=[20,15,6,3,1,5,3,0,1,5];
subplot(121);
scatter(x,y); % 散点图
subplot(122);
scatter(x,y,[],[1,0,0],'fill');
结果:
三维图
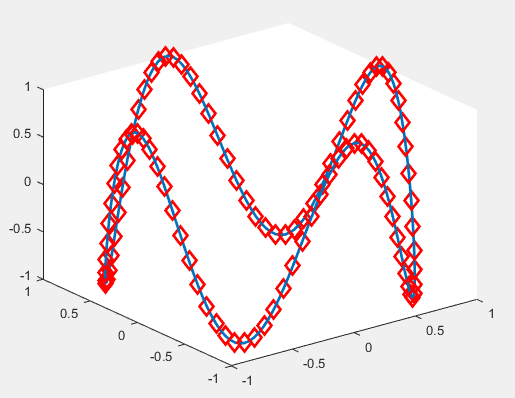
例 1
theta=0:0.01*pi:2*pi;
x=sin(theta);
y=cos(theta);
z=cos(4*theta);
figure
plot3(x,y,z,'LineWidth',2);hold on;
theta=0:0.02*pi:2*pi;
x=sin(theta);
y=cos(theta);
z=cos(4*theta);
plot3(x,y,z,'rd','MarkerSize',10,'LineWidth',2)
结果:
例 2
X=-10:0.1:10;
Y=-10:0.1:10;
[X,Y]=meshgrid(X,Y);
Z=-X.^2-Y.^2+200;
mesh(X,Y,Z)
结果:

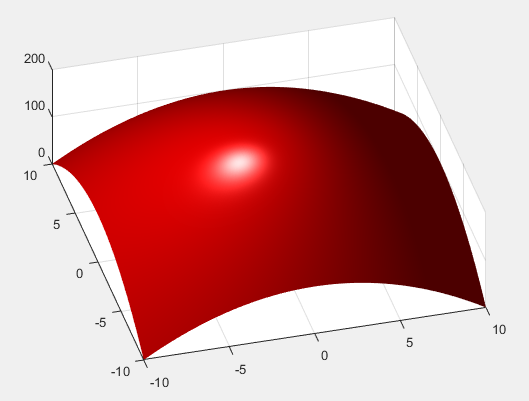
例 3
figure
surf(X,Y,Z,'FaceColor','red','EdgeColor','none');
camlight left; % 左侧加一个发光物体
lighting phong % 光照模式,使图表面光滑细腻,色彩丰富
view(-15,65) % 视角的角度
结果:
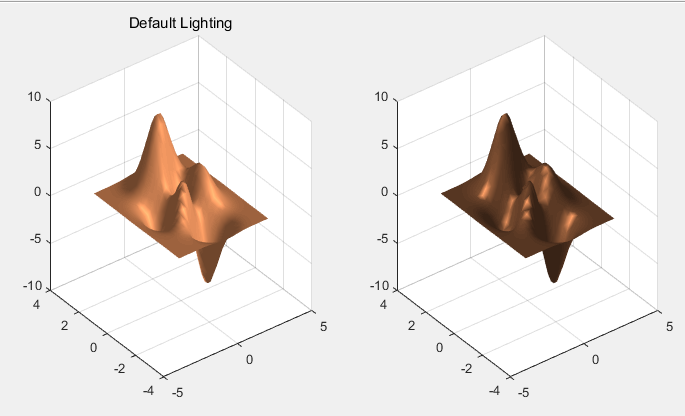
例 4
···
[X,Y,Z]=peaks(30); %peaks函数是一个典型的多元函数,本质上是一个二元高斯分布的概率密度函数
subplot(1,2,1);surfl(X,Y,Z),colormap(copper),title('Default Lighting'),shading interp
subplot(1,2,2);surfl(X,Y,Z,[-90,30],[.55,.6,2,10]),shading interp
···
结果:
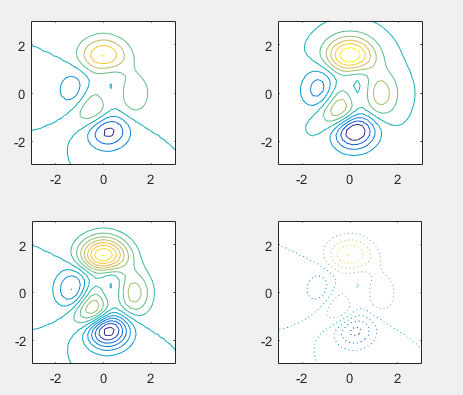
例 5
% 等高线图
[X,Y,Z]=peaks(30);
figure
subplot(2,2,1);contour(X,Y,Z);axis square
subplot(2,2,2);contour(X,Y,Z,10);axis square
subplot(2,2,3);contour(X,Y,Z,-10:1:10);axis square
subplot(2,2,4);contour(X,Y,Z,':');axis square
结果:
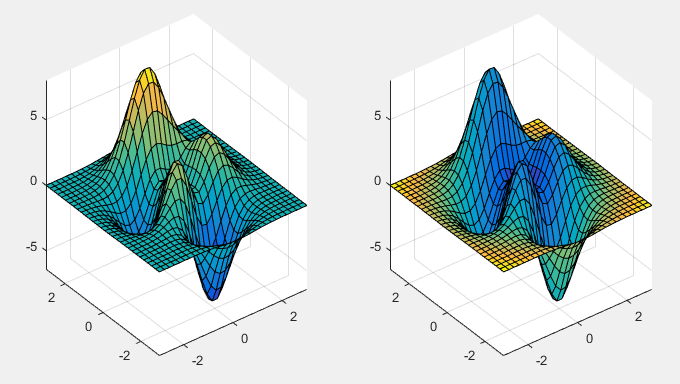
例 6
[X,Y,Z]=peaks(30);
R=sqrt(X.^2+Y.^2);
subplot(1,2,1);
surf(X,Y,Z,Z);
axis tight
subplot(1,2,2);surf(X,Y,Z,R);
axis tight
结果: