</!DOCTYPE html>
<html>
<head>
<meta charset="utf-8">
<title>文件统计</title>
<script src="http://echarts.baidu.com/dist/echarts.js"></script>
</head>
<body>
<div id="main" style="width:600px;height:600px"></div>
<script type="text/javascript">
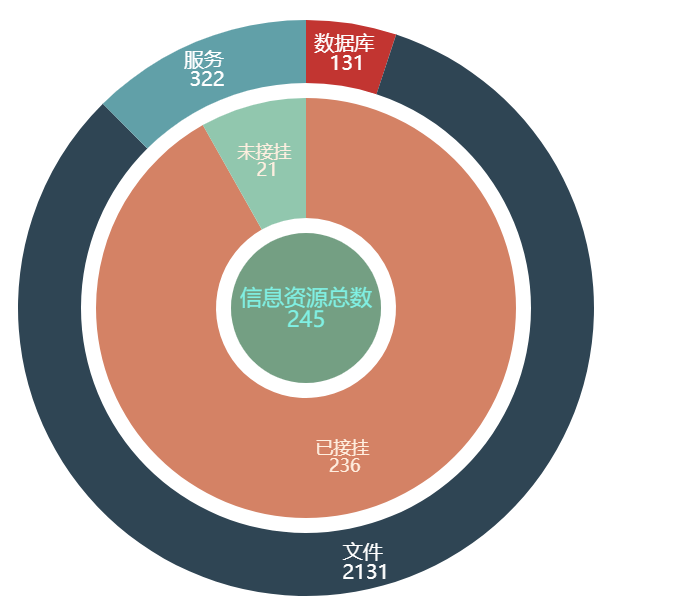
var aaa =245
var vad=[
{value:236, name:'已接挂'},
{value:21, name:'未接挂'},
]
var myChart = echarts.init(document.getElementById('main'));
var option = {
tooltip: {
trigger: 'item',
formatter: "{a} <br/>{b}: {c} ({d}%)"
},
series: [
{
name:'数据接挂',
type:'pie',
selectedMode: 'single',
radius: ['75%', '96%'],
label: {
normal: {
position: 'inside',
fontSize: 20,
color:'',
fontFamily:'Microsoft Yahei'
}
},
itemStyle:{
normal:{
label:{
show: true,
formatter: '{b} \n {c} '
},
labelLine :{show:true}
}
} ,
data:[
{value:131, name:'数据库'},
{value:2131, name:'文件'},
{value:322, name:'服务'},
]
},
{
name:'数据接挂',
type:'pie',
radius: ['30%', '70%'],
label: {
normal: {
position:'inside',
align:'right',
fontSize: 18,
fontFamily:'Microsoft YaHei',
color:"#FFEFE0",
}
},
itemStyle:{ //每个子类显示标题加数字
normal:{
label:{
show: true,
formatter: '{b} \n {c} '
},
labelLine :{show:true}
}
} ,
data:vad
},
{
name:'信息资源总数',
type:'pie',
radius: ['0%', '25%'],
label: {
normal: {
show:true,
position: 'center',
fontSize: 22,
fontFamily:'Microsoft YaHei',
color:'#80F0E3',
}
},
itemStyle:{ //显示标题加数字
normal:{
label:{
show: true,
formatter: '{b} \n {c} '
},
labelLine :{show:true}
}
} ,
data:[
{value:145,name:"总数"},
]
}
]
};
myChart.setOption(option);
</script>
</body>
</html>