Matlab中有bwlabel\bwboundaries两个连通分量标记函数
bwlabel(二维0-1)
作用:Label connected components in 2-D binary image
语法
L = bwlabel(BW)
L = bwlabel(BW,conn)
[L,n] = bwlabel(___)
说明
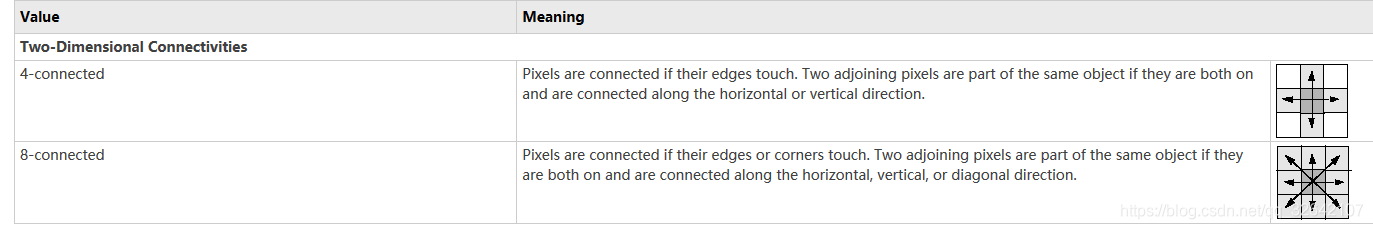
L = bwlabel(BW)返回标签矩阵L,其中包含BW中找到的8个连接对象的标签。
L = bwlabel(BW,conn)返回一个标签矩阵,其中conn指定连接,4或者8。
[L,n] = bwlabel()也返回n,即BW中找到的连接对象的数量。
对于bwlabel来说,其作用大致如下
bwlabeln(多维)
作用 Label connected components in binary image
语法
L = bwlabeln(BW)
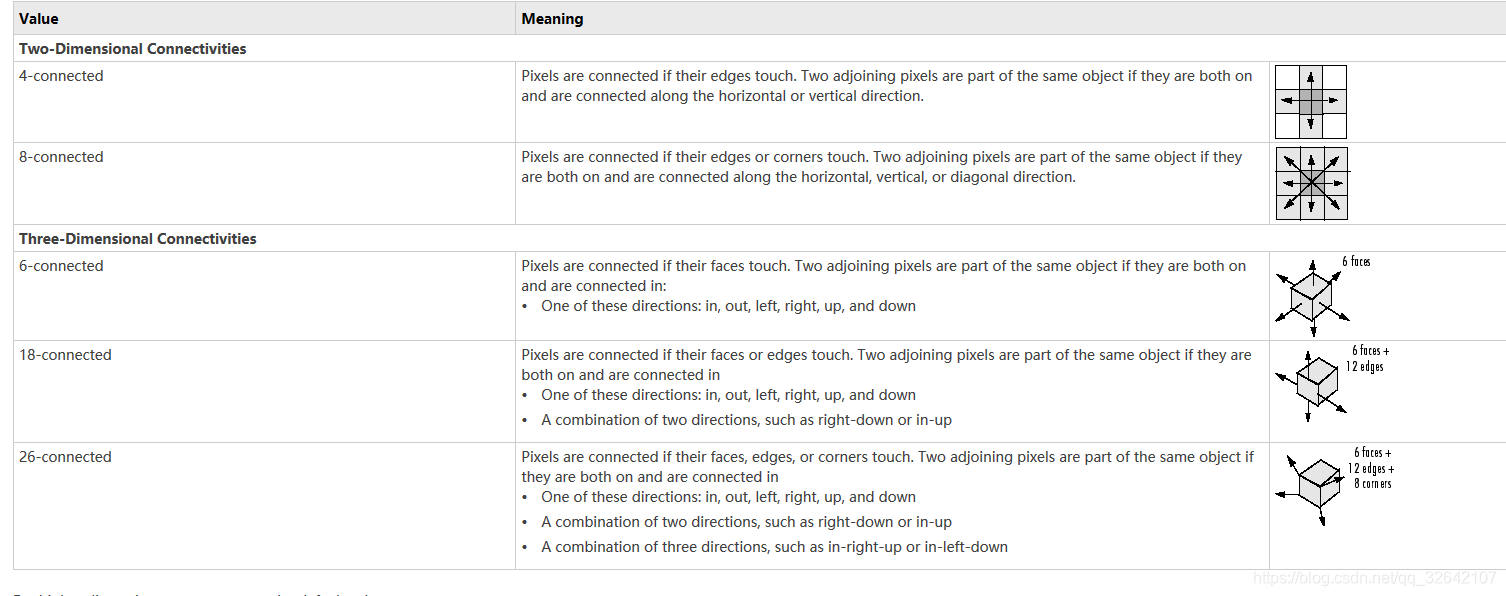
L = bwlabeln(BW,conn)
[L,n] = bwlabeln(___)
说明
L = bwlabeln(BW) returns a label matrix, L, containing labels for the connected components in BW.
L = bwlabeln(BW,conn) returns a label matrix, where conn specifies the connectivity.
[L,n] = bwlabeln(___) also returns n, the number of connected objects found in BW.
bwboundaries
意译为:跟踪二进制图像中的区域边界
语法
B = bwboundaries(BW)
B = bwboundaries(BW,conn)
B = bwboundaries(BW,conn,options)
[B,L]= bwboundaries(___)
[B,L,n,A] = bwboundaries(___)
BW — Input binary image
conn — Pixel connectivity ,8 (default) | 4
options — Determine whether to search for both parent and child boundaries,‘holes’ (default) | ‘noholes’
B — Row and column coordinates of boundary pixels(边界像素的行坐标和列坐标)
L — Label matrix
n — Number of objects found
A — Parent-child dependencies between boundaries and holes(square, sparse, logical matrix.正方形,稀疏,逻辑矩阵)
说明
B = bwboundary (BW)在二值图像BW中,追踪物体的外部边界,以及物体内部的孔边界。bwboundary也向下延伸到最外层的对象(父对象)并跟踪其子对象(父对象完全包围的对象)。返回边界像素位置的单元格数组B。
B = bwboundary (BW,conn)跟踪对象的外部边界,其中conn指定在跟踪父和子边界时使用的连接。
B = bwboundary (BW,conn,options)跟踪对象的外部边界,其中的选项要么是“hole”,要么是“noholes”,指定是否希望包含其他对象内部的hole边界。
[B,L]= bwboundaries()返回一个标签矩阵L,其中标记了对象和孔。
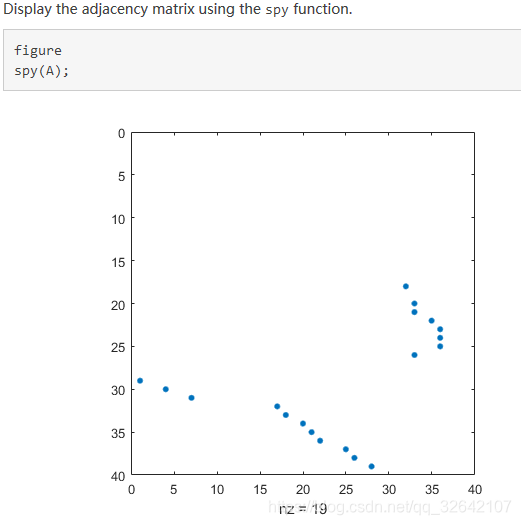
[B,L,n,A] = bwboundaries()(_)返回找到的对象数量n和邻接矩阵A。
例子
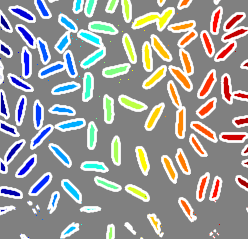
//在图像上覆盖区域边界
I = imread('rice.png');

//Convert grayscale image to binary image using local adaptive thresholding.
BW = imbinarize(I);

//Calculate boundaries of regions in image and overlay the boundaries on the image.
[B,L] = bwboundaries(BW,'noholes');

imshow(label2rgb(L, @jet, [.5 .5 .5]))
hold on
for k = 1:length(B)
   boundary = B{k};
   plot(boundary(:,2), boundary(:,1), 'w', 'LineWidth', 2)
end
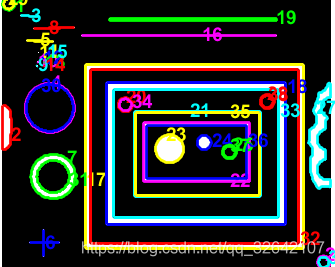
//在图像上覆盖区域边界,并用区域号标注
BW = imread('blobs.png');

//Calculate boundaries of regions in the image.

[B,L,N,A] = bwboundaries(BW);

//Display the image with the boundaries overlaid.
//Add the region number next to every boundary (based on the label matrix). Use the zoom tool to read individual labels.

imshow(BW); hold on;
colors=['b' 'g' 'r' 'c' 'm' 'y'];
for k=1:length(B),
  boundary = B{k};
  cidx = mod(k,length(colors))+1;
  plot(boundary(:,2), boundary(:,1),...
       colors(cidx),'LineWidth',2);

  %randomize text position for better visibility
  rndRow = ceil(length(boundary)/(mod(rand*k,7)+1));
  col = boundary(rndRow,2); row = boundary(rndRow,1);
  h = text(col+1, row-1, num2str(L(row,col)));
  set(h,'Color',colors(cidx),'FontSize',14,'FontWeight','bold');
end
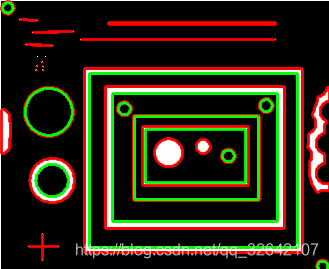
//以红色显示对象边界,以绿色显示孔边界
//Read binary image into workspace.

BW = imread('blobs.png');
//Calculate boundaries.

[B,L,N] = bwboundaries(BW);
//Display object boundaries in red and hole boundaries in green.

imshow(BW); hold on;
for k=1:length(B),
   boundary = B{k};
   if(k > N)
     plot(boundary(:,2), boundary(:,1), 'g','LineWidth',2);
   else
     plot(boundary(:,2), boundary(:,1), 'r','LineWidth',2);
   end
好用的网站:https://ww2.mathworks.cn/help/images/ref/bwboundaries.html?s_tid=doc_ta
比买书有用多了,我买过一本matlab完全自学一本通,其实还不如这个网站来得直接。
openCV上也有这样得功能函数。