A页面 嵌套 B页面的代码
主要处理 leaflet 的 marker 的 popopen, marker的点击的显示/隐藏 pop 会导致pop中的页面的内容,消失,不在页面中,导致bootstrap的冻结表格实现不了(元素节点还没加载出来,自然冻结不了)
把B页面 嵌 在 A 页面的marker 的 弹窗中
A页面部分代码:
// ---------------点击弹出信息/str----------
        let marker = L.marker([31.749662, 120.63073]).addTo(map)
        marker.bindPopup(
            '<div style="width:100%;height:100%">'+
            '<iframe style="width:100%;height:100%;" frameborder=0 border=0 scrolling="no" name="iframe1" src="projectFXHG.html"></iframe>'+
            '</div>', { minWidth: 300, maxHeight: 320 })
B页面
<!DOCTYPE html>
<html>
<head>
<meta charset="UTF-8">
<meta name="viewport" content="width=device-width, initial-scale=1.0">
<meta http-equiv="X-UA-Compatible" content="ie=edge">
<title>调用地图【EPSG:4490】</title>
<link rel="stylesheet" href="./Lib/JS/bootstrap/css/bootstrap.css">
<link rel="stylesheet" href="./Lib/JS/bootstrap-table/bootstrap-table.css">
<link rel="stylesheet" href="./Lib/JS/bootstrap-table-fixed-columns-master/bootstrap-table-fixed-columns.css">
<link rel="stylesheet" href="Lib/leaflet.css">
<script src="Lib/jquery.min.js"></script>
<script src="./Lib/JS/bootstrap/js/bootstrap.js"></script>
<script src="./Lib/JS/bootstrap-table/bootstrap-table.js"></script>
<script src="./Lib/JS/bootstrap-table-fixed-columns-master/bootstrap-table-fixed-columns.js"></script>
<script src="./Lib/JS/echarts/echarts.js"></script>
<script src="Lib/leaflet.js"></script>
<script src="Lib/proj4.js"></script>
<script src="Lib/proj4leaflet.js"></script>
<script src="Lib/esri-leaflet_v2.2.4.js"></script>
<style>
html,
body {
margin: 0;
padding: 0;
width: 100%;
height: 100%;
font: 14px "Helvetica Neue", Arial, Helvetica, sans-serif;
}
.box {
position: absolute;
z-index: 1001;
width: 100vh;
color: white;
}
.infor {
position: absolute;
z-index: 1001;
TOP: 20%;
border: 1px green solid;
height: 450px;
background-color: white;
color: #5e636c;
display: flex;
flex-direction: column;
width: 300px;
}
.pop-li1 {
border: 1px solid #d8dce5;
width: 35%;
padding: 5px;
}
.pop-li2 {
border: 1px solid #d8dce5;
width: 64%;
padding: 5px;
}
.pop-table {
margin-top: 9px;
}
.checked {
border-bottom: 0px;
background-color: #38a0f4;
}
#eventList:hover {
cursor: pointer;
background-color: #38a0f469;
}
#before24:hover {
cursor: pointer;
background-color: #38a0f469;
}
.leaflet-container a {
color: black;
}
.leaflet-popup-content {
width: 300px !important;
height: 290px;
background-color: #fff;
position: relative;
padding: 5px;
}
#map {
margin: 0 auto;
height: 100%;
widows: 100%;
}
</style>
</head>
<body>
<div style="width:100%;height:100%;">
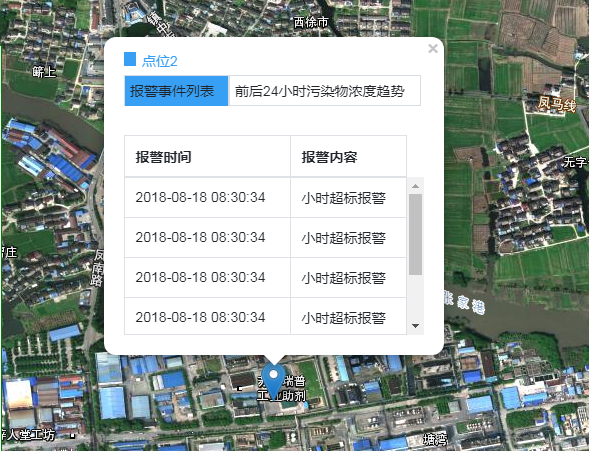
<div style="margin-bottom: 5px;"><div style="display: inline-block;width: 12px;height: 14px;background-color: #38a0f4;"></div><span style="color:#38a0f4;margin-left: 6px;">点位2</span></div>
<ul class="nav nav-pills">
<li id="eventList" class="active pop-li1 checked" onclick="checked()">报警事件列表</li>
<li id="before24" class="pop-li2" onclick="initEcharts()">前后24小时污染物浓度趋势</li>
</ul>
<div class="tab-content pop-table">
<div class="tab-pane active" id="A" style="height:200px;">
<table id="poptable" class="table table-bordered table-hover"
data-toggle="table"
data-classes="table table-hover"
data-show-columns="false"
data-striped="true"
data-show-toggle="false"
data-search="false"
data-show-refresh="false"
data-toolbar="#toolbar"
data-height="220"
>
<thead>
<tr>
<th>报警时间</th>
<th>报警内容</th>
</tr>
</thead>
<tr>
<td>2018-08-18 08:30:34</td>
<td>小时超标报警</td>
</tr>
<tr>
<td>2018-08-18 08:30:34</td>
<td>小时超标报警</td>
</tr>
<tr>
<td>2018-08-18 08:30:34</td>
<td>小时超标报警</td>
</tr>
<tr>
<td>2018-08-18 08:30:34</td>
<td>小时超标报警</td>
</tr>
<tr>
<td>2018-08-18 08:30:34</td>
<td>小时超标报警</td>
</tr>
<tr>
<td>2018-08-18 08:30:34</td>
<td>小时超标报警</td>
</tr>
</table>
</div>
<div class="tab-pane" id="B">
<div style="display: flex;margin-top: 12px;">
<div style="width: 26%;padding-top: 7px;"> 查询因子: </div>
<div style="flex-grow:1">
<select class="form-control">
<option>SOz</option>
<option>2</option>
<option>3</option>
<option>4</option>
<option>5</option>
</select>
</div>
</div>
<div id="main" style="width: 300px;height:180px;overflow:auto;margin-top:15px"></div>
</div>
</div>
</div>
<script>
function checked() {
if ($("#eventList").hasClass("checked")) {
$("#before24").removeClass("checked")
$("#B").removeClass("active")
$("#A").addClass("active")
} else {
$("#eventList").addClass("checked")
$("#before24").removeClass("checked")
$("#B").removeClass("active")
$("#A").addClass("active")
}
}
function initEcharts() {
// $('.leaflet-popup-content-wrapper').css({'width':'283px','height': '232px'});
$("#before24").addClass("checked");
$("#eventList").removeClass("checked")
$("#A").removeClass("active")
$("#B").addClass("active")
var myChart = echarts.init(document.getElementById('main'));
// 指定图表的配置项和数据
var option = {
// 给echarts图设置背景色
backgroundColor: '#FBFBFB',
title: {
text: '2019-06-13',
textStyle: {
fontSize: '12'
}
},
tooltip: {
trigger: 'axis',
axisPointer: {
type: 'cross',
label: {
backgroundColor: '#6a7985'
}
}
},
legend: {
data: ['SQz']
},
grid: {
top: '20%',
left: '3%',
right: '4%',
bottom: '3%',
containLabel: true
},
xAxis: [{
axisLabel: {
rotate: 30,
interval: 0
},
type: 'category',
boundaryGap: false,
data: function () {
let list = ['00:00', '01:00', '02:00', '03:00', '04:00', '05:00', '06:00']
return list;
}()
}],
yAxis: { type: 'value' },
series: [{
name: 'SQz',
data: [820, 932, 901, 934, 1290, 1330, 1320],
type: 'line',
color: '#007bff',
smooth: true,
symbolSize: 10
}]
};
// 使用刚指定的配置项和数据显示图表。
myChart.setOption(option);
}
</script>
</body>
</html>