最近在学python,想把一些东西分享出来,也算是对自己学习内容的一个整理,内容比较细碎,比较适合小白~
编程重在实践,(当然基础是非常非常重要滴)。而像我这种性子猴急的人经常会问的就是这东西到底怎么用起来?于是乎我就在网上找到一些比较好的、有意思的python代码作为例程,一起学习,实现一些比较有意思的功能,后续会陆续分几期分享给大家。
最近在做车道线检测的相关课题,在某乎上看到了一篇udacity检测车道线的比较不错的文章,所以第一期我们的内容就是《利用python与opencv进行车道线检测》
代码下载地址:https://github.com/yang1688899/CarND-Advanced-Lane-Lines
项目情况介绍:https://zhuanlan.zhihu.com/p/35134563
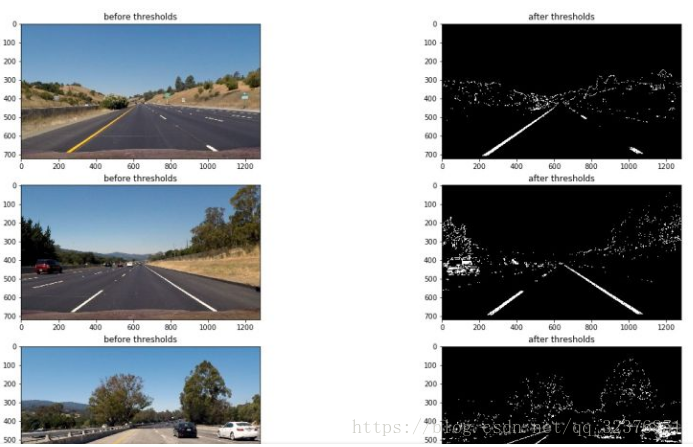
贴几张图:
<检测效果视频>

<处理效果>

更多的内容参考链接。
好,正式开始吧。
1.代码准备:按照代码链接把代码下载下来,这里有一个备用下载链接:链接:
https://pan.baidu.com/s/19TDdMsUEwiqxy4WNJfH1Pw 密码: ka79。
2.文件结构分析:我们来看看文件的组成。
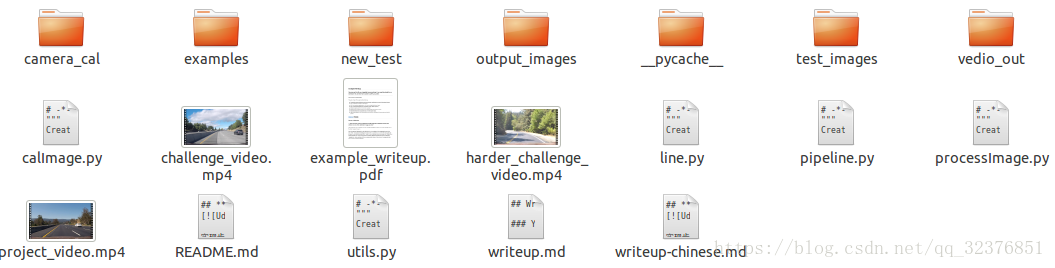
文件比较多,包括一些原始视频,处理结果等等。可以参考README.md文件,详细介绍了文件夹中所有文件内容。主要代码放在.py文件中,utils.py包括主要函数的实现,而processImage.py是主程序。所以我们就从processImage.py文件开始,一行一行详细地来学习一遍,一些基本的图像处理的知识我也会穿插着讲解一下,here we go!
3.代码解析:从processImage.py文件开始。
# -*- coding: utf-8 -*-
"""
Created on Sun Oct  8 11:22:29 2017

@author: yang
"""

import os
import cv2
import utils
import matplotlib.pyplot as plt
import numpy as np

cal_imgs = utils.get_images_by_dir('camera_cal')
object_points,img_points = utils.calibrate(cal_imgs,grid=(9,6))

#test_imgs = utils.get_images_by_dir('test_images')
test_imgs = utils.get_images_by_dir('new_test')

undistorted = []
for img in test_imgs:
    img = utils.cal_undistort(img,object_points,img_points)
    undistorted.append(img)

trans_on_test=[]
for img in undistorted:
    src = np.float32([[(203, 720), (585, 460), (695, 460), (1127, 720)]])
    dst = np.float32([[(320, 720), (320, 0), (960, 0), (960, 720)]])
    M = cv2.getPerspectiveTransform(src, dst)
    trans = cv2.warpPerspective(img, M, img.shape[1::-1], flags=cv2.INTER_LINEAR)
    trans_on_test.append(trans)

thresh = []
binary_wrapeds = []
histogram = []
for img in undistorted:
    x_thresh = utils.abs_sobel_thresh(img, orient='x', thresh_min=55, thresh_max=100)
    mag_thresh = utils.mag_thresh(img, sobel_kernel=3, mag_thresh=(70, 255))
    dir_thresh = utils.dir_threshold(img, sobel_kernel=3, thresh=(0.7, 1.3))
    s_thresh = utils.hls_select(img,channel='s',thresh=(160, 255))
    s_thresh_2 = utils.hls_select(img,channel='s',thresh=(200, 240))

    white_mask = utils.select_white(img)
    yellow_mask = utils.select_yellow(img)

    combined = np.zeros_like(mag_thresh)
#    combined[(x_thresh==1) | ((mag_thresh == 1) & (dir_thresh == 1)) | (s_thresh==1)] = 1
#    combined[((mag_thresh == 1) & (dir_thresh == 1))] = 1
    combined[((x_thresh == 1) | (s_thresh == 1)) | ((mag_thresh == 1) & (dir_thresh == 1))| (white_mask>0)|(s_thresh_2 == 1) ]=1

    src = np.float32([[(203, 720), (585, 460), (695, 460), (1127, 720)]])
    dst = np.float32([[(320, 720), (320, 0), (960, 0), (960, 720)]])
    M = cv2.getPerspectiveTransform(src, dst)
    binary_warped = cv2.warpPerspective(combined, M, img.shape[1::-1], flags=cv2.INTER_LINEAR)

    hist = np.sum(binary_warped[binary_warped.shape[0]//2:,:], axis=0)
    histogram.append(hist)

    binary_wrapeds.append(binary_warped)

    thresh.append(combined)


plt.figure(figsize=(20,68))
i=0
for binary_warped in binary_wrapeds:
    # Take a histogram of the bottom half of the image
    histogram = np.sum(binary_warped[binary_warped.shape[0]//2:,:], axis=0)
    # Create an output image to draw on and  visualize the result
    out_img = np.dstack((binary_warped, binary_warped, binary_warped))*255
    # Find the peak of the left and right halves of the histogram
    # These will be the starting point for the left and right lines
    midpoint = np.int(histogram.shape[0]/2)
    leftx_base = np.argmax(histogram[:midpoint])
    rightx_base = np.argmax(histogram[midpoint:]) + midpoint

    # Choose the number of sliding windows
    nwindows = 9
    # Set height of windows
    window_height = np.int(binary_warped.shape[0]/nwindows)
    # Identify the x and y positions of all nonzero pixels in the image
    nonzero = binary_warped.nonzero()
    nonzeroy = np.array(nonzero[0])
    nonzerox = np.array(nonzero[1])
    # Current positions to be updated for each window
    leftx_current = leftx_base
    rightx_current = rightx_base
    # Set the width of the windows +/- margin
    margin = 100
    # Set minimum number of pixels found to recenter window
    minpix = 50
    # Create empty lists to receive left and right lane pixel indices
    left_lane_inds = []
    right_lane_inds = []

    # Step through the windows one by one
    for window in range(nwindows):
        # Identify window boundaries in x and y (and right and left)
        win_y_low = binary_warped.shape[0] - (window+1)*window_height
        win_y_high = binary_warped.shape[0] - window*window_height
        win_xleft_low = leftx_current - margin
        win_xleft_high = leftx_current + margin
        win_xright_low = rightx_current - margin
        win_xright_high = rightx_current + margin
        # Draw the windows on the visualization image
        cv2.rectangle(out_img,(win_xleft_low,win_y_low),(win_xleft_high,win_y_high),
        (0,255,0), 2)
        cv2.rectangle(out_img,(win_xright_low,win_y_low),(win_xright_high,win_y_high),
        (0,255,0), 2)
        # Identify the nonzero pixels in x and y within the window
        good_left_inds = ((nonzeroy >= win_y_low) & (nonzeroy < win_y_high) &
        (nonzerox >= win_xleft_low) &  (nonzerox < win_xleft_high)).nonzero()[0]
        good_right_inds = ((nonzeroy >= win_y_low) & (nonzeroy < win_y_high) &
        (nonzerox >= win_xright_low) &  (nonzerox < win_xright_high)).nonzero()[0]
        # Append these indices to the lists
        left_lane_inds.append(good_left_inds)
        right_lane_inds.append(good_right_inds)
        # If you found > minpix pixels, recenter next window on their mean position
        if len(good_left_inds) > minpix:
            leftx_current = np.int(np.mean(nonzerox[good_left_inds]))
        if len(good_right_inds) > minpix:
            rightx_current = np.int(np.mean(nonzerox[good_right_inds]))

    # Concatenate the arrays of indices
    left_lane_inds = np.concatenate(left_lane_inds)
    right_lane_inds = np.concatenate(right_lane_inds)

    # Extract left and right line pixel positions
    leftx = nonzerox[left_lane_inds]
    lefty = nonzeroy[left_lane_inds]
    rightx = nonzerox[right_lane_inds]
    righty = nonzeroy[right_lane_inds]

    # Fit a second order polynomial to each
    left_fit = np.polyfit(lefty, leftx, 2)
    right_fit = np.polyfit(righty, rightx, 2)

    # Generate x and y values for plotting
    ploty = np.linspace(0, binary_warped.shape[0]-1, binary_warped.shape[0] )
    left_fitx = left_fit[0]*ploty**2 + left_fit[1]*ploty + left_fit[2]
    right_fitx = right_fit[0]*ploty**2 + right_fit[1]*ploty + right_fit[2]

    plt.subplot(2*len(thresh),2,2*i+1)
    plt.imshow(binary_warped,cmap ='gray')

    plt.subplot(2*len(thresh),2,2*i+2)
    i+=1

    out_img[nonzeroy[left_lane_inds], nonzerox[left_lane_inds]] = [255, 0, 0]
    out_img[nonzeroy[right_lane_inds], nonzerox[right_lane_inds]] = [0, 0, 255]
    plt.imshow(out_img)
    plt.plot(left_fitx, ploty, color='yellow')
    plt.plot(right_fitx, ploty, color='yellow')
    plt.xlim(0, 1280)
    plt.ylim(720, 0)


plt.figure(figsize=(20,68))
for i in range(len(thresh)):

    plt.subplot(2*len(thresh),2,2*i+1)
#    plt.title('before thresholds')
    plt.imshow(undistorted[i][:,:,::-1])

    plt.subplot(2*len(thresh),2,2*i+2)
#    plt.title('after thresholds')
    plt.imshow(thresh[i],cmap='gray')
#
#plt.figure(figsize=(20,68))
#for i in range(len(thresh)):
#
#    plt.subplot(2*len(thresh),2,2*i+1)
#    plt.title('thresholded_wraped image')
#    plt.imshow(thresh[i],cmap ='gray')
#
#    plt.subplot(2*len(thresh),2,2*i+2)
#    plt.title('histogram')
#    plt.plot(histogram[i])
#
#undist = utils.cal_undistort(cal_imgs[0],object_points,img_points)
#plt.figure(figsize=(20,10))
#plt.subplot(2,2,1)
#plt.title('before undistorted')
#plt.imshow(cal_imgs[0][:,:,::-1])
#
#plt.subplot(2,2,2)
#plt.title('after undistorted')
#plt.imshow(undist[:,:,::-1])

#test = utils.select_yellow(undistorted[0])
#plt.imshow(test)
#print(test.shape)
开头几行,看是毫不起眼,实际上内容丰富
# -*- coding: utf-8 -*-
"""
Created on Sun Oct  8 11:22:29 2017

@author: yang
"""
# -*- coding: utf-8 -*- 是编码声明,那为什么是utf-8,啥是utf-8?编码格式有ASCII,Unicode,utf-8,详细了解他们的关系见链接,如果实在不想理解,你就记住当你的源代码中包含中文的时候,在保存代码时候,务必指定保存为UTF-8编码。下面三个“包含的内容是描述的代码生成的时间,作者等信息,你也可以在自己的代码中留下自己的大名让后人瞻仰~
import os
import cv2
import utils
import matplotlib.pyplot as plt
import numpy as np
这段代码呢,就是python加载的各种包,可以利用很多功能很强大的包解决一些问题,非常方便,我们的程序需要用到opencv进行图像处理的操作,numpy进行数值运算等等,其中utils就是我们提到的自己编写的一些函数的.py文件,我们也需要导进来,具体用法后面会详细讲到。
cal_imgs = utils.get_images_by_dir('camera_cal')
这条语句调用了utils中的get_image_by_dir()函数。功能:按照指定的路径加载其中的所有图片。这个函数功能怎么实现的呢?我们打开utils.py文件,找到相应的函数定义。
#get all image in the given directory persume that this directory only contain image files
def get_images_by_dir(dirname):
    img_names = os.listdir(dirname)
    img_paths = [dirname+'/'+img_name for img_name in img_names]
    imgs = [cv2.imread(path) for path in img_paths]
    return imgs
可以看到:python定义函数的格式:
def <函数名> (参数列表):
........
........
在这个函数中,传入参数是包含载入图像的文件夹名称dirname,
img_names = os.listdir(dirname)
这句代码使用os的listdir()函数获取了dirname文件夹下所有文件的名称,并保存在img_names变量中。
img_paths = [dirname+'/'+img_name for img_name in img_names]
然后使用一个list来保存所有图片的地址,这里img_paths =[]代表img_names是一个list,这是python的一种基本的数据类型,其中,每个变量都是一个字符串,用dirname+'/'+img_name 来表示,这里的"+"功能可以直接将字符串串联起来。后面的"for img_name in img_names"理解为对我们之前得到的所有img_names,都进行字符串的拼接工作,这和c++中的for循环是一样的原理。因此,这行代码得到的结果就是:得到dirname文件夹下左右文件的名称的完整路径。
imgs = [cv2.imread(path) for path in img_paths]
这行代码利用opencv的imread函数进行图片的读取,该函数需要输入图片的路径,然后将结果存放在一个名为imgs的list中,代码形式同上。
return imgs
最后的return语句是函数的返回值,这里返回我们得到的图片的list。
所以回到主程序中,我们发现在主程序中利用一行语句实现了这么多操作,我们得到了在指定文件夹'camera_cal'下的所有图片。我们也对函数的定义,调用应该有了一个简单的认识了。继续看代码。
今天事情比较多,晚上接着写~